Scholarship@Western
Scholarship@Western
Electronic Thesis and Dissertation Repository
4-17-2019 9:30 AM
Development of a Force-Based Ream Vector Measurement
Development of a Force-Based Ream Vector Measurement
System For Glenoid Reaming Simulation
System For Glenoid Reaming Simulation
David AxfordThe University of Western Ontario
Supervisor Ferreira, Louis
The University of Western Ontario Co-Supervisor Johnson, Jim
The University of Western Ontario
Graduate Program in Biomedical Engineering
A thesis submitted in partial fulfillment of the requirements for the degree in Master of Engineering Science
© David Axford 2019
Follow this and additional works at: https://ir.lib.uwo.ca/etd
Part of the Biomedical Devices and Instrumentation Commons
Recommended Citation Recommended Citation
Axford, David, "Development of a Force-Based Ream Vector Measurement System For Glenoid Reaming Simulation" (2019). Electronic Thesis and Dissertation Repository. 6106.
https://ir.lib.uwo.ca/etd/6106
Glenoid reaming is a technically challenging step during total shoulder arthroplasty surgery
that may be improved through frequent practice and exposure to simulation training. At our
institution, a vibration haptic glenoid reaming simulator is being developed that simulates the
vibrations felt during glenoid reaming. This thesis presents the development of a force-based
reamer vector measurement system that allows the simulator to measure the user’s net
applied force and reamer angle of approach. This capability allows for the simulation of
eccentric reaming maneuvers commonly used to adjust the glenoid orientation. The system
error was characterized and evaluated using a robot to operate a surgical reaming tool.
Finally, a study was performed that assessed the ability of surgeons to correct glenoid
retroversion while using the haptic vibration simulator. Overall, the surgeons were able to
correct glenoid orientation within 1 degree of the target orientation, according to the
simulator’s reaming vector measurement system.
Keywords
Total Shoulder Arthroplasty, Surgical Simulation, Glenoid Reaming, Glenoid Retroversion
Co-Authorship
Chapter 1: David Axford – sole author
Chapter 2: David Axford – study design, data collection, wrote manuscript
Louis Ferreira – study design, reviewed manuscript
Jim Johnson – reviewed manuscript
Chapter 3: David Axford – study design, data collection, statistical analyses, wrote
manuscript
Louis Ferreira – study design, reviewed manuscript
Jim Johnson – reviewed manuscript
Chapter 4: David Axford – study design, data collection, wrote manuscript
Louis Ferreira – study design, reviewed manuscript
Jim Johnson – reviewed manuscript
Acknowledgments
Firstly, I would like to thank my supervisors, Dr. Louis Ferreira and Dr. Jim Johnson. Dr.
Ferreira, I would like to thank you for your guidance and support on this project. Thank you
for your mentorship and for the time and energy you have given to help me succeed; your
expertise and insight have been invaluable. Dr. Johnson, I would like to thank you as well for
mentorship and for all your efforts to see me succeed. Thank you for introducing me to
HULC lab and for getting me involved in number of projects that allowed me to collaborate
with some amazing people. To both of you, thank you for the incredible opportunities you
have given me. You have taught me so much and it has been a pleasure working for you.
I would like to thank Dr. Marie-Eve LeBel for her help with rounding up test subjects and
being there to help with the clinical direction of my project. Your input was appreciated, and
I am grateful to have been able to work so closely with the clinical staff at the hospital.
To my lab mates in the Bioengineering and Surgical Mechatronics labs, thank you for
making my time here so enjoyable. You have been incredible to work with and I wish you all
the best in whatever you pursue next. I want to give a special thanks to Mayank Sharma who
let me benefit from all his hard work programming the robot. Your help definitely improved
my project.
Lastly, I would like to thank my family for their unconditional love and support. Without
you I would not be where I am today. I am so thankful to be a part of a tight-knit family and I
Table of Contents
Abstract ... i
Co-Authorship ... ii
Acknowledgments ... iii
Table of Contents ... iv
List of Tables... viii
List of Figures ... xi
Nomenclature ...xvi
Chapter 1 - Introduction ...1
1.1 Shoulder Anatomy ...1
1.2 Glenohumeral Arthritis ...3
1.3 Total Shoulder Arthroplasty...4
1.4 Glenoid Reaming ...5
1.5 Surgical Training ...5
1.6 Surgical Simulation ...6
1.7 Simulation in Orthopaedics ...8
1.7.1 Simbionix ARTHRO Mentor ...8
1.7.2 Sim-Ortho ...9
1.7.3 VirtaMed ArthroS... 10
1.7.4 TraumaVision ... 11
1.7.5 ArthroVision ... 12
1.7.6 Precision OS ... 13
1.7.7 Osso VR ... 14
1.9.1 Encoded Linkage ... 18
1.9.2 Electromagnetic Tracking ... 19
1.9.3 Optical Tracking ... 19
1.10 Force Measurement Systems ... 20
1.11 Rationale ... 22
1.12 Objectives and Hypotheses ... 23
1.13 Thesis Overview ... 24
Chapter 2 - Development of a Force-based Reaming Vector Measurement System 25 2.1 Anatomical and Simulator Coordinate System Definition ... 25
2.1.1 Defining a Glenoid Coordinate System and Desired Measurands ... 25
2.1.2 Defining a Glenoid Reaming Simulator Coordinate System ... 28
2.2 System Design for Force Triangulation ... 29
2.2.1 System Hardware Design... 29
2.2.2 Force Data Acquisition System ... 30
2.3 Cantilever Load Cell Calibration ... 32
2.4 Force-based Measurement System Calibration ... 36
2.4.1 Measurand Calibration ... 39
2.4.2 Error Compensation... 47
2.5 Final Calibration Performance Assessment ... 61
2.6 Summary ... 67
Chapter 3 - Reamer Vector Measurement System Error Characterization ... 68
3.1 Experimental Setup ... 68
3.1.1 Force Application System ... 68
3.1.2 Force Recording Systems ... 70
3.1.5 Optical Tracking Coordinate Systems ... 72
3.2 Loading Protocol ... 75
3.3 Force-Control Loading Repeatability ... 77
3.4 Reamer Vector Measurement System Accuracy with Force-Control Loading ... 78
3.4.1 Coordinate System Alignment ... 78
3.4.2 Version Angle of Approach Accuracy ... 80
3.4.3 Inclination Angle of Approach Accuracy ... 87
3.4.4 Net Force Magnitude Accuracy ... 93
3.5 Summary ... 95
Chapter 4 - Haptic Glenoid Reaming Simulator for Shoulder Arthroplasty: Early Experience with Expert Surgeons ... 96
4.1 Generating Simulated Computed Tomography DICOM Images for Pre-Operative Templating ... 96
4.2 Modular Shoulder Model Design ... 104
4.3 Study Protocol ... 107
4.4 Results ... 110
4.4.1 Pre-Operative Templating Results ... 110
4.4.2 Reaming Performance Results ... 112
4.5 Summary ... 118
Chapter 5 - Discussion and Conclusions ... 120
5.1 Summary ... 120
5.2 Strengths ... 123
5.3 Limitations ... 124
5.4 Future Work ... 124
Appendix B: Reamer Vector Measurement System Error Data Averaged Over Five Trials for Results Presented in Chapter 2 ... 147
Appendix C: LabVIEW Calibration and Error Compensation VIs ... 151
Appendix D: Simulated CT Generation MATLAB Code ... 160
Appendix E: KUKA Light Weight Robot Force-Control Repeatability Data
Presented in Chapter 3 ... 164
Appendix F: Custom Load Cell Mount Critical Dimensions ... 172
List of Tables
Table 2.1: Measurement System Sweep Error Summary ... 45
Table 2.2: Measurand Naming Convention and Calibration Summary ... 48
Table 2.3: Force Measurement System Error Summary ... 63
Table 3.1: Force Control Loading Repeatability Intraclass Correlation Coefficients ... 77
Table 3.2: Version Angle of Approach Overall Error – Reamer Vector Measurement System vs. Certus Optotrak ... 80
Table 3.3: Version Angle of Approach Overall Error – ATI Nano25 Load Cell vs. Certus Optotrak ... 82
Table 3.4: Version Angle of Approach Overall Error – Reamer Vector Force Measurement System vs. Certus Optotrak minus Load Cell Errors ... 84
Table 3.5: Inclination Angle of Approach Overall Error – Reamer Vector Measurement System vs. Certus Optotrak ... 87
Table 3.6: Inclination Angle of Approach Overall Error – ATI Nano25 Load Cell vs. Certus Optotrak ... 89
Table 3.7: Inclination Angle of Approach Overall Error – Reamer Vector Force Measurement System vs. Certus Optotrak with Load Cell Errors Subtracted ... 91
Table 3.8: Net Force Magnitude Overall Error – Reamer Vector Measurement System vs. ATI Nano25 Load Cell ... 93
Table 4.1: Glenoid Retroversion Measurements from the Generated CT Images ...111
Table 4.2: Intended Angle of Retroversion Correction ...112
Table 4.5: Difference Between Intended and Final Glenoid Version Orientation ...114
Table 4.6: Final Glenoid Inclination Angle Summary ...117
Table 4.7: Net Force Magnitude Performance Summary ...118
Table A.1: Average Version Angle of Approach Error (°) - Trial 1 ...132
Table A.2: Average Version Angle of Approach Error (°) - Trial 2 ...133
Table A.3: Average Version Angle of Approach Error (°) - Trial 3 ...134
Table A.4: Average Version Angle of Approach Error (°) - Trial 4 ...135
Table A.5: Average Version Angle of Approach Error (°) - Trial 5 ...136
Table A.6: Average Inclination Angle of Approach Error (°) - Trial 1...137
Table A.7: Average Inclination Angle of Approach Error (°) - Trial 2...138
Table A.8: Average Inclination Angle of Approach Error (°) - Trial 3...139
Table A.9: Average Inclination Angle of Approach Error (°) - Trial 4...140
Table A.10: Average Inclination Angle of Approach Error (°) - Trial 5 ...141
Table A.11: Average Net Force Magnitude Error (N) - Trial 1 ...142
Table A.12: Average Net Force Magnitude Error (N) - Trial 2 ...143
Table A.13: Average Net Force Magnitude Error (N) - Trial 3 ...144
Table A.14: Net Force Magnitude Error (N) - Trial 4 ...145
Table A.15: Net Force Magnitude Error (N) - Trial 5 ...146
Table B.1: Average Version Angle of Approach Error (°) – All Trials ...148
Table B.3: Average Net Force Magnitude Error (N) – All Trials ...150
Table E.1: Version Angle of Approach Measurements from Optotrak Certus for Repeatability
Analysis ...164
Table E.2: Version Angle of Approach Measurements from the ATI Nano25 Load Cell for
Repeatability Analysis ...165
Table E.3: Version Angle of Approach Measurements from the Reamer Vector Measurement
System for Repeatability Analysis ...166
Table E.4: Inclination Angle of Approach Measurements from Optotrak Certus for
Repeatability Analysis ...167
Table E.5: Inclination Angle of Approach Measurements from the ATI Nano25 Load Cell for
Repeatability Analysis ...168
Table E.6: Inclination Angle of Approach Measurements from the Reamer Vector
Measurement System for Repeatability Analysis ...169
Table E.7: Net Force Magnitude Measurements from the ATI Nano25 Load Cell for
Repeatability Analysis ...170
Table E.8: Net Force Magnitude Measurements from the Reamer Vector Measurement
List of Figures
Figure 1.1: Glenohumeral Joint Anatomy ... 1
Figure 1.2: Glenoid Erosion Morphologies (classified by Walch et al.) ... 3
Figure 1.3: Total Shoulder Arthroplasty Glenoid Component ... 4
Figure 1.4: Simbionix ARTHRO Mentor ... 9
Figure 1.5: OSSimTech Sim-OrthoTM ... 10
Figure 1.6: VirtaMed ArthroS ... 11
Figure 1.7: Swemac TraumaVision ... 12
Figure 1.8: Swemac ArthroVision ... 13
Figure 1.9: Precision OS - VR headset and controllers (left), VR simulation (right) ... 14
Figure 1.10: Glenoid Reaming Simulator [61] ... 17
Figure 1.11: Touch 3D Systems Serial Linkage Haptic Device ... 18
Figure 1.12: Strain Gauge Schematic ... 20
Figure 1.13: Wheatstone Bridge Circuit ... 21
Figure 2.1: Glenoid-Centered Coordinate System Definition ... 26
Figure 2.2: Angle of Approach Definition ... 27
Figure 2.3: Simulator Coordinate System Definition ... 28
Figure 2.4: Force-based Measurement System Design and Instrumentation ... 31
Figure 2.5: Data acquisition system ... 32
Figure 2.7: Cantilever A Calibration Curve ... 34
Figure 2.8: Cantilever B Calibration Curve ... 35
Figure 2.9: Cantilever C Calibration Curve ... 36
Figure 2.10: Commercial Load Cell Setup for Force-based Measurement System Calibration ... 37
Figure 2.11: KUKA 7 Axes Light Weight Robot and Reamer Mount ... 38
Figure 2.12: Calibration Curve for Version Angle Calculation ... 40
Figure 2.13: Calibration Curve for Inclination Angle Calculation ... 42
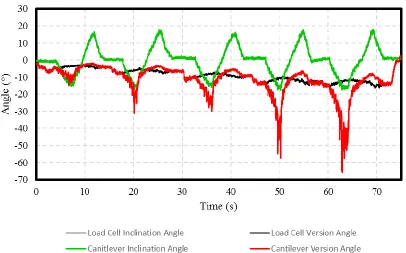
Figure 2.14: Sample Reamer Angle of Approach Output from Force-based Measurement System Calibration ... 47
Figure 2.15: Version Angle Error Compensation Stage 1 Calibration Curve ... 49
Figure 2.16: Version Angle Error Compensation Stage 2 Surface Fit ... 50
Figure 2.17: Version Angle Error Compensation Stage 3 Calibration Curve ... 52
Figure 2.18: Inclination Angle Error Compensation Stage 1 Calibration Curve ... 53
Figure 2.19: Inclination Angle Error Compensation Stage 2 Surface Fit ... 55
Figure 2.20: Force on ML Axis Error Compensation Stage 1 Calibration Curve ... 56
Figure 2.21: Force on ML Axis Error Compensation Stage 2 Calibration Curve ... 57
Figure 2.22: Force on ML Axis Error Compensation Stage 2 Calibration Curve ... 58
Figure 2.23: Net Force Error Compensation Stage 2 Calibration Curve ... 60
Figure 2.26: Inclination Angle Error After Calibration and Error Prediction ... 65
Figure 2.27: Net Force Error After Calibration and Error Prediction ... 66
Figure 3.1: Reamer Tool-Tip Coordinate System ... 69
Figure 3.2: Optical Tracker Placement ... 71
Figure 3.3: Optical Tracking Data Acquisition Setup ... 72
Figure 3.4: Robot and Load Cell Alignment... 73
Figure 3.5: Digitization for Optical Tracker Coordinate System Construction ... 74
Figure 3.6: Reamer Angle of Approach Defined by a Polar Coordinate System ... 76
Figure 3.7: Certus Optotrak and ATI Nano25 Load Cell Coordinate System Alignment ... 79
Figure 3.8: Version Angle of Approach Surface Plots – Reamer Vector Measurement System vs. Certus Optotrak ... 81
Figure 3.9: Version Angle of Approach Surface Plots – ATI Nano25 Load Cell vs. Certus Optotrak ... 83
Figure 3.10: Version Angle of Approach Surface Plots – Reamer Vector Force Measurement System vs. Certus Optotrak minus Load Cell Errors ... 86
Figure 3.11: Inclination Angle of Approach Surface Plots – Reamer Vector Measurement System vs. Certus Optotrak ... 88
Figure 3.12: Inclination Angle of Approach Surface Plots – ATI Nano25 Load Cell vs. Certus Optotrak ... 90
Figure 3.13: Inclination Angle of Approach Surface Plots – Reamer Vector Force Measurement System vs. Certus Optotrak with Load Cell Errors Subtracted ... 92
Figure 4.1: CT Scapula Segmentation and 3D Model Generation ... 97
Figure 4.2: Sectioning the Glenoid From the 3D Scapula Model ... 98
Figure 4.3: Glenoid Version Alteration ... 99
Figure 4.4: Altered Scapular Mask Overlaid onto CT Slices ...100
Figure 4.5: DICOM Native Scapula Removal ...101
Figure 4.6: DICOM Soft Tissue Fill ...102
Figure 4.7: DICOM Trabecular Bone Segmentation ...103
Figure 4.8: Final Altered DICOM Image ...104
Figure 4.9: Shoulder Model Scapular Component ...105
Figure 4.10: Shoulder Model Glenoid Component ...106
Figure 4.11: Shoulder Model 3D Printed Component Assembly ...106
Figure 4.12: Reaming Simulator 3D Printed Glenoid and Soft Shoulder Model ...107
Figure 4.13: Familiarization Stage Graphical Indicator ...108
Figure 4.14: Glenoid Reaming Assessment Stage Graphical Indicator ...110
Figure C.1: Data Acquisition Block Diagram ...151
Figure C.2: Calibration and Error Compensation Block Diagram ...152
Figure C.3: Cantilever A Calibration Block Diagram ...153
Figure C.4: Cantilever B Calibration Block Diagram ...153
Figure C.7: Version Angle Calibration Block Diagram ...154
Figure C.8: Version Angle Error Compensation Stage 1 Block Diagram ...154
Figure C.9: Version Angle Error Compensation Stage 2 Block Diagram ...155
Figure C.10: Version Angle Error Compensation Stage 3 Block Diagram ...155
Figure C.11: Inclination Load Ratio Block Diagram ...156
Figure C.12: Inclination Angle Calibration Block Diagram ...156
Figure C.13: Inclination Angle Error Compensation Stage 1 Block Diagram ...156
Figure C.14: Inclination Angle Error Compensation Stage 2 Block Diagram ...157
Figure C.15: FML Calibration Block Diagram ...157
Figure C.16: FML Error Compensation Stage 1 Block Diagram ...158
Figure C.17: FML Error Compensation Stage 2 Block Diagram ...158
Figure C.18: FML Error Compensation Stage 3 Block Diagram ...158
Figure C.19: Fnet Error Compensation Stage 1 Block Diagram ...159
Figure C.20: Fnet Error Compensation Stage 2 Block Diagram ...159
Figure C.21: Fnet Error Compensation Stage 3 Block Diagram ...159
Nomenclature
Nomenclature is listed in order of appearance
TSA Total Shoulder Arthroplasty
VR Virtual Reality
GRS Glenoid Reaming Simulator
EM Electromagnetic
DOF Degree-of-freedom
GC Glenoid Center
AI Inferior Scapular Angle Point
TS Trigonum Spinae
SI Superior – Inferior
AP Anterior – Posterior
ML Medial – Lateral
VLR Version Cantilever Load Ratio
ILR Inclination Cantilever Load Ratio
Fnet Net Force Magnitude
FSI, FAP, FML Force magnitude acting along the SI, AP, and
ML axes, respectively
𝑖𝑛𝑐𝐴𝑛𝑔𝑙𝑒, 𝑣𝑒𝑟𝐴𝑛𝑔𝑙𝑒 Inclination angle and version angle,
𝐹𝑐𝑎𝑛𝑡𝐴, 𝐹𝑐𝑎𝑛𝑡𝐵, 𝐹𝑐𝑎𝑛𝑡𝐶 Force acting on cantilever A, B and C,
respectively
VerC, VerC1, VerC2, VerC3 Calibrated version angle and calibrated version
angle with 1, 2 and 3 stages of error
compensation, respectively
IncC, IncC1, IncC2 Calibrated inclination angle and calibrated
inclination angle with 1 and 2 stages of error
compensation, respectively
FMLC, FMLC1, FMLC2, FMLC3 Calibrated force, FML, and calibrated force, FML,
with 1, 2 and 3 stages of error compensation,
respectively
FnetC, FnetC1, FnetC2, FnetC3 Calibrated force, Fnet, and calibrated force, Fnet,
with 1, 2 and 3 stages of error compensation,
respectively
ICC Intraclass Correlation Coefficient
xream, yream, zream Tool-tip coordinate system axes
𝛾 Net angle between the neutral axis and the
reamer shaft
𝜃 Angle between the positive AP axis and the
reamer shaft on a sagittal plane
CT Computed Tomography
Chapter 1
1
Introduction
Overview: This chapter discusses relevant background information
and the motivation for this research. Relevant anatomy is
discussed and surgical training and simulation are introduced.
Current orthopaedic simulator technologies are reviewed and the
current state of development of a surgical simulator from our
institution is presented. The rationale and the specific objectives
for this research are also described.
1.1
Shoulder Anatomy
The glenohumeral joint is a ball-and-socket joint commonly referred to as the shoulder
(Figure 1.1). The shoulder is formed by the articulation between the proximal head of the
humerus and the shallow cavity of the scapula called the glenoid fossa [1]. For this
research, the focus will be on the glenoid fossa of the scapula.
Figure 1.1: Glenohumeral Joint Anatomy Scapula
Glenoid Fossa
Humeral Head
The glenoid fossa, commonly called the glenoid, is a shallow cup-like structure that
allows for large relative motion between the humerus and the scapula giving the shoulder
the largest range of motion of any joint in the human body. The glenoid articular surface
is composed of cartilage and covers a layer of dense cortical bone called subchondral
bone. Beyond the subchondral bone is cancellous bone, also known as trabecular bone.
Since the glenoid structure allows for a large range of motion, numerous muscular and
ligamentous structures are required to maintain joint stability [2]–[4]. However, the
shoulder is susceptible to instability, injury and pathology that may require surgical
1.2
Glenohumeral Arthritis
Osteoarthritis is characterized by the loss of cartilage in synovial joints and is associated
with bone osteophyte formation, hardening of the subchondral bone and thickening of the
joint capsule [7]. The prevalence of osteoarthritis increases with age [7] and is the most
common cause of disability among adults [8]. It has been estimated to affect 27 million
adults in the United States in 2005 [9]. When arthritis occurs in the shoulder it can cause
significant pain and, in some cases, results in posterior erosion of the glenoid and
posterior subluxation of the humeral head as illustrated in Figure 1.2 [10]. In the
occurrence of severe glenohumeral osteoarthritis, surgical intervention may be required
to reduce pain and improve patient quality of life.
Figure 1.2: Glenoid Erosion Morphologies (classified by Walch et al.) A1
A2
B1
B2
C
Walch et al. classified glenoid erosion morphology. Type A is characterized by even
wear of the glenoid and type B is classified by posterior subluxation of the humeral
head that can result in posterior wear of the glenoid (B2). Type C is characterized by
1.3
Total Shoulder Arthroplasty
Total shoulder arthroplasty (TSA) is a commonly performed procedure that is increasing
in prevalence for the treatment of severe glenohumeral osteoarthritis [11]–[13]. TSA
involves replacing the proximal head of the humerus with a metal ball-and-stem implant
and resurfacing the glenoid with a polyethylene implant [14] (Figure 1.3). Overall, TSA
has shown to have a 90 percent success rate [15] with complications occurring in 10-15
percent of cases [16]–[18]. Of these complications, the largest contributor is loosening of
the glenoid component which accounts for 32-38 percent of complications and occurs in
4-5 percent of all TSA cases [16], [17], [19]. When glenoid component loosening occurs,
a revision surgery is often required to reduce patient pain and discomfort. The process of
preparing the glenoid to receive the polyethylene implant is the focus of this research.
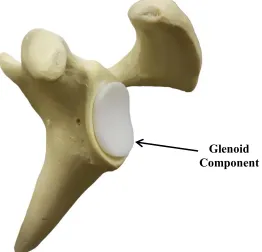
Figure 1.3: Total Shoulder Arthroplasty Glenoid Component Glenoid Component
In total shoulder arthroplasty, the glenoid is resurfaced with a polyethylene
1.4
Glenoid Reaming
To prepare the glenoid surface for the implant, a surgeon often uses a surface reamer to
remove the cartilage layer and expose the subchondral bone. This procedure is
technically challenging and is critical to the success of the implant [20], [21]. When a
patient has even wear of the glenoid, the surgeon will likely ream perpendicular to the
glenoid to prepare the surface; this is called concentric reaming. However, if there is
posterior wear of the glenoid, the surgeon may ream at a non-perpendicular angle to
correct glenoid retroversion; this is called eccentric reaming. By reaming eccentrically,
the surgeon can remove bone material from the anterior edge of the glenoid and correct
the glenoid orientation [22]. If glenoid retroversion is not corrected then the glenoid
component is more susceptible to loosening [19], [23], [24]; however, studies have also
shown that high degrees of version correction should be avoided to ensure that there is
sufficient bone stock to achieve proper implant fixation [25], [26]. This battle to preserve
bone stock but correct glenoid orientation is a large motivation for the use of augmented
implants [27], but these implants often require more sophisticated tooling to prepare the
glenoid surface. There are many factors that a surgeon must consider when performing
glenoid reaming to achieve proper implant fixation which makes this procedure
technically challenging. Importantly, technical surgical tasks such as glenoid reaming can
be difficult for trainees to learn [28].
1.5
Surgical Training
Historically, surgical training programs have operated with the mantra, “see one, do one, teach one” [29]. This training structure is a time and volume-based training program
where surgical residents work many hours and are exposed to many procedures.
However, the introduction of resident duty hour limits and an emphasis on patient safety
[30] has begun to shift training programs from emphasizing time and volume-based
training to competency-based training [29]. Although the duty hour restrictions are an
attempt to prevent medical errors due to sleep deprivation and improve resident quality of
life [31], some believe that the reduced hours will negatively impact clinical exposure for
shown that technical errors in surgery can cause patient disability and even death [33]–
[36], and some of these errors have been linked to the inexperience of trainees [37]. With
the reduction in resident work hours and a focus on patient care, more structured training
programs with surgical assessments that objectively track resident proficiency are needed
[38].
1.6
Surgical Simulation
A simulator is a device that recreates an aspect of a real-world system and allows the user
to interact with that system [39]. Simulation is a tool that has been implemented in
training program curriculums in industries such as aviation [40]. In the field of medicine,
surgical simulators recreate surgical situations for trainees to practice specific skills
related to surgery [41]. This method of training is advantageous because it can provide
objective measures of trainee performance [38] while distancing the trainee from the
patient until the necessary skills are acquired [33]. Simulation has shown to be a
successful training modality in surgery as skills developed through simulation have been
shown to translate to the operating room [42]–[44].
There are two main classes of simulators; low- and high- fidelity systems. Low-fidelity
simulators allow for the practice of a single skill such as knot tying while high-fidelity
simulators replicate an entire operative procedure.[41] Within each of these classes there
are several types of simulators; live animals, cadavers, bench-top and laparoscopic box
simulators, virtual-reality (VR) simulators, augmented reality (AR) simulators, and robot
assisted laparoscopic surgery (RAS) simulators [41], [45].
Animal Models
Animal models are high-fidelity simulators and share many of the features of human
surgery. They allow residents to work as a team and practice communication skills during
a procedure which trains residents on skills beyond the required technical and motor
skills. Animal models have also been shown to improve technical skills of trainees [46].
However, because of the anatomical differences between animals and humans and the
Cadaver Models
Cadaver models are considered the gold standard in surgical simulation for some
disciplines [47] because they allow trainees to train with high-fidelity simulation with
accurate representation of anatomy. Although cadaver models use dead tissue, in some
instances the cadaveric tissues can be perfused with blood adding to the realism of the
simulation [47]. The drawbacks to cadaver models include high cost and limited
availability.
Bench-top Simulators
Bench-top simulators are commonly used for training in laparoscopic surgery and the
skills acquired through this simulation method have shown to be correlated with
performance in the operating room [45]. These trainers are commonly low-fidelity and
simulate simple tasks like cutting, suturing and transferring of objects [48]. However,
high-fidelity bench-top simulators exist that incorporate synthetic and animal tissues [41].
The downsides to these simulators are that they are expensive and there is a limit to the
degree of realism possible when using synthetic materials.
VR Simulator
VR simulators allow trainees to manipulate and interact with a virtual surgical
environment. Some of the advantages of VR simulation are the high accuracy of
anatomical details, simulator reusability and simulator versatility. Unlike cadaver models
or live animal models, the simulator can be used to repeat a procedure multiple times
until a trainee is comfortable with the procedure. Secondly, a single simulator can be used
to simulate several surgical procedures. VR simulators are able to provide objective
measures to score the proficiency of trainees [49] and can provide feedback to the trainee
which may remove the need for supervision [41]. The downsides of VR simulation are
the high cost, lack of high-fidelity haptic feedback, and limited realism when compared
AR Simulator
AR simulators are similar to VR simulation however they combine the virtual
environment with the physical environment by using real physical materials, instruments
and feedback to produce higher fidelity haptic feedback [50]. Like VR simulation, AR
simulation is limited by its high cost.
RAS Simulation
RAS simulation is a relatively new development that incorporates VR simulation into
training on a surgical robot such as the da Vinci system. There are multiple simulators
that are used for the da Vinci system and are generally low-fidelity systems that train
basic motor and hand-eye coordination skills [41]. These systems are still in their infancy
and require further validation studies. A major drawback to these systems is the highly
specialized application and high cost.
1.7
Simulation in Orthopaedics
1.7.1
Simbionix ARTHRO Mentor
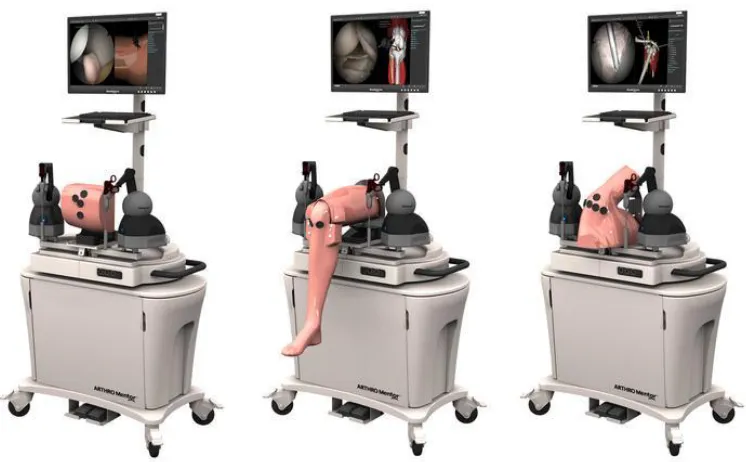
Simbionix ARTHRO Mentor (3D Systems, Littleton, USA) was the first available
arthroscopy training simulator (Figure 1.4). It is a virtual reality simulator for training
orthopaedic residents on knee, hip and shoulder arthroscopic diagnostic procedures. It is
equipped with anatomical models, surgical instruments and a haptic device to apply
resistance to user motion according to user input. The simulator can simulate a variety of
procedures and provide performance metrics for training assessment. The onboard screen
shows the virtual environment where the procedure is being performed. The system has
Figure 1.4: Simbionix ARTHRO Mentor1
1.7.2
Sim-Ortho
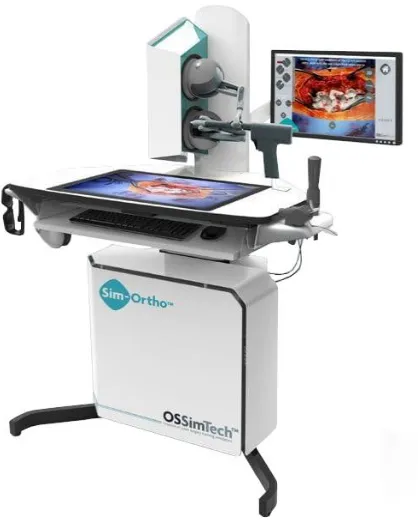
OSSimTech Sim-OrthoTM (OSSimTech, Montreal, Canada) is a virtual reality simulator
that provides a complete training curriculum for a number of knee, spine and trauma open
surgery procedures (Figure 1.5). Among the available procedures is partial and total knee
replacement with hip arthroplasty planned to be added in 2019. The system is equipped
with a haptic device for force feedback and a 3D anatomy viewer [53].
Simbionix ARTHRO Mentor (3D Systems, Littleton, USA) virtual reality arthroscopy
Figure 1.5: OSSimTech Sim-OrthoTM 2
1.7.3
VirtaMed ArthroS
VirtaMed ArthroSTM (VirtaMed, Zurich, Switzerland) is a virtual reality arthroscopy
surgical simulator (Figure 1.6). With this simulator, trainees use original operating room
instruments equipped with magnetic sensors to interact with the system’s anatomical
models. There is no active force feedback provided by the simulator, but passive
feedback is provided as the surgical tool interacts with the tissue model. Various training
modules can be accessed with the simulator. This system has been validated for its
effectiveness as a training tool [54].
2
Modified from Medical EXPO [Internet]. cited [March 14, 2019]. Available from http://www.medicalexpo.com/prod/ossimtech/product-119826-829001.html
OSSimTech Sim-OrthoTM (OSSimTech, Montreal, Canada) virtual reality simulator
Figure 1.6: VirtaMed ArthroS3
1.7.4
TraumaVision
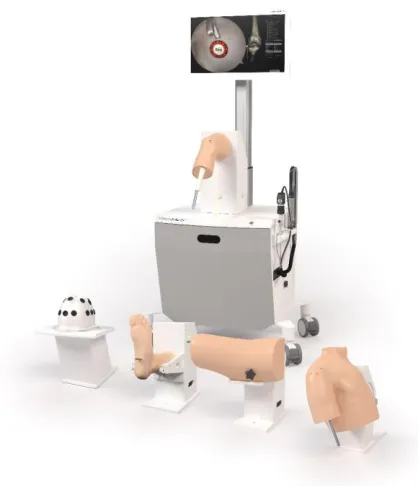
TraumaVision (Swemac, Linköping, Sweden) is a virtual reality simulator designed to
simulate orthopedic trauma surgeries such as hip fracture repair (Figure 1.7). The system
includes two screens that show simulated views of the patient and fluoroscopy imaging.
Haptic feedback is provided through the simulators instruments as the trainee interacts
with different tissues and drills through different bone layers. TraumaVision is equipped
with training modules and provides performance metrics so that trainees can learn based
on their performance scores [55], [56].
VirtaMed ArthroSTM (VirtaMed, Zurich, Switzerland) virtual reality arthroscopy
Figure 1.7: Swemac TraumaVision4
1.7.5
ArthroVision
ArthroVision (Swemac, Linköping, Sweden) is a virtual reality box-trainer simulator
designed to teach basic arthroscopy skills (Figure 1.8). Unlike some lower fidelity
box-trainer simulators, the ArthroVision includes haptics and force feedback to make the
training experience more realistic; however, the virtual environment does not simulate
anatomical structures but only simulates an empty box. The simulator has training
modules for simple tasks like tracking a moving object and steady camera motion [57].
4
Modified from TraumaVision [Internet]. Swemac Innovation AB, Linköping, Sweden. cited [March 14, 2019]. Available from http://www.swemac.com/simulators/traumavision
TraumaVision (Swemac, Linköping, Sweden) virtual reality orthopedic trauma
Figure 1.8: Swemac ArthroVision5
1.7.6
Precision OS
Precision OS (Precision OS Technology, Vancouver, Canada) is a fully immersive VR
simulation trainer and pre-operative planner (Figure 1.9). The user wears a VR headset
with two handheld controllers to visualize and manipulate the surgical environment. The
system can generate some haptic feedback but due to the controller design, no force
feedback is generated. The system is equipped with educational modules to improve
surgical skill of novice surgeons. Precision OS can also be used as a pre-operative
planning tool where surgeons can upload a peri-articular fracture and develop a
pre-operative plan. The trainee/surgeon is then able to perform the surgery virtually before
ArthroVision (Swemac, Linköping, Sweden) virtual reality arthroscopy skills
performing the procedure in the operating room [58]. In December of 2018, Precision OS
released a training module that will instruct trainees how to implant an augmented
glenoid baseplate for reverse shoulder arthroplasty [59].
Figure 1.9: Precision OS - VR headset and controllers (left)6, VR simulation (right)7
1.7.7
Osso VR
Similar to the Precision OS system, Osso VR (Osso VR, Palo Alto, USA) is a fully
immersive VR system that creates a virtual operating room that the user visualizes using
a VR head set and interacts with using two handheld controllers. The system provides
haptic feedback through the two controllers and actively measures performance metrics
to assess the trainee’s proficiency. A unique feature that this system incorporates is the
ability to train a team of surgeons in one virtual environment from any location. This
allows for surgeons to practice team communication in an operating room setting [60].
6
Modified from VRfocus [Internet]. cited [March 14, 2019]. Available from
https://www.vrfocus.com/2018/11/precision-os-secures-2-3-million-investment-for-vr-orthopedic-surgical-education/
7
Modified from VRroom [Internet]. cited [March 14, 2019]. Available from https://vrroom.buzz/vr-news/tech/precision-os-makes-surgical-vr-training-thing
Precision OS immersive VR simulation trainer and pre-operative planner. The
simulator uses a headset and two handheld controllers (left). The simulator replicates
1.8
Glenoid Reaming Simulator
At St. Joseph’s Hospital in London, Canada, the first glenoid reaming simulator (GRS) is
being developed. The first stage of development is described by Kusins et al.[61]. Kusins
et al. determined that as a surgeon removes bone with a surgical reamer, the vibration felt
through the reamer is correlated with the bone layer being removed (ie. cartilage,
subchondral and cancellous bone) [61]. This vibration information is believed to be a
valuable tool for training novice surgeons how to perform glenoid reaming. Therefore,
the GRS simulates glenoid reaming by reproducing the vibrations that a surgeon would
feel during reaming. The simulator measures the force applied by the trainee over time
and uses this information to calculate a “virtual depth” of ream. Knowing the depth of
ream, the simulator can determine what bone layer the user is reaming and provide
vibrational feedback according to that bone layer.
The GRS is composed of three main components, the force measurement system, the
vibration transduction system and the user interface (shown in Figure 1.10). The force
measurement system consists of a uniaxial load cell mounted to the support wall of the
simulator and the simulator housing is mounted onto the load cell. Inside of the simulator
housing is the vibration transduction system. This system consists of a haptic vibration
transducer (Model TST329, Clark Synthesis Inc.,Colorado, USA) encased in foam
mounted to a metal rod. The foam surrounding the transducer is used to dampen the
acoustic vibrations produced by the transducer and simulate the passive motion of the
scapula that occurs when a surgeon applies a force to the glenoid during reaming. The
metal rod fixed to the vibration transducer is fastened on the opposite end to a metal base
plate. The simulator user interface consists of a truncated 3D printed scapula model from
a patient CT image mounted to the base plate of the simulator. To interact with the
system, the user is provided with a fully functional pneumatic surgical reamer that is
fitted with a non-fluted 3D printed reaming tip so that the reamer does not remove any
material when engaged with the 3D printed scapula. The load cell is oriented so that its
measurement axis is normal to the face of the 3D printed glenoid mounted to the
simulate concentric reaming cases; however, the simulator cannot measure off-axis forces
and therefore cannot simulate off-axis or eccentric reaming.
When a user reams on the glenoid surrogate, the simulator measures the force applied by
the user and determines what vibration profile to play. This profile is sent to the vibration
transducer that causes the scapula to vibrate. The vibrations translate through the reamer
shaft and into the hands of the user. This vibration feedback is used as the main source of
Figure 1.10: Glenoid Reaming Simulator [61]
3D Printed Scapula
Vibration Transducer
Pneumatic Reamer
Simulator cross-section
Uniaxial Load Cell Support
Wall
Base Plate
Foam Insert
The glenoid reaming simulator was equipped with a 3D printed shoulder model (top)
and a uniaxial load cell (middle). The user reams on the shoulder model using a fully
1.9
Tracking Systems
1.9.1
Encoded Linkage
In many existing simulators, including the ARTHO Mentor, Sim-Ortho TraumaVision
and ArthroVision, a serial linkage device is used to measure the orientation of the user
instruments (similar to what is shown in Figure 1.11). Each joint of the linkage system
contains an encoder that measures the joint angle. From the measured joint angles, the
system can calculate the position and orientation of the surgical instrument. These
linkages can allow the user to interact with instruments that resemble surgical tools, but
they have limited maneuverability because they are attached to the simulator. The linkage
systems can also function as force feedback tools by providing resistance to motion of the
tool.
Figure 1.11: Touch 3D Systems Serial Linkage Haptic Device8
8
Modified from Touch [Internet]. 3D Systems., Rock Hill, USA. cited [March 15, 2019]. Available from https://www.3dsystems.com/haptics-devices/touch
Serial linkage device has encoded joints that measure the position and orientation of
1.9.2
Electromagnetic Tracking
Another method of tracking that is used with some simulators such as VirtaMed ArthroS
is electromagnetic (EM) tracking. EM tracking consists of an electromagnetic transmitter
that emits an electromagnetic field and sensors that are free to move within the generated
field. The magnetic field induces a current in a wire coil inside of the sensors that cues
the tracking system to know the position and orientation of the sensor within the
magnetic field. In the case of surgical simulation, the transmitter would likely be attached
to the simulator platform and a sensor would be placed on the surgical tool to track its
position and orientation with respect to the simulator platform. When using these
systems, care needs to be taken with the materials that are placed within the
electromagnetic field since ferritic materials can interfere with the field and introduce
errors [62] as can other equipment used within the simulator that emit an electromagnetic
field [63]. Electromagnetic tracking systems allow for unrestricted motion of the surgical
tool but cannot serve as a method of haptic feedback like a serial linkage arm. To
generate haptic feedback additional systems are required. Fully immersive VR systems
like Precision OS and OssoVR often use a combination of electromagnetic tracking,
accelerometers and gyroscopes.
1.9.3
Optical Tracking
Optical tracking systems are less common in surgical simulation applications but are very
prevalent in surgical settings [64]. An optical tracking system consists of an optical
camera and trackers. The system can use either active or passive trackers and may utilize
multiple cameras. Optical tracking systems often have higher accuracy than
electromagnetic systems and they not susceptible to magnetic interference, but since
these systems use cameras, there must always be a line-of-sight between the camera and
the trackers [64]. For this reason, implementation of optical systems can be difficult when
a line-of-sight is difficult to establish. Similar to electromagnetic tracking systems,
optical devices are not capable of generating haptic feedback so additional systems are
required when active haptic feedback is desired. Some commercial optical tracking
1.10 Force Measurement Systems
Forces cannot be seen or touched and therefore cannot be measured directly. Force is
measured by measuring a physical response to the presence of a force. The most common
way of measuring force is by measuring deflection or strain. When a force acts on an
object, the object changes shape in response to the force, this change is shape is called
strain. In one dimension, strain is the ratio of the change in length of a body to the initial
length of the body. When considering a volume, strain (volumetric strain) is the ratio of
the change in volume of a body to the original volume of the body.
Strain Gauges
To measure strain, a thin-film electrical resistive device called a strain gauge is often
used. This device operates under the principle that a change in length of a conductive
wire will cause a change in resistance. This is demonstrated by equation (1.1 where 𝑅 is the resistance, 𝜌 is the resistivity of the material, 𝑙 is the length of the material, and 𝐴 is
the cross-sectional area of the material.
𝑅 =𝜌𝑙 𝐴
(1.1)
The gauge structure consists of two leads connected by a long wire arranged in a grid
pattern. This grid pattern makes the gauge sensitive to strain in a single direction while
being insensitive to strain in the perpendicular directions.
Figure 1.12: Strain Gauge Schematic
Lead Tabs Grid Pattern
A strain gauge is composed of a grid pattern and lead tabs. The grid pattern causes
A common circuit used to measure strain is a Wheatstone bridge circuit. This circuit is a
voltage divider circuit containing four branches with a resistor on each branch (shown in
Figure 1.13). Depending on the application, a quarter, half or full Wheatstone bridge
circuit can be made by replacing one, two or four of the resistors in the bridge with strain
gauges, respectively. Different bridge configurations and strain gauge orientations are
used to isolate for different strain types (such as bending strain or axial strain). Once a
system has been designed and is measuring strain, the Wheatstone bridge circuit can be
calibrated to convert the measured strain into force applied.
Figure 1.13: Wheatstone Bridge Circuit
Load Cells
Load cells are calibrated commercial devices that use internal strain gauges to measure
loads and torques. These devices come in a variety of form factors with varying
measurement ranges and measurement resolutions. A load cell is designed with a certain
number of degree-of-freedom (DOF) that defines the number of independent load and
Vexcite Vout
R1 R3
R4
R2
A Wheatstone bridge is a voltage divider circuit with four branches; each containing
a resistive device. A strain gauge can be insert into one, two or four branches of the
whereas, multi-axis load cells such as a six degree-of-freedom (6DOF) load cell can
measure forces along 3 perpendicular axes and the moments about each of these three
axes.
1.11 Rationale
Glenoid reaming is a complex psychomotor skill and is a crucial part of a total shoulder
replacement procedure contributing significantly to the performance and longevity of the
prosthesis. Complex skills, like reaming, are difficult for novice surgeons to learn and
with the introduction of resident work hour restrictions, the acquisition of these skills will
become more difficult using historical training methods. Surgical simulation has been
introduced as a training modality that can assist trainees in developing required surgical
skills by providing objective progress measures while distancing the trainee from patients
until they are considered proficient.
As described above, in orthopaedic surgery, there have been several simulators developed
that train surgeons on basic laparoscopic techniques, bone fracture fixation and lower
extremity arthroplasty. Most recently, an immersive virtual reality simulator has
introduced a training module that instructs trainees on the installation of an augmented
base plate for reverse total shoulder arthroplasty; however, other than the simulator being
developed at our institution no simulator exists that uses tactile vibrations to simulate
glenoid reaming for total shoulder arthroplasty.
Previous development of the glenoid reaming simulator at our institution utilized a
uniaxial load cell to measure the forces applied perpendicular to the glenoid surface. This
enabled the simulator to simulate concentric reaming but prevented it from simulating
off-axis or eccentric reaming maneuvers. To simulate eccentric reaming, the simulator
must be able to measure the user applied net force vector magnitude and orientation as
well as the reamer’s angle of approach. Therefore, a reamer vector measurement system capable of measuring the reamer’s angle of approach and net force vector is required.
The developed reamer vector measurement system should continue to allow the user to
be hindered by line-of-sight issues or be susceptible to electromagnetic interference. This
thesis will discuss the development of a reamer vector measurement system that can be
easily incorporated into the simulator set-up. This system will not rely on optical or
electromagnetic tracking but will use forces to measure the reamer’s angle of approach
and the net force vector magnitude applied by the user. With the addition of a reamer
vector measurement system, the glenoid reaming simulator’s capabilities will be
expanded and allow for eccentric reaming simulation in the future.
1.12 Objectives and Hypotheses
The aim of this work is to develop a single measurement system that uses forces to
measure both the reamer angle of approach and net force magnitude and integrate this
system with the current glenoid reaming simulator.
Objective 1: To design and calibrate a reamer vector measurement system capable of measuring reamer angle of approach and net force magnitude.
Studies have shown that the typical “just” noticeable difference for forces applied during
various movements is 5-10 percent of the force being applied [65] and that the ability to
differentiate between force magnitudes decreases in the presence of low frequency haptic
noise [66]. It has been shown that typical reaming forces lie between 50 N and 100 N
[61] so a force measurement accuracy of 1 N is sufficient for a glenoid reaming
application. A study has reported that arm angle proprioception error ranges from 0.5 to
2.5 degrees [67] and given that glenoid retroversion measurements are typically reported
to the nearest degree [68], a reamer angle of approach accuracy of 0.5 degrees is
sufficient.
Hypothesis 1: The reamer angle of approach absolute error will be less than 0.5 degrees and the force magnitude absolute error will be less than 1 Newton.
Objective 2: To use the reamer vector measurement system to assess surgeon’s ability to correct glenoid version according to a pre-operative plan. Moreover, to compare these
A previous glenoid retroversion correction study has reported that of all the cases
presented, 100 percent of the cases with pre-operative retroversion of under 10 degrees
were corrected within 10 degrees of the ideal orientation and 67% of cases were corrected
within 5 degrees of the ideal orientation [68].
Hypothesis 2: The average difference between a surgeon’s ideal post-operative glenoid orientation and the actual post-operative orientation will be less than 5 degrees and the
average difference will increase as the initial glenoid retroversion angle increases.
1.13 Thesis Overview
Chapter 2 describes the development of the reamer vector measurement system. This
includes the system design, calibration and error reduction. The overall error of the
system at different force targets is reported.
Chapter 3 describes the system error characterization protocol and results. This includes a
description about the systems and testing protocol used to characterize the reamer vector
measurement system error. The error for reamer angle of approach and net force
magnitude measurements are reported as a function of reamer angle of approach.
Chapter 4 presents a study conducted using the reamer vector measurement system to
assess surgeon’s ability to correct glenoid retroversion according to a pre-operative plan.
The chapter describes a simulated CT generation method for repeatable measures and the
overall study protocol. The difference between surgeon’s pre-operative targets and the
actual reamed correction are reported and discussed.
Chapter 2
2
Development of a Force-based Reaming Vector
Measurement System
Overview: This chapter outlines the design and calibration of a
force-based reamer vector measurement system to be used with a
glenoid reaming surgical simulator. The scope of the chapter
includes the definition of relevant coordinate systems and desired
measurands, system design and instrumentation, and calibration.
General performance of the measurement system is also presented.
2.1
Anatomical and Simulator Coordinate System Definition
2.1.1
Defining a Glenoid Coordinate System and Desired
Measurands
A clinically relevant coordinate system was defined to determine the required
measurands for the force-based measurement system. The constructed coordinate system
is a glenoid centered system formed from three anatomical land marks; the glenoid center
(GC), the inferior scapular angle point (AI) and the trigonum spinae (TS) as shown in
Figure 2.1A. Collectively, these three points defined the scapular plane and an axis
through GC and TS defined the neutral inclination axis. The glenoid coordinate system is
depicted in Figure 2.1B showing an origin at the glenoid center and three orthogonal
axes. The coordinate system axes were defined by the scapular plane and the neutral
inclination axis. The SI axis was oriented parallel to the scapular plane and normal to the
neutral inclination axis in the superior – inferior direction. The AP axis was oriented
normal to the scapular plane in the anterior – posterior direction and the ML axis was
Figure 2.1: Glenoid-Centered Coordinate System Definition Glenoid Centre (GC)
Scapular Plane
Trigonum Spinae (TS)
Neutral Inclination Axis
Inferior Scapular Angle (AI)
SI Axis
ML Axis AP Axis A
B
An anatomical coordinate system was defined to determine clinically relevant
measurands [A] The glenoid center (GS), trigonum spinae (TS), and inferior scapular
angle (AI) were used to define the scapular plane, neutral inclination axis and the
glenoid-centered coordinate system. [B] Coordinate system origin is located at the
glenoid center and the three orthogonal axes (positive directions) were defined
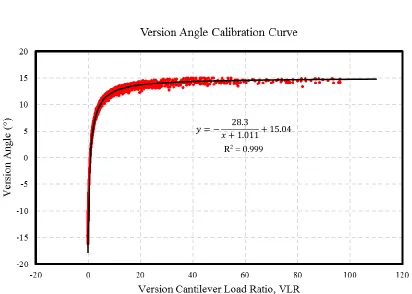
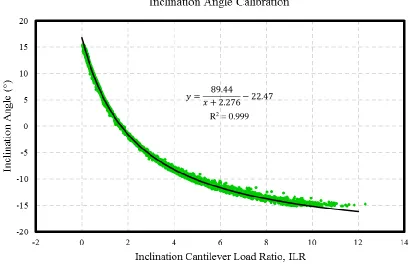
To expand the simulator’s capabilities and incorporate off-axis reaming, the simulator was calibrated to measure the user’s applied net force and the reamer’s angle of approach. To measure the reamer’s angle of approach in three-dimensional space, the
angle was separated into two angles on orthogonal planes; inclination angle of approach
and version angle of approach as shown in Figure 2.2. Version angle was defined as the
angle between the reamer shaft and the ML axis in transverse plane. Inclination angle
was defined as the angle between the reamer shaft and the ML axis in the coronal plane.
Figure 2.2: Angle of Approach Definition
A B
α β
The reamer angle of approach was divided into two orthogonal angles. [A] Version
angle (α) is the angle of approach contained within the transverse plane. Positive
direction is from the positive ML axis towards the positive AP axis. [B] Inclination
angle (β) is the angle contained in coronal plane. Positive direction is from the
2.1.2
Defining a Glenoid Reaming Simulator Coordinate System
A simulator coordinate system was defined to measure the reamer angle of approach and
net force magnitude relative to the simulator construct. The simulator coordinate system
orientation was defined by three orthogonal axes (SI axis, AP axis and ML axis) as
depicted in Figure 2.3. The SI axis was oriented in the vertical direction parallel to the
base plate. The AP axis was oriented in the horizontal direction parallel to the base plate
and the ML axis was oriented normal to the base plate. The coordinate system origin was
located so that the ML axis passed through the center of the base plate but was offset
from the base plate along the ML axis by 71.2mm. This offset corresponds with the
distance between the base plate and glenoid center of the shoulder model that was used
with the simulator. The simulator coordinate system was fixed to the base plate.
Figure 2.3: Simulator Coordinate System Definition 71.2 mm
Base Plate SI Axis
ML Axis
AP Axis
The anatomical coordinate system was defined within the context of the reaming
simulator hardware. This coordinate system was used as the frame of reference for the
2.2
System Design for Force Triangulation
2.2.1
System Hardware Design
Multiple designs were considered for the reamer vector measurement system; however, a
few design constraints limited possible design solutions. The first constraint was that the
developed system needed to continue to allow the user to interact with the simulator
using a fully functional surgical reamer. This constraint prevented modifications from
being made to the reamer. Secondly, the added system could not alter the vibrations felt
by the user during simulation. This constraint prevented the developed reamer vector
measurement system from being placed between the vibration transducer and the 3D
printed scapula mounted to the front of the simulator since this could alter the
transmission of vibrations to the user. Additionally, it was advantageous to place the
reamer vector measurement system outside of the vibration environment to reduce signal
noise caused by vibrations. Given these constraints, the force measurement system was
placed between the simulator housing and the support wall similar to the previous
uniaxial force measurement system (shown in Figure 2.4D).
To measure the desired measurands defined in section 2.1.1, multiple solutions composed
of a combination of multi-axis and single-axis load cells were considered. The simplest
potential system consisted of a single multi-axis load cell. However, due to the high
anticipated torsions, commercially available multi-axis load cells with the required
measurement range and resolution are expensive. Additionally, since the load applied by
the user to the simulator would not be applied at the origin of the multi-axis load cell,
calibration algorithms would need to be included to transform the forces to the simulator
coordinate system defined in section 2.1.2. The need for additional calibration algorithms
minimized the advantage of having a commercially calibrated device. Due to cost and the
minimized benefit of a commercial system, multiple single-axis load cells were chosen
over a single multi-axis load cell. To further reduce costs, single-axis cantilever load cells
were fabricated from stock materials and instrumented with strain gauges instead of
purchasing commercial load cells. The design of the cantilever load cells used has been
The developed force-based measurement system consisted of three aluminum cantilever
load cells mounted to the wall support of the simulator in a tripod configuration as shown
in Figure 2.4A. These three cantilevers replaced the uniaxial load cell previously used
with the simulator. The simulator housing was mounted to the cantilevers using rubber
standoffs so that the simulator housing was a cantilevered system only supported by the
three cantilever load cells (show in Figure 2.4C and Figure 2.4D). With this design, any
external load applied to the simulator caused a change in the reaction forces at each
cantilever and with the addition of rubber standoffs the vibrations produced by the
simulator were dampened so that there would be less vibration induced noise in the force
measurements. To measure the change in reaction force, a full Wheatstone bridge strain
gauge circuit (configuration type II) using two ‘T’ rosette strain gauges
(MICRO-MEASUREMENTS MMF315026) was instrumented onto each cantilever (shown in
Figure 2.4B). This bridge configuration allowed for isolated measurement of surface
bending strain resulting from a normal force applied perpendicular to the rubber standoff
while compensating for temperature and poison effects.
2.2.2
Force Data Acquisition System
All strain measured by the strain gauge circuits was supplied to a C series strain/bridge
input module (NI 9237, National instruments Corporation, Austin, Texas). The input
module was connected to the simulator computer through a USB chassis (NI USB-9162,
National instruments Corporation, Austin, Texas) shown in Figure 2.5. All Data was
Figure 2.4: Force-based Measurement System Design and Instrumentation A
B
C A
C
B
D Strain Gauge
Fbend
[A] Three aluminum cantilever load cells (A, B & C) were oriented in a tripod
configuration mounted to the simulator support wall. [B] Each cantilever was
instrumented with a full Wheatstone Bridge strain gauge circuit. A bending force,
Fbend, acts normal to the cantilever top face and caused bending strain that was measured by the strain gauges. An additional ‘T’ rosette strain gauge wass mounted
to the underside of the cantilever (not depicted in figure) [C] The simulator housing
was mounted onto the cantilevers. [D] The simulator housing and cantilever load
Figure 2.5: Data acquisition system
2.3
Cantilever Load Cell Calibration
A commercial six degree-of-freedom (6DOF) load cell (Nano25, ATI Technologies,
Markham, Ontario) was used to develop a calibration curve for each cantilever load cell.
This load cell was used because it was easily accessible; however, measurements were
only taken from a single axis to calibrate the cantilevers. This curve was used to convert
measured bending strain into normal force applied. Each cantilever was mounted to the Cantilevers (with
Wheatstone
bridge circuit)
ATI Nano25 Load
Cell
ATI Signal
Conditioner
NI USB-6210 Data
Acquisition Unit NI 9237 module and
NI USB-9162 chassis
Data Acquisition Unit
Simulator Computer
Three cantilever load cells were used to measure the simulator user’s applied force
and angle of approach. A commercial load cell was used to calibrate the system. All
transducers were sampled via NI-USB data acquisition units using NI LabVIEW
simulator wall support prior to calibration. The load cell was mounted onto one of the
cantilevers as shown in Figure 2.6. As shown in Figure 2.5, the load cell was connected
to an ATI signal conditioner and was routed to the simulator computer using an
USB-6210 data acquisition unit (National Instruments Corporation, Austin, Texas). A custom
NI LabVIEW program was used to simultaneously collect strain measurements from the
cantilever being calibrated and force measurements from the load cell. The loading
protocol for calibration involved applying a steadily increasing and decreasing
compressive load followed by an increasing and decreasing tensile load normal to the
face of the load cell.
Figure 2.6: Cantilever Load Cell Calibration Setup ATI Nano25 Load Cell
Fcalibrate
An ATI Nano25 load cell was mounted onto each cantilever to calibrate the cantilever
to convert measured bending strain into force applied normal to the cantilever. A
ramped compressive and tensile load (Fcalibrate) was applied to the load cell while
A plot was generated with bending strain as the independent variable and force applied as
the dependent variable. A first order regression was fit to the plotted points to generate
the calibration curve. The developed calibration curves are shown in Figure 2.7 through
Figure 2.9. The simulator was mounted onto the three cantilever load cells after they were
calibrated.
Figure 2.7: Cantilever A Calibration Curve
𝑦 = −0.4801𝑥 − 28.642
R2 = 0.998
Calibration data from the commercial load cell and the Wheatstone bridge of
cantilever A were plotted on a scatter plot. A line was fit to the points to develop the
calibration curve that would allow for the conversion from measured bending strain
Figure 2.8: Cantilever B Calibration Curve
𝑦 = −0.5369𝑥 − 10.412
R2 = 0.997
Calibration data from the commercial load cell and the Wheatstone bridge of
cantilever B were plotted on a scatter plot. A line was fit to the points to develop the
calibration curve that would allow for the conversion from measured bending strain
Figure 2.9: Cantilever C Calibration Curve
2.4
Force-based Measurement System Calibration
To calibrate the reamer vector measurement system, a custom mount was used to attach
the load cell to the simulator base plate that aligned the measurement axes of the load
cell with the simulator coordinate system defined in section 2.1.2 (shown in Figure
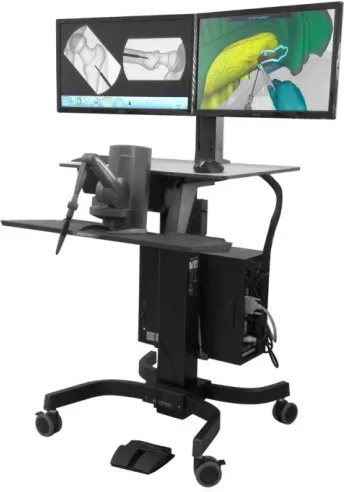
2.10A). To apply controlled loads to the load cell, a KUKA 7 axes light weight robot
(LWR) (KUKA Robotics Canada Limited, Mississauga, Ontario) was used with a
surgical reamer mounted to the effector end of the robot shown in Figure 2.11. A plate
with a pilot hole was mounted to the front of the load cell to serve as a guide for the
reamer tip (shown in Figure 2.10B). A data acquisition system as shown in Figure 2.5 Calibration data from the commercial load cell and the Wheatstone bridge of
cantilever C were plotted on a scatter plot. A line was fit to the points to develop the
calibration curve that would allow for the conversion from measured bending strain
into force applied.
𝑦 = −0.519𝑥 + 520.09
was used with a custom LabVIEW program to simultaneously measure load cell data and
cantilever data.
Figure 2.10: Commercial Load Cell Setup for Force-based Measurement System Calibration
A B
Custom
Mount Guiding Plate
[A] A custom mount was used to align the measurement axes of the load cell to the
simulator coordinate system axes. [B] A plate with a pilot hole was mounted to the