© 2019, IJCSMC All Rights Reserved
153
Available Online atwww.ijcsmc.comInternational Journal of Computer Science and Mobile Computing
A Monthly Journal of Computer Science and Information Technology
ISSN 2320–088X
IMPACT FACTOR: 6.199
IJCSMC, Vol. 8, Issue. 6, June 2019, pg.153 – 160
Superimposed Rule-Based
Classification Algorithm in IoT
Ivy Kim D. Machica
1; Bobby D. Gerardo
1,2; Ruji P. Medina
1¹Technological Institute of the Philippines, Philippines ²West Visayas State University, Philippines
1
[email protected]; 2 [email protected]; 3 [email protected]
Abstract— The application of the Internet of Things (IoT) in agriculture captures an enormous amount of data for decision making. However, hardest-to-detect abnormal data points that are transmitted can be harmful if not detected at an earlier stage. This paper presents an application of the Superimposed-Rule Based Classification Algorithm (SRBCA) using IoT in agriculture that lowers the false positive in anomaly detection by training one-class dataset of a ground-truth collection of agricultural sensor readings and evaluating using the combination of ground-truth and synthetic balanced test set. The CRoss-Industry Standard Process for Data Mining (CRISP-DM) methodology was used as a guide in the development of the study. The SRBCA was developed to detect conditional anomalous instances. The model was tested with one (1) year daily collection of environmental sensors. This algorithm considers the behavior and indicator features for anomaly detection. Moreover, a confusion matrix is presented showing the accuracy of the result of the SRBCA compared with One-Class Support Vector Machine (OCSVM) and its types which were considered as the closest prior art of the algorithm. The experimental results show that SRBCA performed better in identifying conditional anomaly over OCSVM and its varieties.
Keywords— anomaly detection, internet of things, one-class, CRISP-DM, sensors
I. INTRODUCTION
© 2019, IJCSMC All Rights Reserved
154
However, data collected from the wireless sensors might contain abnormal data points or anomalies. The erroneous readings or data corruption can be the effect of the harsh environmental conditions, cheap & prone to malfunction sensors and other factors. Anomaly detection reports unusual patterns or erroneous readings from sensors. Some analysts apply anomaly detection during the pre-processing stage to remove or transform anomalous data [4] before data modeling. Some authors consider anomaly detection as knowledge generators when anomalous data returned to the user is remarkable [5]. When an anomaly is detected, an alarm or report will require human to do an investigation or perform an action. However, if too many reports of false positive and false negative anomalies, the IoT and other resources might fall into disuse [6].
There are existing solutions for detecting anomalies. However, the algorithms depend on its processing on the characteristics of the database, learning type, type of anomaly, and its output generation. The closest prior art that uses one-class learning is the One-Class Support Vector Machine (OCSVM).
This paper seeks to expand the current knowledge in one-class learning using sensor data. The proposed algorithm, called the Superimposed Rule-Based Classification Algorithm (SRBCA) intends to reduce the false positive of conditional anomalous instances.
This paper is organized as follows. In Section 2, the review of related literature is presented. Section 3 shows the methodology and experimental results, and finally, Section 4 presents the conclusion of the study.
II. RELATED LITERATURE
A. Internet of Things
The IoT includes the use of an object or things with sensors attached to it that have abilities to record its value or its surroundings and communicate with other things to perform smart actions. Modern farmers use smart agriculture that helps them monitor the growth of the crop, soil information, and abundant insights that will increase yield [7]. The smart farm includes sensors such as temperature, wind, humidity, barometer, moisture, pH, to name a few.
B. Anomaly Detection
Anomaly detection involves steps in identifying remarkable instances that deviate significantly from the rest of the data [8][9][10]. There are three types of anomalies: point, collective, and contextual/conditional. The point anomaly detects a single instance. For example, a sensor can return extreme value due to a sudden surge of power supply or returns a missing value when its turned off [11].
The second type of anomaly is the collective anomaly, which is a group of instances that deviates from the rest of the data. In IoT, a group of sensors might feedback result resulting in zero, which is its default value caused by faulty sensors. It can also return null values altogether.
The contextual or conditional anomaly detection detect anomalous instances or sensor readings when the context is considered — for example, one (1) year temperature recordings in celsius range from 20 to 38. A value of 37 is normal, but when the reading is recorded anytime from June to November, in the Philippines, it would be considered an anomaly. The conditional anomaly detection minimizes false positive & false negative or Type I and Type II errors [12]. This method involves domain knowledge from the expert by identifying behavior and indicator features that have a direct effect in determining anomalous readings.
The application of anomaly includes airline routine operations using flight data recorder [13], microblogging [14], network anomaly [15][16], wireless sensor networks for healthcare [17], money laundering activities [18], and many more.
C. Anomaly Detection Setup
In anomaly detection, there are three types of setup. These are supervised, semi-supervised, and unsupervised learning [19]. The supervised method uses fully labeled training dataset for learning [20]. The dataset contains features and balanced classes that represent input and output, respectively [21]. The regression methods and some classification algorithms use supervised learning.
© 2019, IJCSMC All Rights Reserved
155
D. One-Class Support Vector Machine
The Support Vector Machine (SVM) is the predecessor of the OCSVM, which uses a one-class learning method. SVM maps training data and uses a hyperplane to separate normal data from anomalous data. In the one-class taxonomy of classification algorithms by Khan et al. (2014), the OCSVM is presented for algorithm-based research work. Several studies support the use of OCSVM in detecting anomalies. These include detecting anomalies in the windows registry system, network anomaly detection, patient classification [24], document classification [25], and many more. However, Wang et al. [26] describe OCSVM as very sensitive to the parameter settings and choice of kernels.
The R‘s package e1071 [27] provides statistical functions that include SVM. The formula of SVM includes setting the kernel type, gamma, cost, nu, and many more. The SVM type should be set to one-classification for novelty detection. The kernel types are the linear, polynomial, radial basis, and sigmoid. Thus, users must choose the kernel type and its parameters efore generating the model.
Moreover, processing of OCSVM requires that both training and testing datasets must have the same number of instances.
III.METHODOLOGY
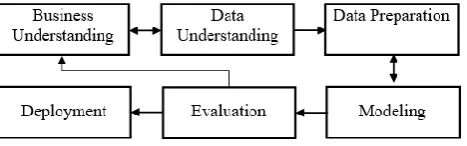
The Cross-Industry Standard Process for Data Mining (CRISP-DM) methodology will be used in this research. The six phases of CRISP-DM are business/research understanding phase, data understanding phase, the data preparation phase, modeling phase, evaluation phase, and deployment phase [28].
Fig. 1 CRISP-DM Methodology
A. Business Research Understanding Phase
The objective of IoT in agriculture is to monitor and increase the yield of the crops. The data obtained from the sensors placed on the field can provide substantial information for farmers to adjust strategies at any time. The stakeholders need to adopt innovative processes which include an algorithm that has higher accuracy in determining conditional anomalous data from the sensors. The algorithm will be embedded in the program after data collection from the sensors. The farmers and stakeholders will be benefitted in the IoT-based systems. The stakeholders will be able to gain knowledge and respond to anomalous data appropriately.
B. Data Understanding Phase
The dataset is assumed to be valued from the sensors in one parcel which contains crops. This dataset is one (1) year collection of ground-truth data in the Philippines [29]. The dataset includes 2,843 instances with eight (8) features of normal class. Thus, the characteristics of the database include numeric instances.
Classes ‗tbl_df‘, ‗tbl‘ and 'data.frame': 2843 obs. of 9 variables: $ ID : int 1 2 3 4 5 6 7 8 9 10 ...
$ Day: chr "Mon" "Mon" "Mon" "Mon" ... $ Date: Date, format: "2018-01-01" … $ Time: Time 'hms': 2:00 5:00 8:00 11:00 $ Temp: int 22 22 22 27 28 28 26 24 ... $ Wind_kph: int 2 0 2 3 5 3 2 0 0 2 ... $ Humidity: int 85 89 90 64 62 59... $ Barometer_mB: int 1011 1010 1012...
C. Data Preparation Phase
© 2019, IJCSMC All Rights Reserved
156
TABLE IDESCRIPTIVESTATISTICS
Stat Date Temp Humidity Wind Barometer
Min. 2018-01-01 20.00 35.00 0.00 995.00
1st Qu. 2018-03-31 26.00 64.00 2.00 1008.00
Median 2018-07-05 27.00 77.00 2.00 1010.00
Mean 2018-07-03 27.74 74.63 2.37 1010.00
3rd Qu. 2018-10-03 30.00 86.00 10.00 1012.00
Max. 2018-12-31 39.00 100.00 15.00 1032.00
StdDev. 2.84 1.38 2.70 2.77
TABLE II CORRELATION
Temp Wind Humidity Barometer Temp 1.00 0.29 -0.81 -0.14
Wind 0.29 1.00 -0.26 -0.14
Humidity -0.81 -0.26 1.00 -0.17
Barometer -0.14 -0.14 -0.17 1.00
D. Modelling Phase
Superimposed Rule-Based Classification Algorithm (SRBCA). The SRBCA generates a model by superimposing rules from the behavior and indicator attributes [30]. Its purpose is to identify conditional anomalous data and labels the class as normal or anomaly. The holdout method was used to assess the performance of the classifier [31][32]. The model will use two (2) datasets. The first dataset will be used for training, and a separate dataset will be used for testing and evaluating the accuracy of the model.
The learning type used is semi-supervised. The training set is 60% of the dataset, which contains normal values. It consists of behaviour and indicator attributes. The behaviour attributes are the two (2) seasons of the Philippines: the dry and rainy seasons. The dry season includes the months of December to May, and the rainy season will start from June to November [33]. The remaining 40% of the dataset is for testing the algorithms.
Pseudocode 1: Holdout Method for One-Class Learning
Input: Dataset One-class Multivariate
Partition D1 according to the number of behavioral datasets. Process:
Partition behavioral datasets to training (60%) and testing (40%).
Generate rules and pre-program threshold to form general rule from training subsets. Output: One-class training set
The dry subset contains 1,395 instances, and rain subset includes 1,448. The training and testing subsets for behavioural dry are 837 (60%) and 558 (40%), respectively. Also, the number of instances for training and testing the rainy behaviour are 869 (60%) and 579 (40%) respectively.
The algorithm of the SRBCA uses the number of behavioural features as the outer loop and indicator feature for the inner loop. The model which was derived from superimposing the rules of the indicator features is tested using conditional statements. The threshold can be used to add smoothing to the model.
Algorithm for SRBCA
testpredictors ← TestData
for (i = 0; i < N; i++) {// Behavioral features for (j = 0; j < N; j++) {// Indicator features
© 2019, IJCSMC All Rights Reserved
157
else
print (testpredictors$Class ="Normal") }}
TABLE III
SUPERIMPOSED RULES
Temperature Wind Humidity Barometer
A. Behaviour 1 - Dry Season (January-May and December 2018)
Minimum 20 0 35 1001
Maximum 38 11 100 1032
Threshold +0.1
B. Behaviour 2 - Rainy Season (June to November 2018)
Minimum 21 0 40 995
Maximum 35 13 100 1013
Threshold +0.1
E. Evaluation Phase
The evaluation phase will use ground-truth and synthetic data to produce a balanced dataset. A balance dataset consists of 50% normal and 50% anomalous dataset.
Pseudocode 2: Generation of Balanced Dataset
Input: Test set = 40% of the dataset (n=1137) Process:
Step 1. Normalize row instance of test data;
Step 2. Identify the number of instances for behaviors subsets (Dry=558 and Rainy= 579); Step 3. Divide the number of instances to two (2) for the normal and anomalous classes;
(Dry Normal and Anomaly = 279 and Rainy Normal and Anomaly = 289); Step 4. Randomize instance row for n behavior subsets;
Use the syntax: x <- sample (min: max, n, replace = F) // where min refers to minimum instance row and m for maximum instance row and an n random number with no duplicates;
Step 5. Partition random numbers according to the number of indicator features; Step 6. Inject anomaly by replacing normal values;
Use the syntax: z <- sample (min: max, n, replace=F) // where min refers to the minimum value for indicator feature and max for maximum value for indicator feature with no duplicate values.
Output: Balanced Dataset
The accuracy of the SRBCA model will be evaluated using the confusion matrix as shown in Tables 4 & 5 and other performance indicators as shown in Table 6. The confusion matrix, as shown in Table 4, records the true positive, true negative, false positive, and false negative. The false positive and false negative are considered as Type I and Type II errors, respectively. The instance will be recorded as true positive (TP) if the actual class is positive/normal, and the classifier detected it as positive/normal. The true negative (TN) is recorded when the actual instance‘s class is negative, or anomaly, and the classifier detected it as negative or anomaly. The Type I error or the false positive (FP) is recorded when the actual instance‘s class is negative, but the classifier detected it as positive. The Type II error or the false negative (FN) is recorded when the actual instance‘s class is positive, but the classifier identified it as negative.
TABLE IV CONFUSIONMATRIX
Positive (P) Negative (N)
True (T) True Positive (TP) False Positive (FP)
Type I Error
False (F) False Negative (FN)
Type II Error
True Negative (TN)
© 2019, IJCSMC All Rights Reserved
158
library(e1071)
trainpredictors<-TrainDataset1137[,1:10] svm.model<-svm(trainpredictors, y=NULL, type='one-classification',
nu=0.1, scale=TRUE, kernel="linear", gamma = 1.0, cost = 1.0) print (svm.model)
predictTest <- fitted (svm.model, newdata=TestingDataset1137) summary(predictTest)
F. Deployment Phase
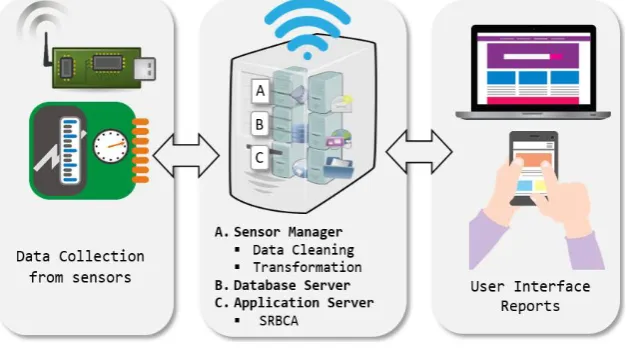
The architecture, as shown in Figure 2, can be used to deploy the algorithm into the IoT system. The collection of data will come from the sensors deployed in the field. Then, it sends data to the sensor manager for data cleaning and transformation that will be usable to the database and the algorithm. The database server will store all instances received from the sensor manager. The application server manages the application to be shared with other devices. The SRBCA model will be embedded in the application. Both the database and the application servers send & receive data or instructions from the user through the web or mobile application. The application can view reports or notifications if anomalous instances are detected.
Moreover, the model must be maintained for continuous improvement of the system. The user can update the threshold if there is a need to change due to environmental factors or to avoid overfitting.
Fig. 1 IoT Architecture with SRBCA
The sensors make up the physical layer of the architecture. These include agrometeorological sensors which captures data from its environment. The data from these sensors will be real-time collected by the middle layer of the architecture. The middle layer includes the sensor manager which is responsible for data cleaning and transformation. This process will ensure that data is correct and usable. The database server holds all cleaned data and source for the SRBCA. The SRBCA will classify normal and anomalous readings from the sensors. The result of the SRBCA will be displayed in the application layer. This layer includes the graphical user interface and reports that will provides farmers and other stakeholders with reasoned advice from the system.
IV.RESULTS
The accuracy is commonly used to measure the performance of the classification algorithms. It is defined as the ratio between correctly classified samples to the total number of samples [34]:
Accuracy = (TP + TN)/TP+TN+FP+FN
© 2019, IJCSMC All Rights Reserved
159
TABLE VCONFUSIONMATRIXOFSRBCAANDOCSVM
n = 1137 SRBCA
OCSVM
(nu=0.1, gamma and cost =1)
Radial Linear Polynomial
P N P N P N P N
Predicted Positive (P) 540 0 216 227 512 511 513 511
Predicted Negative (N) 28 569 352 342 56 58 56 57
TABLE VI
SRBCAANDOCSVMEVALUATION
Measure SRBCA OCSVM
(nu=0.1, gamma and cost =1) Radial Linear Polynomial
Sensitivity (Recall) 0.9507 0.3803 0.9014 0.9016
Specificity 1.0000 0.6011 0.1019 0.1004
Precision 1.0000 0.4876 0.5005 0.5010
Negative Predicted Value 0.9531 0.4928 0.5088 0.5044
False Positive Rate 0.0000 0.3989 0.8981 0.8996
False Discovery Rate 0.0000 0.5124 0.4995 0.4990
False Negative Rate 0.0493 0.6197 0.0986 0.0984
Accuracy 0.9754 0.4908 0.5013 0.5013
F1 Score 0.9747 0.4273 0.6436 0.6441
V. CONCLUSIONS
The algorithm uses one-class learning of normal data points for generating a classifier. The SRBCA classifier was trained using ground-truth sensor data and evaluated using a combination of ground-truth and synthetic balanced datasets. Moreover, the SRBCA was compared with OCSVM and its types. Based on the experimental results, the SRBCA was more accurate in detecting conditional anomalous instances. This classification system performs well with higher accuracy for one-class learning compared with OCSVM and its types. Both algorithms can process the same characteristics of the database, learning type, and output generation. Thus, the SRBCA can be used as a tool for helping farmers and managers to make the right decisions.
R
EFERENCES
[1] A. Alghuried, ―A Model for Anomalies Detection in Internet of Things (IoT) Using Inverse Weight Clustering and Decision Tree,‖ Ph.D. dissertation, School of Computing, Dublin Institute of Technology, 2017.
[2] J. Hwang, C. Shin, H. Yoe, J. Hwang, C. Shin, and H. Yoe, ―Study on an Agricultural Environment Monitoring Server System using Wireless Sensor Networks,‖ Sensors, vol. 10, no. 12, pp. 11189–11211, Dec. 2010.
[3] S. Wolfert, L. Ge, C. Verdouw, and M.-J. Bogaardt, ―Big Data in Smart Farming – A review,‖ Agric. Syst., vol. 153, pp. 69–80, May 2017. [4] C. Hong and M. Hauskrecht, ―MCODE: Multivariate Conditional Outlier Detection,‖ arXiv:1505.04097v1 [cs.AI], May 2015, in press.
[5] S. S. Khan and M. G. Madden, ―One-class classification: taxonomy of study and review of techniques,‖ Knowl. Eng. Rev., vol. 29, no. 03, pp. 345– 374, Jun. 2014.
[6] X. Song, M. Wu, C. Jermaine, and S. Ranka, ―Conditional Anomaly Detection,‖ IEEE Trans. Knowl. DATA Eng. VOL. 19, NO. 5, MAY 2007, vol. 19, no. 5, pp. 631–645, 2007.
[7] P. P. Jayaraman, A. Yavari, D. Georgakopoulos, A. Morshed, and A. Zaslavsky, ―Internet of Things Platform for Smart Farming: Experiences and Lessons Learnt.,‖ Sensors (Basel)., vol. 16, no. 11, Nov. 2016.
[8] K. A. Heller, K. M. Svore, A. D. Keromytis, and S. J. Stolfo, ―One Class Support Vector Machines for Detecting Anomalous Windows Registry Accesses,‖ Research Gate, December 2003, in press.
[9] M. Goldstein and S. Uchida, ―A comparative evaluation of unsupervised anomaly detection algorithms for multivariate data,‖ PLoS One, 2016. [10] S. Thiprungsri and M. Vasarhelyi, ―Cluster Analysis for Anomaly Detection in Accounting Data: An Audit Approach,‖ The International Journal of
Digital Accounting Research, vol. 11, pp. 69-84, July 2011.
[11] P. Oluwasanya, ―Anomaly Detection in Wireless Sensor Networks,‖ Thesis, Signal and Processing Communications, University of Edinburgh, 2017. [12] A. Tharwat, ―Classification assessment methods,‖ Appl. Comput. Informatics, Aug. 2018.
© 2019, IJCSMC All Rights Reserved
160
Astronautics, Massachusetts Institute of Technology, 2013.[14] W. Yang et al., ―Anomaly Detection in Microblogging via Co-Clustering,‖ J. Comput. Sci. Technol., vol. 30, no. 5, pp. 1097–1108, Sep. 2015. [15] B. Zhang et al., ―Diagnosing Traffic Anomalies Using a Two-Phase Model,‖ J. Comput. Sci. Technol., vol. 27, no. 2, pp. 313–327, Mar. 2012. [16] R. Zhang, S. Zhang, Y. Lan, and J. Jiang, ―Network Anomaly Detection Using One Class Support Vector Machine,‖ Proc. Internati onal
MultiConference of Engineers and Computer Scientists, March 2008.
[17] S. A. Haque, M. Rahman, and S. M. Aziz, ―Sensor anomaly detection in wireless sensor networks for healthcare.,‖ Sensors (Basel)., vol. 15, no. 4, pp. 8764–86, Apr. 2015.
[18] K. S. and S. K., ―Autoregressive-based outlier algorithm to detect money laundering activities,‖ J. Money Laund. Control, 2017. [19] D. T. Larose and C. D. Larose, Data mining and predictive analytics, Wiley 2015.
[20] X. Zhu and A. Goldberg, Introduction to Semi-supervised Learning, Morgan and Claypool Publisher series, 2009. [21] C. Aggarwal and C. Zhai, Mining Text Data, Springer Science & Business Media, 2012.
[22] G. Zhong and K. Huang, Semi-supervised learning : background, applications and future directions, Nova Publishers, 2018.
[23] E. Eskin, A. Arnold, M. Prerau, L. Portnoy, and S. Stolfo, ―A Geometric Framework for Unsupervised Anomaly Detection,‖ Springer, Boston, MA, 2002, pp. 77–101.
[24] J. Mourão-Miranda et al., ―Patient classification as an outlier detection problem: An application of the One-Class Support Vector Machine,‖ Neuroimage, vol. 58, no. 3, pp. 793–804, Oct. 2011.
[25] L. M. Manevitz, M. Yousef, N. Cristianini, J. Shawe-Taylor, and B. Williamson, ―One-Class SVMs for Document Classification,‖ Journal of Machine Learning Research 2, pp. 139-154, 2001.
[26] J. Wang, Q. Kuang, and • Shihui Duan, ―A new online anomaly learning and detection for large-scale service of Internet of Thing,‖ Pers. Ubiquitous Comput., vol. 19, pp. 1021-1031, 2015.
[27] D. Meyer, E. Dimitriadou, K. Hornik, A. Weingessel, F. Leisch, C. Chang, and C. Lin, ―Package ‗e1071‘‖ Misc Functions of the Department of Statistics,‖ in press, 2019.
[28] R. Wirth and J. Hipp, ―CRISP-DM: Towards a Standard Process Model for Data Mining,‖ Proc. Fourth International Conference on the Practical Application of Knowledge Discovery and Data Mining, 2000, pp. 29-39.
[29] World Meterological Association, ―Weather in December 2018 in Manila, Philippines.‖ https://www.timeanddate.com/weather/philippines/manila/historic?month=12&year=2018. February 15, 2019.
[30] I. K. D. Machica, B. D. Gerardo, and R. S. Medina, ―Superimposed Rule-Based Classification Algorithm ( SRBCA ) unpublished.
[31] Q. A. Al-Radaideh, E. M. Al-Shawakfa, and M. I. Al-Najjar, ―Mining Student Data Using Decision Trees,‖ 2006 Int. Arab Conf. Informati Technol., no. January 2006, pp. 1–5, 2006.
[32] H. Li and J. Sun, ―Hybridizing principles of the Electre method with case-based reasoning for data mining: Electre-CBR-I and Electre-CBR-II,‖ Eur. J. Oper. Res., vol. 197, no. 1, pp. 214–224, Aug. 2009.
[33] gov.ph, ―PAGASA - Climate of the Philippines.‖ http://bagong.pagasa.dost.gov.ph/information/climate-philippines, February 15, 2019.