322
A NEW METHOD TO REMOVE DEPENDENCE
OF FUZZY C-MEANS CLUSTERING
TECHNIQUE ON RANDOM INITIALIZATION
Samarjit Das
1, Hemanta K. Baruah
21
Department of Computer Science &IT, 2Vice-Chancellor
1
Cotton College, Assam, India
2
Bodoland University, Assam, India
1
[email protected], [email protected]
ABSTARCT:
Fuzzy clustering techniques deal the situations where there is a possibility of belonging a single object to more than one cluster. Although Fuzzy C-Means clustering technique of Bezdek is widely studied and applied, its performance is highly dependent on the randomly initialized membership values of the objects used for choosing the initial centroids. This paper proposes a modified method to remove the effect of random initialization from Fuzzy C-Means clustering technique and to improve the overall performance of it. In our proposed method we have used the algorithm of Yuan et al to determine the initial centroids. These initial centroids are then used in the conventional Fuzzy C- Means clustering technique of Bezdek to obtain the final clusters. We have tried to compare the performance of our proposed method with that of conventional Fuzzy C-means clustering technique of Bezdek by using Partition Coefficient and Clustering Entropy as validity indices.
Keywords: Fuzzy C-Means clustering technique, Random initialization, Partition Coefficient, Clustering
Entropy.
1. INTRODUCTION
323
found to be consistent. In our proposed work we use these centroids thus obtained as the initial centroids in FCM of Bezdek (1981) to remove the effect of random initialization from FCM and also to improve the overall performance of it. Using Partition Coefficient (PC) and Clustering Entropy (CE) as validity indices (see Bezdek (1981) and Bensaid et al.(1996)) we have tried to make a comparison of the performances of these two clustering techniques.
In section-2 we provide the steps of the algorithms used in our present work. Through section-3 we describe our proposed model. The results and analysis of our present work have been placed in section-4. Finally we put the conclusion in section-5.
2. ALGORITHMS
The basic task of a clustering technique is to divide n patterns, where n is a natural number , represented by vectors in a p-dimensional Euclidean space, into c, 2≤ c <n , categorically homogeneous subsets which are
called clusters. Let the data set be X= {x1, x2, ……….., xn }, where xk ={ xk1, xk2, ……….., xkp }, k= 1,2,3,……..,n. Each xk is called a feature vector and xkj where j=1,2,…..p is the jth feature of the kth feature
vector. A partition of the dataset X into clusters is described by the membership functions of the elements of the
cluster. Let S1, S2,…….,Sc denote the clusters with corresponding membership functions
1 S
µ
,2 S
µ
, …,c S
µ
. A c x n matrix containing the membership values of the objects in the clustersŨ =
[
µ
Si(
x
k)]
i=1,2,...,c,k=1,2,...,n is a fuzzy c- partition if it satisfies the following conditions∑
=
=
ci
k si
x
1
1
)
(
µ
for each k= 1,2,….,n. (1)∑
=
≤
≤
nk
k si
x
n
1
)
(
0
µ
for each i= 1,2,….,c. (2)Condition (1) says that each feature vector xk has its total membership value 1 divided among all clusters. Condition (2) states that the sum of membership degrees of feature vectors in a given cluster does not exceed the total number of feature vectors. In our proposed model we have used the algorithm of Yuan et al. (2004) as a preprocessor to the FCM algorithm of Bezdek (1981). In sections 2.1 and 2.2 we provide the steps of FCM algorithm of Bezdek (1981) and the algorithm of Yuan et al. (2004) respectively.
2.1.FCM Algorithm of Bezdek
Step 1: Choose the number of clusters, c, 2≤c<n, where n is the total number of feature vectors. Choose m, 1≤ m <α. Define the vector norm || ||(generally defined by the Euclidean distance) i.e.
||
||
x
k−
v
i =∑
=−
pj
ij kj
v
x
1
2
)
(
(3)where
x
kjis the jth feature of the kth feature vector, for k=1,2,……,n; j=1,2,….,p andv
ij, j-dimensional324
Choose the initial fuzzy partition (by putting some random values)
n k c i k
si
x
≤≤ ≤ ≤=
1 ,1) 0 ( (0)
)]
(
[
U
µ
Choose a parameter ∈>0 (this will tell us when to stop the iteration). Set the iteration counting parameter
l
equal to 0.
Step 2: Calculate the fuzzy cluster centers
{
v
i(l)}
i=1,2,...,c given by the following formula∑
∑
= ==
n k m k l s n k k m k l s l ix
x
x
v
i i 1 ) ( 1 ) ( ) ())
(
(
))
(
(
µ
µ
(4)for i = 1, 2 , ….. c; k= 1, 2, , …..n.
Step 3: Calculate the new partition matrix (i.e. membership matrix)
n k c i k l s l
x
U
i ≤≤ ≤ ≤ + +
=
1 , 1 ) 1 ( ) 1 ()]
(
[
µ
,where
∑
= − +−
−
=
c j m l j k l i k k l sv
x
v
x
x
i 1 1 2 ) ( ) ( ) 1 ()
||
||
||
||
(
1
)
(
µ
(5)for i=1,2,……..,c and k=1,2,……..,n.
If
x
k=
v
i(l),
formula (5) cannot be used. In this case the membership function isi ifk c i i ifk k l si
x
= = ≠
+
=
1,...., 2 , 1 , 0 ) 1 (
{
)
(
µ
Step 4: Calculate ∆ =
||
U
(l+1)−
U
(l)||
(6)If ∆>∈, repeat steps 2, 3 and 4. Otherwise, stop at some iteration count
l
*.2.2. Algorithm of Yuan et al.
325
Step 2: Compute the distance between each data point and all other data points in the set X;
Step 3:Find the closet pair of data points from the set X and form a data point set Am (1≤m≤c, c is the number of clusters) which contains these two data points, delete these two data points from the set X;
Step 4: Find the data point in X that is the closet to the data point set Am, add it to Am and delete it from X; Step 5: Repeat step 4 until the number of data points in Am reaches 0.75*(n/c); (where .75 is a multiplication factor (MF))
Step 6: If m<c, then m = m+1, find another pair of data points from X between which the distance is shortest, form another data point set Am and delete them from X, go to step 4;
Step 7: For each data point set Am (1≤m≤c) find the arithmetic mean of the vectors of data points in Am, these means will be the initial centroids.
3. OUR PRESENT WORK
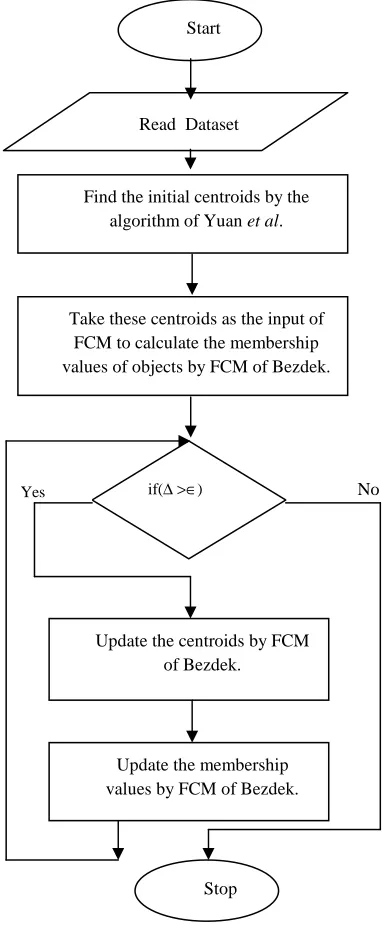
As the initial centroids in FCM of Bezdek (1981) are obtained based on the randomly initialized membership values of the objects, therefore the final clusters thus obtained are also not fixed. In other words there is significant variation in the performance of FCM clustering technique while executed different times. In the algorithm of Yuan et al. (2004) a systematic method is used to find the initial centroids where there is no random initialization. In our proposed model we use these initial centroids thus obtained as inputs of FCM of Bezdek (1981). In this way we have tried to remove the effect of random initialization from FCM clustering technique and also to improve its overall performance. We explain our proposed model with a flowchart (see Fig.1). We have applied both FCM clustering technique and our method ten (10) times each on the same dataset (see Table1) and tried to make a comparison of the performances of these two clustering techniques. We have used two validity measures of Bezdek (1981) and Bensaid et al. (1996) and the number of iterations to obtain the performances of these two clustering techniques. The mathematical formulae of these two validity measures have been given in the following.
(a) Partition Coefficient (PC): measures the overlapping between clusters.
∑∑
= =
=
ci n
j ij
n
c
PC
1
2
1
)
(
1
)
(
µ
(b) Clustering Entropy (CE): measures the fuzziness of the cluster partition
)
log(
1
)
(
1 1
∑∑
= =
=
ci
ij n
j ij
n
c
326
The proposed model of our present work has been given in the following.
[image:5.595.217.408.158.625.2]
Figure 1. Flowchart of our proposed model.
The dataset of our present work consists of fifty(50) Feature Vectors (FV) each of which is of dimension three(03) namely Intelligent Quotient (IQ) , Achievement Motivation(AM) and Social Adjustment (SA). The numerical values of our dataset have been given in the following table.
Find the initial centroids by the algorithm of Yuan et al.
Read Dataset Start
Take these centroids as the input of FCM to calculate the membership values of objects by FCM of Bezdek.
if(∆>∈)
Update the membership values by FCM of Bezdek. Update the centroids by FCM
of Bezdek.
Stop
327
Table 1. Data set of individual differences of fifty (50) feature vectors with dimension (feature) three (03).
FV IQ AM SA FV IQ AM SA
1 91 18 55 26 110 18 55
2 85 16 40 27 100 16 40
3 120 19 74 28 100 18 75
4 90 18 75 29 70 14 30
5 92 17 74 30 105 17 55
6 82 17 55 31 79 14 35
7 95 19 75 32 80 15 34
8 89 18 74 33 125 20 75
9 96 19 75 34 100 19 75
10 90 17 55 35 125 19 85
11 97 16 54 36 80 18 60
12 125 21 74 37 85 18 70
13 100 19 75 38 145 25 90
14 90 17 54 39 80 18 74
15 100 18 84 40 92 17 55
16 95 19 75 41 120 18 70
17 130 23 85 42 145 30 80
18 130 19 75 43 95 18 50
19 90 17 55 44 80 16 36
20 91 17 56 45 90 17 55
21 140 22 82 46 115 23 84
22 92 18 75 47 100 18 80
23 101 18 55 48 80 14 35
24 85 16 54 49 105 19 75
25 97 19 54 50 120 21 74
4. RESULTS AND ANALYSIS
328
Figure 2. Performance levels of our proposed model with different values of MF.
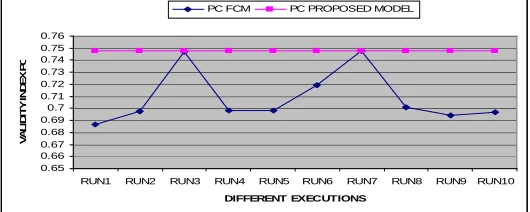
[image:7.595.172.437.367.473.2]In Fig. 3 we see that the value of the validity index PC of FCM varies significantly in ten (10) different executions. It is also seen in Fig. 3 that with the best choice of MF (when MF=.65) our proposed model results consistent and better performance (i.e. with higher values of PC) than FCM. A similar result is reflected in Fig.4 with the validity index CE. That is, our proposed model shows consistent and better performance (i.e. lower values of CE) in contrast to inconsistent performance of FCM in ten(10) different executions.
Figure 3. Measures of the validity index PC of FCM and that (optimized value only) of our proposed model in ten (10) different executions.
Figure 4. Measures of the validity index CE of FCM and that (optimized value only) of our proposed model in ten (10) different executions.
Fig. 5 shows that the average value of the validity index PC (for different values of MF) of our proposed model is more than that of FCM. This means that our model performs better than FCM even though the best
0 0.1 0.2 0.3 0.4 0.5 0.6 0.7 0.8 MF =.1 5 MF =.2 5 MF =.3 5 MF =.4 5 MF =.5 5 MF =.6 5 MF =.7 5 MF =.8 5 MF =.9 5 MF =1.0 AV G.
M ULTIFICATION FACTOR(M F)
V A L ID IT Y I N D IC E S PC CE 0.65 0.66 0.67 0.68 0.69 0.7 0.71 0.72 0.73 0.74 0.75 0.76
RUN1 RUN2 RUN3 RUN4 RUN5 RUN6 RUN7 RUN8 RUN9 RUN10
DIFFERENT EXECUTIONS V A L ID IT Y I N D E X P C
PC FCM PC PROPOSED MODEL
0 0.1 0.2 0.3 0.4 0.5 0.6 0.7
RUN1 RUN2 RUN3 RUN4 RUN5 RUN6 RUN7 RUN8 RUN9 RUN10 AVG.
DIFFERENT EXECUTIONS V A L ID IT Y I N D E X C E
[image:7.595.169.440.510.615.2]329
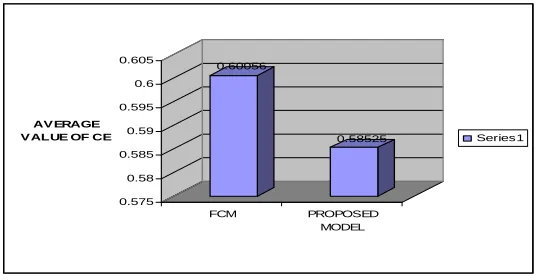
[image:8.595.172.437.191.337.2]choice of MF in our proposed model is not taken. In Fig. 6 we see that the average performance of our proposed model is better ( i.e. the value of CE is less) than that of FCM.
Figure 5. Average value of the validity index PC of FCM and that (for different values of MF) of our proposed model in ten (10) different executions.
Figure 6. Average value of the validity index CE of FCM and that (for different values of MF) of our proposed model in ten (10) different executions.
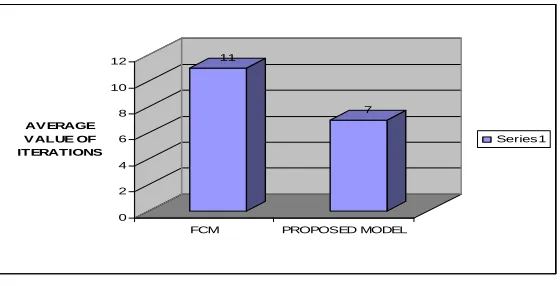
In Fig. 7 we see that the average number of iterations (for different values of MF) of our proposed model is less than that of FCM in ten(10) different executions.
0.7088
0.71731
0.704 0.706 0.708 0.71 0.712 0.714 0.716 0.718
AV ERAGE VALUE OF PC
FCM PROPOSED
MODEL
Series1
0.60056
0.58525
0.575 0.58 0.585 0.59 0.595 0.6 0.605
AV ERAGE V ALUE OF CE
FCM PROPOSED
MODEL
[image:8.595.170.438.399.539.2]330
Figure 7. Average number of iterations of FCM and that (for different values of MF) of our proposed model in ten (10) different executions.
Thus we see in the results that with respect to the two validity indices (i.e. PC and CE) and the number of iterations our proposed model has a consistent and better performance.
5. CONCLUSIONS
Although FCM clustering technique is very popular among the research community, the major disadvantage of it is that its performance is very inconsistent due to the randomly initialized membership values of the feature vectors for selecting the initial centroids. Our proposed model which uses the algorithm of Yuan et al. as a preprocessor of FCM of Bezdek, can remove this inconsistency of FCM due to randomness by giving consistent and better performance. Although the average performance level of our proposed model is higher than that of FCM, it is advisable to optimize the performance level of our model with the best choice of the multiplication factor.
References
[1] Baruah, H.K.( 2011a): Towards forming a field of fuzzy sets. International Journal of Energy, Information and Communications, 2(1), pp. 16-20.
[2] Baruah, H.K.(2011b): The theory of fuzzy sets: beliefs and realities. International Journal of Energy, Information and Communications, 2( 2),pp. 1-22.
[3] Bensaid, A.M.; Hall, L.O.; Bezdek, J.C.(1996): Validity- guided (re) clustering with applications to image segmentation. IEEE Trans. on Fuzzy Object, 2(2), pp.112-123.
[4] Bezdek, J.C.(1981). Pattern recognition with fuzzy objective function algorithms, Plenum Press, New York.
[5] Das, S.; Baruah, H. K.(2013a): Application of Fuzzy C-Means Clustering Technique in Vehicular Pollution. Journal of Process Management – New Technologies,1( 3), pp.96-107.
[6] Das, S.; Baruah, H. K.(2013b): A comparison of two fuzzy clustering techniques . Journal of Process Management – New Technologies,1( 4), pp.1-15.
[7] Derrig, R. A.; Ostaszewski, K. M.(1995): Fuzzy techniques of pattern recognition in risk and claim classification. Journal of Risk and Insurance, 62(3), pp.447-482.
[8] Gustafson, D.E.; Kessel ,W.C. (1979):Fuzzy clustering with a fuzzy covariance matrix, Proc. IEEE CDC, San Diego, CA, USA, pp.761–766.
[9] Yuan, F. ; Meng, Z.H.; Zhang, H.X.; Dong, C.R.(2004): A new algorithm to get the initial centroids, Proc. of the 3rd International Conference on Machine Learning and Cybernetics, pp. 26-29.
[10] Zadeh, L. A.( 1965): Fuzzy sets. Information and Control, 8(3), pp. 338-353.
11
7
0 2 4 6 8 10 12