343
Geo-tagging of Tweet Based Image Retrieval using
Spectral Clustering Algorithm
M. Vadivukarassi1, N. Puviarasan2 and P. Aruna 3
Department of Computer Science and Engineering1, 3 Department of Computer and Information Sciences 2
Annamalai University TamilNadu, India
Email: [email protected], [email protected], [email protected]
1
Corresponding author
Abstract- Social media provide a platform for users to express their opinions and sharing information. This paper proposed a framework of geo-tagging of tweet based image retrieval based on spectral clustering techniques to improve the performance of the image retrieval system . The real time dataset is downloaded from Twitter Streaming API using Python script at particular place. From these dataset, the tweets and images are extracted and stored in the separate database. The tweets are analyzed using Multinomial Naïve Bayes algorithm for tweet categorization. Here these tweets are categorized into different category and the top most categories are detected for further process. The toppest category tweets are filtered separately and the toppest keyword is detected from these filtered tweets. Based on the keyword detection, the images are retrieved using the proposed feature extraction method and spectral clustering algorithms. These algorithms are analyzed based on the performance measures such as precision, recall and accuracy. Finally the geo-tagging of detected keyword related tweets and retrieved images are visualized in the Google map respectively. This proposed work enables to categorize the tweets and retrieve the images quickly.
Index Terms- geo-tagging; histogram; micro blogging; SIFT; Spectral; Twitter; clustering; social media.
1. INTRODUCTION
Using micro-blogging services, the users post messages about their daily life and initiate discussions on different topics by sharing their personal opinions and emotions. These accumulated huge amounts of available behavioural data in online social networks give a chance for knowledge discovery. Social data mining techniques detect implicit or hidden information available within social networking sites. Twitter provides micro-blog services and also it is an online social media website and possible for the social analysts to understand the public attitude regarding different social issues. Finding the present topmost discussing issues regionwise in the social website, is the need of the day. But it is difficult to search them with better accuracy. Hence, this research paper proposed a new method for tweet categorization and image retrieval using proposed feature extraction method and clustering algorithms. Clustering algorithms can offer superior organization of multidimensional data for effective retrieval and allow a nearest neighbor search to be efficiently performed. Hence, the tweet based image mining is rapidly gaining more attention among the researchers. This paper is made further as: Section 2 discusses related work examined till now. Section 3
describes overall system design. Section 4 presents result and analysis of the work using the graphical analysis. Section 5 closes with the conclusions and presents future work.
2. RELATED WORKS
344 approach of feature extraction technique which is
based on combination of SIFT descriptor, color histogram and texture features. The extracted features are then clustered applying different clustering algorithms and the clusters are used to retrieve relevant images to the query image. Vadivukarassi et. al (2017) presented an efficient analysis of SIFT features and color histogram features with spectral clustering algorithm.
3. PROPOSED SYSTEM
This paper proposes a new system for the fast retrieval of efficient images from the database based on the keyword detected from the Twitter dataset. This proposed system uses the real time microblog image search. Fig 1 shows the block diagram of the proposed system.
Fig. 1. Block diagram of the proposed system
In the figure 1, tweets of different users are collected manually based on the different keywords available in a particular period of time at particular place using Twitter streaming API. Twitter dataset and the relevant images are manually collected and stored in the database. Each tweet contains the URLs of the images whereas the images are not available. The URLs are separated from the image storage Twitter websites. Once the tweets are stored in the database, they are preprocessed before applying into tweet categorization. The Multinomial Naive Bayes
classifier, a probabilistic learning method is used for tweet categorization. It is the grouping of tweets into a fixed number of predefined classes. A variation of NB is known as Naive Bayes Multinomial (NBM), considers the frequency of words and can be denoted as:
( ) ( ) ∏ ( ) (1)
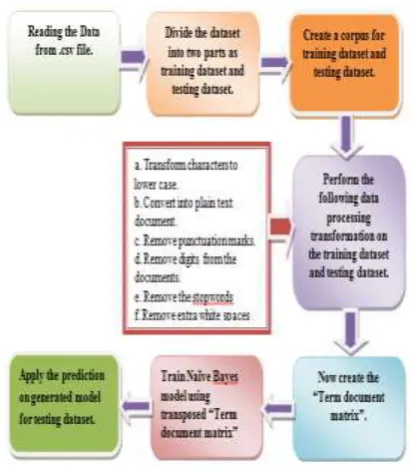
where ( ) is the probability of a document d being in class c, ( ) is the prior probability of a document occurring in class c, and ( ) is the conditional probability of term tk occurring in a document of class c. A document d in our case is trend definition or tweets related to each trending topic. Tweet vectors are constructed, and commonly used term frequency-inverse document frequency weights are assigned and Multimanial Naive Bayes (NB) classifier is used to classify the tweets. The input tweets are preprocessed and term-document matrix is applied to produce unigram and bigram features from the tweets and Multinomial Naive Bayes classifier model is built to classify the label such as Computers & Internet, Entertainment & Recreation, Health & Medicine etc. The Process flow for the tweet categorization algorithm is shown in the Fig 2 respectively.
Fig. 2. Process Flow of the tweet categorization
Then the topmost category of the tweets is detected. The detected category tweets are filtered separately and by using preprocessing and term frequency–inverse document frequency (tf-idf) method which is a numeric measure that is used to achieve the importance of a word in a tweet and the relevant keywords are detected to identify frequently
Twitter Collection of tweets
and images
Tweet Categorization
Image Retrieval Keyword Detection Multinomial Naïve
BayesClassifier
Proposed Histogram SIFTwith Spectral
Clustering Algorithm TF-IDF Feature
Extraction
345 repeated keywords in the tweets. The math formula for
this measure:
( ) ( ) ( ) ( )
where t denotes the terms; d denotes each text; D
denotes the collection of text. Then images related to detected keywords are retrieved from the image database using proposed feature extraction method with spectral clustering algorithms. The performance of clustering algorithms is compared using precision, recall and accuracy measures. Finally the Geo-tagging of detected keyword related tweets and retrieved images are visualized in the Google map respectively.
3.1 Proposed Histogram + SIFT
The combination of SIFT and color histograms are the feature extraction methods used to extract the salient features of the images. Color histogram is a representation of the number of pixels of every color present in the downloaded image. While separating the color pixels, if any of the color space is huge, then it is broken down into smaller intervals are called as bins. In our experiments, the number of bins considered is 2. This process is called color quantization. The final step is to obtain the color histogram using bin values. The Scale-invariant feature transform (SIFT) is an algorithm to detect and describe local features in images in computer vision. SIFT uses a much larger number of features from the images, which reduces the contribution of errors caused by these local variations in the average error of all feature matching errors. The steps of the proposed work are as follows:
Step 1: SIFT octaves are generated by constructing a scale space using,
( ) ( ) ( ) (3)
( )
( ) (4)
Step 2: From Gaussian values, difference of Gaussians which are equivalent to laplacian of Gaussians and it can be calculated using the formula,
( ) ( ) ( ) (5)
Step 3: Then, key points of objects are first extracted with Taylor expansion from a set of reference images and stored in a database.
A final image is recognized individually by comparing each feature from the new image to this database and finding candidate matching features based on Euclidean distance of their feature vectors. From the full set of matches, subsets of key points that agree on the object and its location, scale and
orientation in the new image are identified to filter out good matches. several thousands. This algorithm treats the image clustering as a graph partitioning difficulty without making any assumption on the form of the image clusters. So, spectral-graph structure of an affinity matrix is used to partition data into disjoint meaningful groups. It requires robust and appropriate affinity graphs as input in order to form clusters with desired structures. The construction such affinity graphs is an on trivial task due to the ambiguity and uncertainty inherent in the raw data. Most existing spectral clustering methods typically adopt Gaussian kernel as the similarity measure, and employ all available features to construct affinity matrices with the Euclidean distance, which is often not an accurate representation of the underlying data structures, especially when the number of features is large.
Algorithm 1: Spectral clustering Algorithm
Step 6: These form the columns of the new matrix X. Step 7: Form the matrix Y, Renormalize each of X’s
rows to have unit length, (∑ ) ; .Treat each row of Y as a point in
Step 8: Cluster into k clusters via K-means
Step 9: Final Cluster Assign point to cluster j if row i of Y was assigned to cluster j.
346 Eigenvectors are mapped respectively. In the third
step, the points to two or more classes, based on the new representation are assigned. Data matrixes from feature extraction are given as input to cluster the images using spectral clustering algorithm. By using, this output the images are retrieved similar to the query image of the detected keyword from the tweets.
3.3 Performance measures
Performance is measured with three factors: Precision, Recall and Accuracy. Precision is ratio of the number of relevant image retrieved and total number of image retrieved. Precision is denoted by P.
( )
Second factor, recall is ratio of number of relevant image retrieved and total number of image retrieved.
( )
Third factor, Accuracy is a weighted arithmetic mean of precision and its inverse as well as a weighted arithmetic mean of recall and its inverse.
( ) ( )
4. RESULTS AND DISCUSSION
In this work, tweets and url are downloaded from Twitter related to the place Chennai, Tamilnadu, India in the month of December 2016. In this dataset, 1000 tweets are collected in excel format and the tweet URL are downloaded in the image database separately. The number of images downloaded is 100. All these tweets are preprocessed and categorized into separate label. The top categorized tweets are filtered and top 10 keywords are detected. Using this model, each tweet is classified into different categories such as Computers & Internet, Health & Medicine, Entertainment & Recreation etc. Finally, Health & Medicine category has the highest number of topics followed by other category.
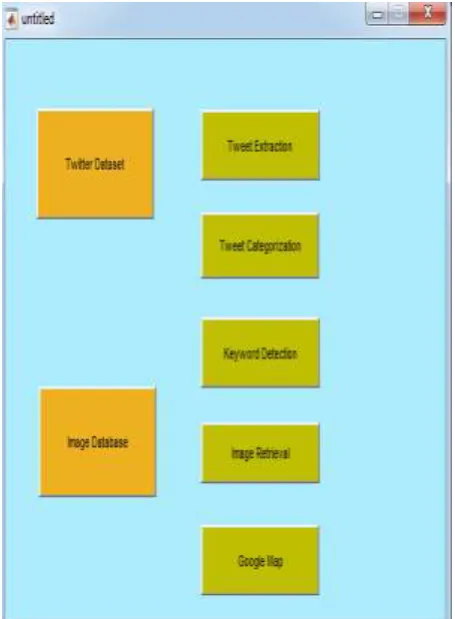
The category of health and medicine related tweets are filtered separately and those tweets are used for keyword detection. The collected tweets are read from a plain text document and displays the most frequently used words in the tweets. Fig 3 represents the GUI representation of the proposed work.
Fig 3. GUI representation of the proposed work
Table 1:Some categorization of Tweets
Tweets Label
RT @rahulroushan: True. Jallikattu protesters have killed and driven out non-Tamils, they are waving LTTE flags, and
many Chennai policemen… Entertainment
Olympic figure skater Scott Hamilton diagnosed with third brain tumor
Health RT @ABHcosmetics: ??
Strawberry ?? Liquid Lipstick ??@glamours_by_nat
Beauty #Trees have fell down and city
look bad! Because of the vardha cyclone
Disaster Your as sweet as strawberry
wine, your as warm as a glass of brandy and honey I stay stoned on your love all the time.
Food & Drink RT @mindfulive: Buddha
Teachings: 11 Lessons That Will Help You Win At Life
347 Table 1 represents the tweet categorization method
using Multinomial Naïve Bayes classifier. This shows that each tweets in the database contains which category and that tweets are collected saperately to find the topmost keyword in the database. From our expriment, the disaster is the label which is frequently repeated and that disaster tweets are filtered separately for keyword detection.
Table 2 indicates the summary of the keyword detection. Here, Vardha is the keyword which is frequently repeated at that period of the particular place in Chennai. Then keyword based images are retrieved from the image database similar to the keyword ‘vardha’. To retrieve the relevant images of the keyword, the proposed histogram + SIFT is used by spectral algorithm. The color histogram feature is used to extract only the color feature of the image. Then, SIFT feature is used to extract the salient feature of an images. In this proposed work, the combinations of color and SIFT features were used to extract the features of the images. Experiments are conducted on exclusive histogram and SIFT features separately and on the proposed combination of histogram and SIFT features.
Table 2: Summary of the keyword detection
Keyword Name
Number of words detected
Numb er of unique
words detected
Vardha 4482 578
Rain 3426 180
Cyclone 3210 347
Chennai 2612 199
Wind 4236 498
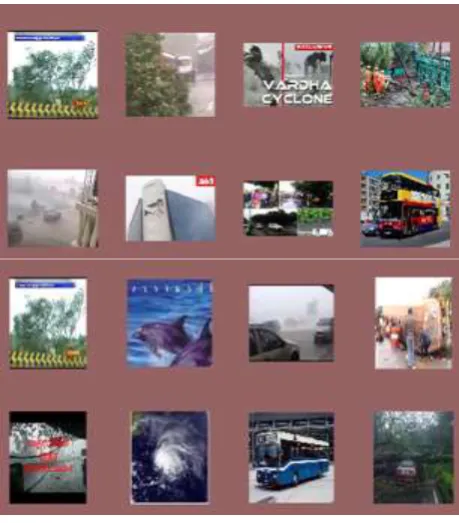
Figure 4 shows the topmost keyword detected from tweets. The topmost frequently detected keywords from the tweets are detected. Among that, number of words detected of keyword ‘Vardha’ is 4482. In that 578 are the unique words that are repeated frequently of the same keyword. Fig 5 represents the image retrieval from the image database based on the relevant keyword extracted from the tweets. In this fig 5, the keyword ‘vardha’ is the detected and the relevant images are retrieved from the database respectively. The proposed combination of histogram + SIFT features with spectral clustering gives better performances with precision of 85%, recall of 79% and accuracy of 82%.
Fig. 4. Topmost keyword detected from tweets
Fig. 5. Tweet Based Image Retrieval
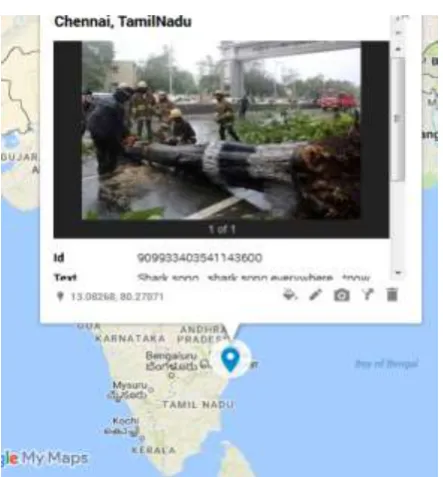
348 Fig. 6. Google map visualization of detected keyword
5. CONCLUSION
In this work, tweet based image retrieval is implemented to retrieve the images efficiently. The tweets are extracted and categorized using Multinomial Naïve Bayes classifier and the topmost keyword is detected using tf-idf feature extraction method. The keyword based images are retrieved using the proposed feature extraction methods with spectral clustering algorithm in MATLAB. The experiment results shows the accuracy of feature extraction proposed combination of histogram and SIFT as 82% compared to other feature extraction. From the results, it is observed that the proposed technique of feature extraction which is built on both combination of SIFT and histogram shows higher performance than extraction with either SIFT or color histogram. Hence, the combination of histogram and SIFT feature extraction can be used to retrieve relevant images than exclusively other techniques. Finally, the retrieved images are visualized using the Google map. It helps the people to gather lot of information at particular place easily.
Acknowledgments
The authors We would like to thank the Department of Computer Science and Engineering, Annamalai University for providing the lab facilities. We gratefully acknowledge the funding agency, the University Grant Commission (UGC) of the Government of India, for providing financial support.
REFERENCES
[1] Christos Tzelepis; Zhigang Ma; Vasileios Mezaris; Bogdan Ionescu; Ioannis Kompatsiaris; Giulia Boato; Nicu Sebe, Shuicheng Yan.(2016):Event-based Media Processing and Analysis: A Survey of the Literature. Image and Vision Computing.
[2] StevenVanCanneyt;StevenSchockaert, Bart Dhoed. (2016): Categorizing events using spatiotemporal and user features from Flickr. Information Sciences 328 ,pp 76–96.
[3] Hasan Mahmud; Md. Kamrul Hasan; Abdullah-Al-Tariq; M. A. Mottalib. (2016): Hand Gesture Recognition Using SIFT Features on Depth Image. Ninth International Conference on Advances in Computer-Human Interactions, ISBN: 978-1-61208-468-8.
[4] Jerrin Varghese. (2015) : GUI Based Large Scale Image Search with SIFT Features. International Journal of Science and Research,Vol.4, Issue 9, pp.2319-7064.
[5] M.Vadivukarassi; N. Nanthini; N. Puviarasan; P. Aruna.(2017): Clustering of Images from Social Media Websites using Combination of Histogram and SIFT Features. International Journal on Recent and Innovation Trends in Computing and Communication ISSN: 2321-8169 ,Volume: 5 Issue: 2.
[6] N. Nanthini; M.Vadivukarass; N. Puviarasan; P. Aruna. (2017): Analysis of Clustering Techniques for Retrieval of Images using Proposed Feature Extraction Method. International Journal of Innovative Research in Computer and Communication Engineering, Vol. 5, Issue 3.
[7] Shan Zeng; Rui Huang; Zhen Kang; Nong Sang.(2014):Image segmentation using spectral clustering of Gaussian mixture models,” Proceedings of Neurocomputing, vol.14, pp. 0925-2312.
[8] Yifang Yanga,c; Yuping Wangb; Xingsi Xueb .(2016): A novel spectral clustering method with superpixels for image segmentation. Proceedings of Optik, Elsevier, vol.127, pp.161–167.
[9] Dipesh Patel; Darshan Patel.(2016):Improvement
in Performance of Image Retrieval using Various Features in CBIR System. International Journal of Computer Applications,Vol.138, pp. 0975 – 8887.