© 2018 IJSRCSEIT | Volume 3 | Issue 3 | ISSN : 2456-3307
Predicting Employee Attrition Using Machine Learning
Ganesh V, Aishwaryalakshmi S, Aksshaya K, Abinaya M
Department of Computer Science, Saranathan College of Engineering, Tiruchirappalli, Tamil Nadu, India
ABSTRACT
Employee attrition is a major cost to an organization. Some costs are tangible such as training expenses and the time it takes from when an employee starts to when they become a productive member. However, the most important costs are intangible, such as new product ideas, great project management, or customer relationships. Employee attrition control is critical to the long-term health and success of any organization. An organization is only as good as its employees, and these people are the true source of its competitive advantage. Accurate predictions enable organizations to take action for the retention of employees. This project aims to use different supervised classifiers to make predictions, and chooses the most accurate one.
Keywords: Employee attrition, Machine Learning, Classification algorithms, Logistic Regression, kNN, Random Forest, Recursive Feature Elimination, SelectKBest, XGBoost
I.
INTRODUCTION
Human resource is the most important asset for a company to be competitive. Thanks to liberalization on the labor market, it has become possible for an employee to leave his job. However, having excess employees leave their jobs will influence the morale of the companies. The loss of good employees can diminish a company’s competitive advantage and lead to a reduction in output and quality. High employee attrition has a significant negative effect on an organization by virtue of lost productivity, increased training and recruitment costs.
Employees voluntarily leave an organization for various reasons, such as new opportunities, limited or no professional growth in current position, unhappiness with compensation, personal reasons, etc. By taking proactive action to retain its top employees, a company can thus reap substantial benefits, thereby increasing its top and bottom line.
II.
LITERATURE REVIEW
Rohit Punnoose et al [1] explored the application of Extreme Gradient Boosting (XGBoost) technique which is more robust because of its regularization formulation. Data from the HRIS of a global retailer was used to compare XGBoost against six historically used supervised classifiers and its significantly higher accuracy for predicting employee turnover was demonstrated.
Vidya Sunil et al [2] conducted a study to find the main causes behind the increase in employee attrition in software industries and to find out the ways to control attrition. The survey revealed that the attrition rate increased because of dissatisfaction with pay, relationship with boss, lack of career advancement and compensation.
to control attrition. This study was conducted in BPO companies at Bhubaneswar.
Moninder Singh et al [4] describe a framework for using analytics to proactively tackle voluntary attrition of employees. This approach uses data mining for identifying employees at risk of attrition and balances the cost of attrition/replacement of an employee against the cost of retaining that employee (by way of increased salary) to enable the optimal use of limited funds that may be available for this purpose, thereby allowing the action to be targeted towards employees with the highest potential returns on investment.
Santoshi Sengupta [5] presented an approach to determine what and how job-related and demographic variables are associated with employee satisfaction of the BPO employees.
Ankita Srivastava et al [6] proposed a model to identify the root causes of attrition and retention in BPOs, analyzing the level of employee motivation, satisfaction and involvement, generate a model for maximizing sustenance of employees in the organization and come up with concrete recommendations.
Vijay Anand et al [7] carried out a research in BPO companies in which the opinions of 120 respondents (both ex-employee and current employee) were taken. A structured questionnaire was used for collecting data, and Percentage analysis, Weighted average method, Chi-square Test and ANOVA have been incorporated for analysis purpose.
Hsin-Yun Chang [8] proposed a method that could select subsets more efficiently. In addition, the reasons why employers voluntarily turnover were also investigated in order to increase the classification accuracy and to help managers to prevent employers’ turnover. The mixed feature subset selection used in this study combined Taguchi
method and Nearest Neighbor Classification Rules to select feature subset and analyze the factors to find the best predictor of employer turnover.
Neeraj Pandey et al [9] presented an approach to explore the factors behind the high attrition in Indian ITeS call centres. A focussed group discussion (FGD) was conducted with a group to discuss the variables for attrition. Semi-structured interviews were conducted to validate the responses received during FGD. The key questions asked during the interview explored the reasons for joining and also reasons behind leaving the ITeS call centre jobs.
Rahul Yedida et al [10] discussed the application of the k-Nearest Neighbours (KNN) algorithm as a method of predicting employee attrition, with evaluation of employee performance, average monthly hours at work and number of years spent in the company, etc as features. Other approaches include the use of ANNs, decision trees and logistic regression.
Rupesh Khare et al [11] presented the application of logistic regression technique to predict employee attrition risk in an organization based on demographic data of separated employees. The demographic information of both separated and existing employees was used to develop a risk equation, which was later applied to assess attrition risk with current set of employees. Post this assessment, high risk cluster was identified and focus group discussions were initiated to find out the reasons and their requirements and hence action plan was created to minimize the risk.
III.
METHODS
3.1. Logistic Regression
Logistic regression is a statistical method for analyzing a dataset in which there are one or more independent variables that determine an outcome. The outcome is measured with a dichotomous variable (in which there are only two possible outcomes). The goal of logistic regression is to find the best fitting model to describe the relationship between the dichotomous characteristic of interest and a set of independent variables. Logistic regression generates the coefficients of a formula to predict a logit transformation of the probability of presence of the characteristic of interest. The logit transformation is defined as the logged odds:
=
where p is the probability of presence of the characteristic of interest.
And logit(p) = (
)
3.2. k-Nearest Neighbors (kNN)
K-nearest neighbors algorithm is a
non-parametric method used for classification, where the input consists of the k closest training examples in the feature space and the output is a class membership. An object is classified by a majority vote of its neighbors, with the object being assigned to the class most common among its k nearest neighbors measured by a distance function. The distance function used is Hamming distance, given by:
DH = ∑ –
3.3. Random Forest
Random forest is an ensemble learning method that uses a divide-and-conquer approach used to improve performance. The main principle behind ensemble methods is that a group of “weak learners” can come together to form a “strong learner”.
3.4. SelectKBest
SelectKBest is a feature selection algorithm that scores the features of a dataset using a score function and then removes all but the k-highest scoring features. It takes as a parameter the score function, which must be applicable to a pair of data from the training set (X) and test set (y). The score function returns an array of scores. SelectKBest then simply retains the first k features of training set with the highest scores. The score function used is Chi-Square (chi2). SelectKBest will compute the chi2 statistic between each feature of X and y (assumed to be class labels). A small value will mean the feature is independent of y. A large value will mean the feature is non-randomly related to y, and so likely to provide important information. The formula for the chi2 statistic is given by:
χ2 = = ∑ –
where Oi is the observed value and Ei is the expected
value.
3.5. Recursive Feature Elimination
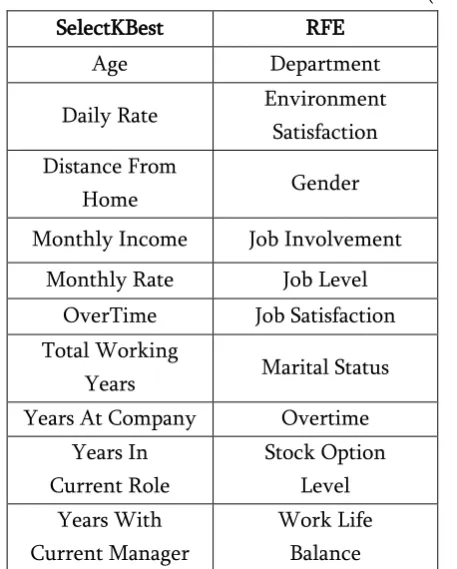
Table 1. Comparison of features selected by SelectKBest and Recursive Feature Elimination (RFE)
SelectKBest RFE
Age Department
Daily Rate Environment
Satisfaction Distance From
Home Gender
Monthly Income Job Involvement
Monthly Rate Job Level
OverTime Job Satisfaction
Total Working
Years Marital Status
Years At Company Overtime
Years In Current Role
Stock Option Level Years With
Current Manager
Work Life Balance
3.6. XGBoost
XGBoost stands for eXtreme Gradient Boosting. Gradient boosting is an efficient algorithm for converting relatively poor hypotheses into very good hypotheses. It is called gradient boosting because it uses a gradient descent algorithm to minimize the loss when adding new models. XGBoost is an implementation of gradient boosting machines, engineered for efficiency of compute time and memory resources.
IV. PROPOSED SYSTEM
A fictional dataset created by IBM data scientists is used for analysis. It has 35 attributes and 1470 observations. There are two class labels for the feature “Attrition” - Yes and No. The dataset includes various important features such as Age, Overtime, DailyRate, Job Satisfaction, Monthly Income, Distance From Home, Work Life Balance, EnvironmentSatisfaction, DailyRate etc. There are 34 independent features and 1 dependent feature (Attrition).
4.1. Data Preprocessing
The missing data from the dataset is handled by Interpolation, which is a mathematical technique to estimate the missing values in some interval, when a number of observed values are available within that interval. By default, linear interpolation is performed at the missing data points.
All the categorical values in each column are converted to numerical values using LabelEncoder. It encodes the labels with values between 0 and (number of classes - 1). For example, the feature MaritalStatus with labels “Divorced”, “Married” and “Single” is encoded as 0, 1 and 2 respectively.
4.2. Classification
The dataset is split into training and test data in the ratio 80:20. Different classification algorithms [as mentioned in Section 3] are used to train the training set. Furthermore, feature selection algorithms are also combined with classification algorithms to train the training set. The trained model is used to make predictions on the test data, and is also applied on the training data for cross validation. The model with the highest accuracy is used to make the final prediction.
Figure 1. Test Results
Abbreviations :
V.
CONCLUSION
This paper outlined the various classification algorithms used to predict employee attrition. For this dataset, the results showed the superiority of Logistic regression in terms of accuracy.
VI. REFERENCES
[1]. Rohit Punnoose, Pankaj Ajit, "Prediction of Employee Turnover in Organizations using Machine Learning Algorithms (A case for Extreme Gradient Boosting)", (IJARAI) International Journal of Advanced Research in Artificial Intelligence, Vol. 5, No. 9, 2016 [2]. Vidya Sunil Kadam, H.M.Thakar, "A Study of
Attrition in IT Industries in Pune", International Journal of Advanced Research (2014), Volume 2, Issue 3, 650-656, ISSN: 2320-5407
[3]. Dr. Sunil Kumar Dhal, Amaresh C Nayak, "A Study on Employee Attrition in BPO Industries in India", International Journal of Science and Research (IJSR), ISSN: 2319-7064
[4]. Moninder Singh, Kush R. Varshney, Jun Wang, Aleksandra Mojsilovic, "An Analytics
Approach for Proactively Combating
Voluntary Attrition of Employees", IEEE 12th International Conference on Data Mining Workshops (2012), 317-323
[5]. Santoshi Sengupta, "An exploratory study on job and demographic attributes affecting employee satisfaction in the Indian BPO industry", Strategic Outsourcing: An International Journal (2011), Volume 4, Issue 3, 248- 273
[6]. Ankita Srivastava, Yogesh Tiwari, Hradesh Kumar, "Attrition and Retention of employees in BPO sector", International Journal of Computer Technology and Applications, Volume 2, 3056-3065, ISSN: 2229-6093
[7]. V. Vijay Anand, R. Saravanasudhan, R. Vijesh, "Employee Attrition - A pragmatic study with reference to BPO Industry", IEEE - International Conference on Advances In Engineering, Science And Management (2012), 769-775
[8]. Hsin-Yun Chang, "Employee Turnover: A Novel Prediction Solution with Effective Feature Selection", WSEAS Transactions on Information Science and Applications (2009), Issue 3, Volume 6, 417-426
[9]. Neeraj Pandey, Gagandeep Kaur, "Factors influencing employee attrition in Indian ITeS call centres", International Journal of Indian Culture and Business Management (2011), Volume 4, Issue 4, 419-435
[10]. Rahul Yedida, Rahul Reddy, Rakshit Vahi, Rahul J, Abhilash, Deepti Kulkarni, "Employee Attrition Prediction", International Journal of Science and Research (2017), ISSN: 2319-7064 [11]. Rupesh Khare, Dimple Kaloya, Chandan