Automatic Learning and Evaluation of User-Centered Objective Functions for
Dialogue System Optimisation
Verena Rieser and Oliver Lemon
School of Informatics, University of Edinburgh, UK vrieser,[email protected]
Abstract
The ultimate goal when building dialogue systems is to satisfy the needs of real users, but quality assurance for dialogue strategies is a non-trivial problem. The applied evaluation metrics and resulting design principles are often obscure, emerge by trial-and-error, and are highly context dependent. This paper introduces data-driven methods for obtaining reliable objective functions for system design. In particular, we test whether an objective function obtained from Wizard-of-Oz (WOZ) data is a valid estimate of real users’ preferences. We test this in a test-retest comparison between the model obtained from the WOZ study and the models obtained when testing with real users. We can show that, despite a low fit to the initial data, the objective function obtained from WOZ data makes accurate predictions for automatic dialogue evaluation, and, when automatically optimising a policy using these predictions, the improvement over a strategy simply mimicking the data becomes clear from an error analysis.
1.
Introduction
The ultimate goal when building dialogue systems is to sat-isfy the needs of real users, but quality assurance for dia-logue strategies is a non-trivial problem. In conventional di-alogue design the didi-alogue often is designed following ‘best practises’ which are often obscure and emerge by trial-and-error (Paek, 2007). In addition, user preferences are highly context dependent (Hu et al., 2007). This is why dialogue strategy design is often referred to as being more of an art than a science (Jones and Galliers, 1996; Pieraccini, 2002) Over recent years, data-driven statistical optimisation meth-ods (e.g. Reinforcement Learning (RL)) for dialogue strat-egy design have become more and more popular (Lemon and Pietquin, 2007). One major advantage of RL-based di-alogue strategy development is that the didi-alogue strategy can be automatically trained and evaluated using the same objective function (Walker, 2005). In the context of RL the objective function is also called the “reward” (Sutton and Barto, 1998). Despite its central aspect for RL, quality as-surance for objective functions has received little attention so far. In fact, the reward function is one of the most hand-coded aspects in RL (Paek, 2006).
In this paper we propose a new method for meta-evaluation of the objective function. We bring together two strands of research: one strand uses Reinforcement Learning to au-tomatically optimise dialogue strategies, e.g. (Singh et al., 2002), (Henderson et al., 2008), (Rieser and Lemon, 2008a; Rieser and Lemon, 2008b); the other other focuses on auto-matic evaluation of dialogue strategies, e.g. thePARADISE
framework (Walker et al., 1997), and meta-evaluation of di-alogue metrics, e.g. (Engelbrecht and M¨oller, 2007; Paek, 2007). Clearly, automatic optimisation and evaluation of dialogue policies, as well as quality control of the objec-tive function, are closely inter-related problems: how can we make sure that we optimise a system according to real users’ preferences?
In particular, we construct a data-driven objective function using the PARADISEframework, and use it for automatic dialogue strategy optimisation following pioneering work by (Walker et al., 1998). However, it is not clear how
re-liable such a predictive model is, i.e. if it indeed estimates real user preferences. The models obtained withPARADISE
usually fit the data poorly (Engelbrecht and M¨oller, 2007). It is also not clear how general they are across different sys-tems and user groups (Walker et al., 2000), (Paek, 2007). Furthermore, it is not clear how they perform when be-ing used for automatic strategy optimisation within the RL framework.
In the following we evaluate different aspects of an ob-jective function obtained from Wizard-of-Oz (WOZ) data (Rieser and Lemon, 2008b). We proceed as follows: The next Section shortly summarises the overall dialogue sys-tem design. In Section 3. we test the model stability in a test-retest comparison across different user populations and data sets. In Section 4. we measure prediction accuracy. In Section 5. we conduct a detailed error analysis where we test the relationship between improved user ratings and di-alogue behaviour, i.e. we investigate which factors lead the users to give higher scores, and whether this was correctly reflected in the original objective function.
2.
Overall framework
2.1. Dialogue System Design
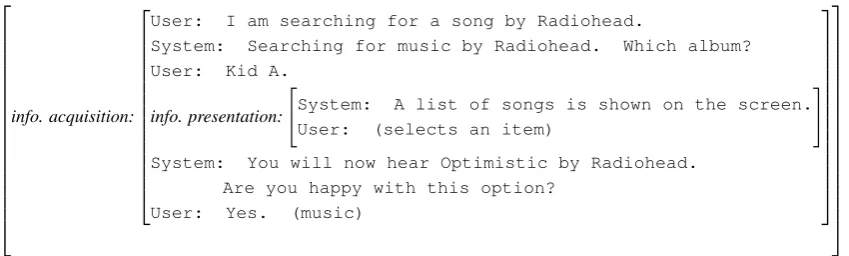
Our application domains are multimodal information seek-ing dialogue systems as an interface to an in-car MP3 player. The structure of information seeking dialogues con-sists of an information acquisition dialogue and an informa-tion presentainforma-tion sub-dialogue (see Figure 1).
less weight to dialogue length and the multimodal presen-tation score.
Figure 2: 3D Visualisation of the objective functions ob-tained from WOZ data and real user data using a SL and RL-based strategy.
4.
Model Performance: Prediction Accuracy
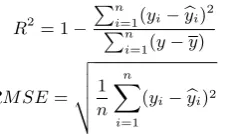
We now investigate how well these models generalise by testing their prediction accuracy. Previous research eval-uated two aspects: how well a given objective function is able to predict unseen events from the original system (En-gelbrecht and M¨oller, 2007), and how well it is able to pre-dict unseen events of a new/different system (Walker et al., 2000). We evaluate these two aspects as well, the only difference is that we use the Root Mean Standard Error (RMSE) instead ofR2for measuring the models prediction accuracy. RMSE is (as we argue) more robust for small data sets. In particular, we argue that, by correcting for variance,R2can lead to artificially good results when using small tests sets (which typically vary more) and is sensitive to outliers (see Equation 4). RMSE instead measures the (root) mean difference between actual and predicted values (see Equation 5).
R2= 1−
Pn
i=1(yi−byi)
2
Pn
i=1(y−y)
(4)
RM SE=
v u u t
1
n
n
X
i=1
(yi−byi)2 (5)
First, we measure the predictive power of our models within the same data set using 10-fold cross validation, and across the different systems by testing models trained on one sys-tem to predict perceived Task Ease for another syssys-tem, fol-lowing a method introduced by (Walker et al., 2000). The results for comparing the RMSE (max.7 for SL/RL, and max.5 for WOZ) for training and testing within data sets (ID 1-3) and across data sets (ID 4,5) are shown in Table 1. In order to present results from different scales we also report the percentage of the RMSE of the maximum error (% error). The results show that predictions according to PARADISEcan lead to accurate test results despite the low data fit. While for the regression model obtained from the WOZ data the fit was 10-times lower than for SL/RL,
the prediction performance is comparably good (see Table 1, ID 1–3). The models also generalise well across systems (see Table 1, ID 4–5).
ID train test RMSE % error
1 WOZSAMMIE WOZSAMMIE 0.82 16.42
2 SLiTalk SLiTalk 1.27 18.14
3 RLiTalk RLiTalk 1.06 15.14
4 RLiTalk SLiTalk 1.23 17.57
5 SLiTalk RLiTalk 1.03 14.71
Table 1: Prediction accuracy for models within (1-3) and across data sets (4,5).
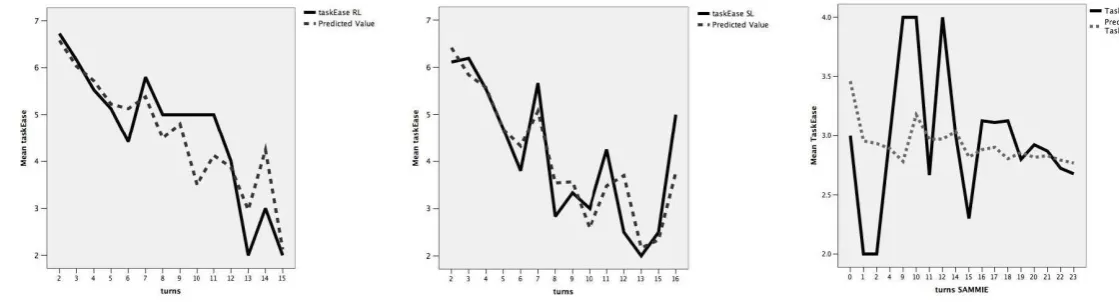
In addition, we evaluate model accuracy following a method introduced by (Engelbrecht and M¨oller, 2007). They suggest to compare model performance by plotting mean values for predicted and true ratings by averaging over conditions. We replicate this method, averaging mean ratings for observed and predicted Task Ease over number of turns. The resulting graphs in Table 2 show that the pre-dicted mean values per turn are fairly accurate for the SL and RL objective functions (first two graphs from the left). For the WOZ data, the predictions are less accurate espe-cially for low numbers of turns (graph on the right). This is due to the fact that for low numbers of turns only very few observations are in the training set: 25% of the dialogues are between 5 and 6 turns long (where the predictions are close to the observations) and 42% of dialogue are over 14 turns long (where the curves converge again). Only 33% covers the span between 7-13 turns, where the graphical comparison indicates low prediction performance. How-ever, these results are misleading for small data sets (as we argue). Quite the contrary is the case: the predicted val-ues show that the linear model does well for the majority of the cases and is not sensitive to outliers, i.e. the graph only diverges if there are too little obeservations. It therefore generalises well.
5.
Error Analysis
In previous work we showed that the RL-based policy sig-nificantly outperforms the supervised policy in terms of improved user ratings and dialogue performance measures (Rieser and Lemon, 2008b). Here, we test the relationship between improved user ratings and dialogue behaviour, i.e. we investigate which factors lead the users to give higher scores, and whether this was correctly reflected in the orig-inal reward function.
We concentrate on the information presentation phase, since there is a simple two-way relationship between user scores and the number of presented items. To estimate this relationship we use curve fitting, which is used as an alter-native model to linear regression in cases where the rela-tionship between two variables can also be non-linear. For each presentation mode (verbal vs. multimodal) we select the (simplest) model with the closest fit to the data (R2).
5.1. Training
Table 2: Average Task Ease ratings for dialogues of different length (in turns); the solid lines are the true ratings and the dashed line the predicted values.
the employed reward function for information presentation modelled from the WOZ data. The straight line presents the objective function for verbal presentation and the quadratic curve the one for multimodal presentation.
-80 -70 -60 -50 -40 -30 -20 -10 0 10
0 10 20 30 40 50 60 70
user score
no. items
reward function for information presentation
intersection point turning point:14.8
multimodal presentation: MM(x) verbal presentation: Speech(x)
Figure 3: WOZ objective function for the information pre-sentation phase
In the WOZ experiments wizards never presented more than 3 items using speech, resulting in a linearly decreasing line. This fact was captured by the learning schemes in dif-ferent ways. SL extracted the rule “never present more than 3 items using speech”. For RL the extrapolated line assigns negative values to more than 5 verbally presented items and intersects with the multimodal reward at 2.62, i.e. for more than 3 items the returned reward is higher when present-ing multimodally. Therefore the RL-based strategy learns to present up to 3 items verbally (on average not more than 2.4 items per dialogue).
5.2. Testing
We now apply the same curve-fitting method on theiTalk user test data in order to test whether the policy optimisa-tion had been successful. We therefore compare the curve fitting model obtained from the system running the RL pol-icy against the model obtained from the SL polpol-icy. The
hypothesis is that if the policy is good (i.e. consistently making the right decisions), this will result in equally high scores for all presented items, represented by a straight line; whereas if the curve is not linear, this indicates that the policy was sometimes making the right decision and some-times not.
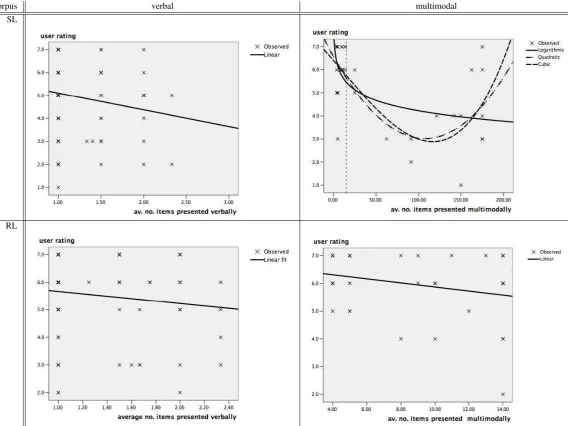
The estimated relationship between the average number of items presented verbally and the verbal presentation score from the user questionnaire is shown in the left column of Table 3. The straight, slightly declining line indicates that the policies in general make the right decision, although the fewer items they present the better. For verbal presenta-tion both learning schemes (RL and SL) were able to learn a policy from the WOZ data which received consistently good ratings from the users (between 6–5 for RL, and 5–4 for SL on a 7-point Likert scale).
For multimodal presentation the WOZ objective function has a turning point at 14.8 (see Figure 3). The RL-based policy learned to maximise the returned reward by display-ing no more than 15 items. The SL policy, in contrast, did not learn an upper boundary for when to show items on the screen (since the wizards did not follow a specific pattern, (Rieser and Lemon, 2008b)). When relating num-ber of items to user scores, the RL policy produces a linear (slightly declining) line between 7 and 6 (Table 3, bottom right), indicating that the applied policy reflected the users’ preferences. Hence, we conclude that the objective func-tion derived from the WOZ data gave the right feedback to the learner.
For the SL policy the Logarithmic function best describes the data.It function indicates that the multimodal presen-tation strategy received the highest scores if the number of items presented were just under 15 (Table 3, top right), which is the turning point of the WOZ objective function. This again indicates that, for theiTalk users the preferred multimodal policy was indeed the one reflected in the WOZ objective function.
6.
Conclusion
func-corpus verbal multimodal SL
RL
Table 3: Objective functions for information presentation
tions (for both dialogue policy learning and evaluation) reflecting the needs of real users. In particular, we de-rived a non-linear objective function from Wizard-of-Oz data which is used to automatically train a Reinforcement Learning-based dialogue strategy, which was then evalu-ated with real users.
To ensure the quality of the applied objective function we evaluated its stability, predictive power, and strategy im-provements in a test-retest comparison. We also conduct a detailed error analysis.
In sum, according to our measures, an objective function obtained from WOZ data is a valid first estimate of real users’ preferences. Despite a low fit to the initial data, the objective function obtained from WOZ data makes accurate predictions for automatic dialogue evaluation, and, when automatically optimising a policy using these predictions, the improvement over a strategy just mimicking the data becomes clear from an error analysis. The models obtained from the tests with a real system follow the same trends, but can be seen as more reliable estimates of the objective function in this domain. In future work we will explore
incrementally training a system according to improved rep-resentations of real user preferences, for example gathered online from a deployed spoken dialogue system.
This work also introduces non-linear objective functions for dialogue optimization, which merit further exploration in future work.
Acknowledgements
7.
References
Herbert Clark. 1996. Using Language. Cambridge Uni-versity Press.
Klaus-Peter Engelbrecht and Sebastian M¨oller. 2007. Pragmatic usage of linear regression models for the pre-dictions of user judegments. InProc. of SIGdial. James Henderson, Oliver Lemon, and Kallirroi Georgila.
2008. Hybrid reinforcement / supervised learning of di-alogue policies from fixed datasets. Computational Lin-guistics (to appear).
Jiang Hu, Andi Winterboer, Clifford Nass, Johanna D. Moore, and Rebecca Illowsky. 2007. Context & us-ability testing: user-modeled information presentation in easy and difficult driving condition. InProc. CHI, pages 1343–1346.
Karen Sparck Jones and Julia Galliers. 1996. Evaluating Natural Language Processing Systems: An Analysis and Review. Springer Verlag.
Oliver Lemon and Olivier Pietquin. 2007. Machine learn-ing for spoken dialogue systems. InProc. of Interspeech. Tim Paek. 2006. Reinforcement learning for spoken dia-logue systems: Comparing strengths and weaknesses for practical deployment. InProc. Dialog-on-Dialog Work-shop, Interspeech.
Tim Paek. 2007. Toward evaluation that leads to best practices: Reconciling dialogue evaluation in research and industry. InProc. of the NAACL-HLT Workshop on Bridging the Gap: Academic and Industrial Research in Dialog Technologies.
Roberto Pieraccini. 2002. The art and science of spoken dialog systems. Invited talk, The Center for Language and Speech Processing, Johns Hopkins University. Verena Rieser and Oliver Lemon. 2008a. Does this list
contain what you were searching for? Learning adap-tive dialogue strategies for interacadap-tive question answer-ing.Natural Language Engineering (to appear). Verena Rieser and Oliver Lemon. 2008b. Learning
effec-tive multimodal dialogue strategies from wizard-of-oz data: Bootstrapping and evaluation. InProceedings of the 46th Annual Meeting of the Association for Compu-tational Linguistics (ACL/HLT-08).
Verena Rieser, Ivana Kruijff-Korbayov´a, and Oliver Lemon. 2005. A corpus collection and annotation framework for learning multimodal clarification strate-gies. InProc. SIGdial.
Verena Rieser. 2008. Bootstrapping Reinforcement Learning-based Dialogue Strategies from Wizard-of-Oz data (to appear). Ph.D. thesis, International Research Training Group Language Technology and Cognitive Systems, Saarland University.
Satinder Singh, Diane Litman, Micheal Kearns, and Mar-ilyn Walker. 2002. Optimizing dialogue management with reinforcement learning: Experiments with the NJ-Fun system. JAIR, 16.
Richard Sutton and Andrew Barto. 1998. Reinforcement Learning. MIT Press.
Marilyn Walker, Diane Litman, Candance Kamm, and Ali-cia Abella. 1997. PARADISE: a general framework for evaluating spoken dialogue agents. InACL/EACL.
Marilyn Walker, Jeanne Fromer, and Shrikanth Narayanan. 1998. Learning optimal dialogue strategies: A case study of a spoken dialogue agent for email. In Proceed-ings of ACL/COLING.
Marilyn Walker, Candance Kamm, and Diane Litman. 2000. Towards developing general models of usability with PARADISE.Natural Language Engineering, 6(3). Marilyn Walker. 2005. Can we talk? Methods for