Subcategorization Acquisition as an Evaluation Method for WSD
Judita Preiss, Anna Korhonen, Ted Briscoe
University of Cambridge, Computer Laboratory 15 JJ Thomson Avenue, Cambridge CB3 0FD, UK
[email protected], [email protected], [email protected]
Abstract
Evaluation of word sense disambiguation (WSD) systems is often based on machine-readable dictionaries (MRDs). Such evaluation typically employs a set of fine-grained dictionary senses and considers them all to be equally important. In this paper, we propose a novel evaluation method for WSD systems in the context of automatic subcategorization acquisition. Building on an extant subcategorization acquisition system, we show that the system would benefit from WSD and propose modifications which allow it to make use of WSD. The enhanced subcategorization acquisition system can then be used as a task-based evaluation method for WSD systems where both the notion of sense and the sense’s relevance to the evaluation process is determined by the application itself.
1.
Introduction
We show that using word sense disambiguation (WSD) is likely to improve the performance of a subcategorization acquisition system. We suggest using an existing subcate-gorization acquisition system to find out which senses and verbs are important for this task. We therefore argue that subcategorization acquisition is well suited for a task–based method of evaluating WSD and present experiments which support this claim.
It is usually not possible to directly compare WSD sys-tems, as a number of factors can vary in the evaluation. This can be as fundamental as using a different underlying MRD (which may mean that the results cannot be easily mapped onto each other as different dictionaries tend to have differ-ent numbers of senses and differdiffer-ent sense distinctions). But even if an identical MRD is used, evaluating on different corpora will make results incomparable. Different corpora result in a difference in average polysemy potentially mak-ing one corpus much harder than the other. For example, if corpus 1 has average polysemy 3 and corpus 2 has av-erage polysemy 17, it is not clear that a system which has precision of 60% on corpus 2 really is worse than a system which scores 70% on corpus 1.
Due to these problems, WSD systems are now often compared by means of the SENSEVAL evaluation exercise (Kilgarriff, 1998). For example, the majority of the SEN
-SEVAL-2 tasks expected participants to assign a sense from
the WordNet 1.7 pre-release (Miller et al., 1990) to some subset of words from a text. The chosen senses were then scored against a gold standard. Thus in SENSEVAL exer-cises, systems are rewarded by an equal amount every time they choose a correct sense. For example, the verb get has 37 WordNet senses,1 and these are all considered equally important. Given that the frequency distribution of senses is likely to be zipfian, it is not clear to us that e.g. the pre-dominant WordNet sense of get “come into the possession of something concrete or abstract” (e.g. get your results the
next day) should be considered as important as the least
fre-This work was supported by UK EPSRC project GR/N36462/93: ‘Robust Accurate Statistical Parsing (RASP)’.
1In this paper, we refer to version 1.6. of WordNet, unless we
state otherwise.
quent sense “make children” (e.g. Abraham begot Isaac). Intuitively, it is more crucial to get frequently occurring senses correct.
It is also unclear whether evaluating WSD systems to a fine-grained level of a dictionary like WordNet is infor-mative or even necessary. Due to elusive nature of word senses and different models used for defining and repre-senting them lexical resources differ largely from one an-other in terms of sense granularity. WordNet is known to be exceptionally fine grained. For example, the Cambridge International Dictionary of English (CUP, 1995), lists only 23 senses for get, lumping some WordNet senses together.
The best level of sense granularity is, however, likely to be application-dependent. An alternative is thus to evaluate WSD systems in a task-based environment. This provides ultimate demonstration of success of a WSD technique and allows evaluation of senses that matter for the application in question.
Various task-based evaluation methods have been pro-posed in recent years, for example, in the context of ma-chine translation. In this task, senses are defined to be the target language translations and performance is judged by the accuracy of translation. An example of this is the Japanese translation task in SENSEVAL-2 (Kurohashi, 2002) where systems were evaluated on the Japanese-English language pair.
We propose a novel task-based evaluation in the con-text of automatic subcategorization acquisition. Subcatego-rization frame (SCF) frequencies have been shown to vary across corpus type (e.g. written vs. spoken language) and genre (e.g. financial vs. balanced text) and much of this variation is reported to be due to the effects of different corpus genres on verb sense and the effect of verb sense on subcategorization (Roland et al., 2000; Roland and Ju-rafsky, 2001). For example, the attack and bill senses of
charge each have a different set of SCF probabilities. The bill sense tends to be more frequent in a newswire
cor-pus, while the attack sense is usually more common in a balanced corpus. In consequence, charge will have dif-ferent overall SCF frequencies in these two corpora. The SCFs also vary under sense extensions. For example, in
she smiled herself an upgrade, the entire SCF is only
subcat-After smoothing, the resulting SCF distribution is fi-nally filtered to remove noise from the system output. This is done by setting a simple empirically determined thresh-old on the probability estimates after smoothing.
When back-off estimates based on the predominant sense are used for smoothing, Korhonen (2002) reports significant improvement in accuracy of subcategorization acquisition. On a test set of 45 verbs from 18 seman-tic classes, the proposed method yields 87% type preci-sion (the percentage of SCF types that the method proposes which are correct) and 71% type recall (the percentage of SCF types in the gold standard that the method proposes). The baseline method, which involves no smoothing at all, yields 85% precision and 47% recall. Thus, by assuming the predominant sense we obtain 78 F measure,5 while F measure is only 61 when no sense is assumed.
Compared to previous methods, this more semantically-driven method for subcategorization acquisition provides an effective way of dealing with low frequency associations and a means of predicting those unseen in corpus data.
3.
System Performance and Predominant
Sense
This work on SCF acquisition highlights several issues interesting from the WSD point of view. Firstly, significant improvement is reported with SCF acquisition by assuming the predominant sense only. This suggests that the predom-inant sense is the most important one and undermines the assumption that all senses are equally important. Interest-ingly, the predominant sense also tends to score very highly in an MRD-based evaluation of WSD systems (on real text).
In SENSEVAL-2, for example, only two systems out of 21
achieved a higher precision than the most frequent sense baseline in the English all-words task.
Secondly, good subcategorization acquisition results are obtained by assuming a fairly wide notion of a sense, based on a broad Levin class. These results indicate that WordNet style fine-grained sense distinctions are not necessary for the task in hand. This, in turn, is beneficial since the method would suffer from sparse data problems if a narrow notion of sense was assumed. For example, it would be difficult (or, in some cases, impossible) to obtain adequate back-off estimates for senses (i.e. semantic classes) very low in frequency.
This observation is consistent with the SENSEVAL re-sults: SENSEVAL-1 used Hector (Atkins, 1992 93) as its sense inventory, whereas SENSEVAL-2 used the more fine-grained WordNet. The overall results of systems participat-ing in the English lexical sample task in SENSEVAL-2 were much lower than the results in SENSEVAL-1.
Thirdly, the results reported in Korhonen (2002) show that when the predominant sense assignment is done cor-rectly, the method performs better with some verbs than others. This implies that assuming the predominant sense in all occurrences of a verb may not be sufficient for all verbs.
To identify the verbs whose performance shows room for improvement and which might benefit from WSD, we
5
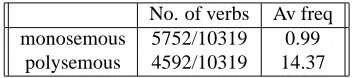
No. of verbs Av freq monosemous 5752/10319 0.99
polysemous 4592/10319 14.37
Table 1: Number and frequency of polysemous and monosemous verbs in WordNet
focused on polysemous verbs, i.e. verbs which have more than one sense. Table 1 shows that less than half of the verbs in WordNet are polysemous. However, if we also ex-amine the verbs’ relative frequency in WordNet (taken from the SemCor corpus), we find that polysemous verbs occur 14 times more frequently in corpus data than monosemous verbs. Thus in a piece of continuous text, we can expect the average polysemy to be higher than the 3.57 from Table 2. In fact, the average polysemy in the English all-words task
in SENSEVAL-2 was around 7.
In the context of subcategorization acquisition, we found no obvious correlation between system performance and the “degree of polysemy” of a verb, i.e. the number of senses taken by a verb. A highly polysemous verb such as
carry (38 WordNet senses), for instance, shows better
sub-categorization acquisition performance than punch, which has 3 WordNet senses only. We did find, however, clear correlation between system performance and the frequency of a predominant sense in SemCor data.
For example, consider the verb fly which has 14 Word-Net senses. While the predominant WordWord-Net sense covers 0.47% of the total frequency mass, the predominant Levin sense covers 0.72%. This is because as many as 6 of the fine-grained WordNet senses are mapped to the same se-mantic class with the predominant Levin sense (the Levin “Motion Verbs”):
1. travel through the air, be airborne (0.47%)
2. move quickly or suddenly (0.14%)
3. fly a plane (0.08%)
4. travel in an airplane (0.01%)
5. to run away (0.01%)
6. travel over (0.01%)
The verb stroke has, on the other hand, 4 WordNet senses. In this case, only the predominant WordNet sense is mapped to the semantic class with the predominant Levin sense (the Levin “Verbs of Contact”). The frequency of this sense covers 0.56% of the total frequency mass.
of Contact by Impact”) which covers 0.22% of the total fre-quency mass.
4.
Experiments
These observations with system performance suggest that high frequency polysemous verbs whose predominant sense is not frequent enough would benefit from extra WSD knowledge. We conducted two small scale experiments to investigate which senses, in addition to the predominant, would benefit from WSD and to what extent.
We investigated the following:
1. the frequency mass distribution over senses
2. the performance of the current subcategorization ac-quisition system when instead of the predominant sense, we assume the second sense.6
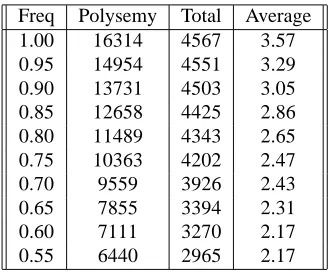
For each experiment, we chose a number of test verbs and manually mapped their WordNet senses to Levin senses. By examining the relation between the number of senses and the frequency mass these cover, we found that it may be sufficient to only map a subset of the WordNet senses. The decrease in average polysemy over all polyse-mous verbs in WordNet with relation to frequency mass is presented in Table 2.7 When all senses are considered, total
frequency mass covered is 1.00, the average polysemy in WordNet for polysemous verbs is 3.57. If we restrict the frequency mass to 0.75, the average polysemy drops by 1, to 2.47. It is due to the highly polysemous verbs (of which there are not many) that this decrease happens. For exam-ple, for the verb continue, to cover 0.75 of the frequency mass, we only need to consider the first two senses out of nine. Thus by restricting our investigations to those Word-Net senses which cover 0.75 of the total frequency mass, we will discard the numerous infrequent senses of the highly polysemous verbs.8
4.1. Experiment I
We chose 91 highly polysemous verbs from WordNet at random subject to the constraint that they occur in Sem-Cor with frequency higher than 100. Only 150 verbs occur in SemCor with frequency higher than 100, therefore these verbs are also highly frequent.
In the case of our 91 test verbs, the predominant Word-Net sense covers (on average) about 45% of the frequency mass and together the first and second most frequent Word-Net sense cover about 63% of the frequency mass (Table 3).9 Mapped to Levin, the first sense covers about 55%,
6
A number of results in this paper are presented only for the first and second sense to make them easier to understand. How-ever it is important to note that we are not proposing to introduce a numerical cut-off on the number of senses. Rather, we propose to introduce a cut-off based on the sense frequency.
7
This experiment uses the frequency distribution in WordNet which was derived from the SemCor corpus. Due to the small size of SemCor, we also smooth the frequencies.
8
This turns out to be necessary, as there will not be enough data for the rare senses to acquire new subcategorization frames.
9
Note that these percentages refer to the 75% frequency mass which we are considering, i.e. 45% corresponds to 45% out of 75%.
Freq Polysemy Total Average
1.00 16314 4567 3.57
0.95 14954 4551 3.29
0.90 13731 4503 3.05
0.85 12658 4425 2.86
0.80 11489 4343 2.65
0.75 10363 4202 2.47
0.70 9559 3926 2.43
0.65 7855 3394 2.31
0.60 7111 3270 2.17
0.55 6440 2965 2.17
Table 2: Polysemy in relation to total frequency mass (pol-ysemous verbs only)
0 0.1 0.2 0.3 0.4 0.5 0.6
0 5 10 15 20
mean relative frequency
sense number
Figure 1: Frequency distribution of all polysemous verbs
0 0.1 0.2 0.3 0.4 0.5 0.6
0 5 10 15 20
mean relative frequency
sense number
Figure 2: Frequency distribution of high frequency polyse-mous verbs
whereas the first and second most frequent senses mapped to Levin cover 93%. We therefore conclude that the most frequent senses of polysemous high frequency verbs from WordNet tend to be mapped to distinct Levin classes. Pre-sumably if a verb is frequently used in two different senses, these have to be sufficiently semantically different to be dis-tinguishable.
Frequency mass (%) predominant WN sense 45.17
second WN sense 17.35
predominant Levin sense 55.44
second Levin sense 38.03
Table 3: The frequency mass covered by the predominant and second WordNet and Levin sense
Figure 1 and a histogram presenting the mean for all highly frequent (frequency of occurrence greater than 100 in Sem-Cor) verb is shown in Figure 2. Although the overall shape of the graphs is zipfian, the means of the relative frequen-cies are higher for the initial senses in the polysemous fre-quent verbs. This implies that it is important to consider more than the most frequent sense for high frequency poly-semous verbs.
4.2. Experiment II
For the second experiment, we selected 16 polysemous high frequency verbs whose predominant sense belongs to one of 8 Levin classes. We took a sample of 20 million words of the BNC corpus and extracted all sentences con-taining an occurrence of one the verbs. After the extraction process, we retained 1000 citations, on average, for each verb.
The sentences containing these verbs were processed by the SCF acquisition system, using the method outlined in Section 2. Three lexicons were acquired for each verb so that we assumed (i) the predominant Levin sense (i.e. back-off estimates of the predominant Levin sense were used for smoothing), (ii) the second most frequent one (i.e. back-off estimates of the second sense were used)10, and, as a
baseline, (iii) no sense at all (i.e. no smoothing was done). The results were evaluated against a manual analysis of the corpus data. This was obtained by analyzing a max-imum of 300 occurrences for each test verb in the BNC corpus. Type precision, type recall and F measure were calculated (see Section 2. for details).
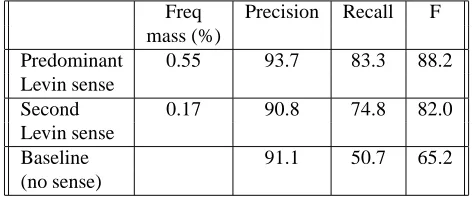
The average frequency mass for the predominant and the second senses for our verbs is shown in the second col-umn of Table 4. The results included in the third, fourth and fifth column show that by assuming both the predominant and the second senses, we obtain clearly better performance (in terms of the F measure) than when assuming no sense at all. The predominant sense yields 6.2 better F measure than the second sense. The fact that the difference is not bigger (i.e. the performance with the second sense is surprisingly high considering that its frequency mass is 17% on aver-age) is due to our restricting the evaluation to Levin classes which – despite being semantically different – are syntac-tically somewhat similar (they mainly cover verbs taking NP and PP complements). However, these results confirm the importance of the second most frequent sense and
sug-10Note that the subcategorization acquisition system uses the
back-off estimates for the second sense only. The system does not combine predominant sense and second sense back-off estimates in any way.
Freq Precision Recall F mass (%)
Predominant 0.55 93.7 83.3 88.2
Levin sense
Second 0.17 90.8 74.8 82.0
Levin sense
Baseline 91.1 50.7 65.2
(no sense)
Table 4: SCF acquisition results
gest that disambiguating both senses together should help to improve subcategorization acquisition performance.
5.
Future Work
The framework outlined in Section 2. requires modifi-cation in order to benefit from WSD and before the system can be used for task-based WSD evaluation.
The mapping between predominant WordNet and Levin senses needs to be extended to cover all senses correspond-ing to 75% of frequency mass. This work is required, how-ever, for polysemous high frequency verbs only. Once the mapping is obtained, the corpus data can be disambiguated and for each verb, the resulting data divided into the first few senses (as many as cover 75% of frequency mass) and any other sense occurrences. Subcategorization can then be acquired for these data sets separately, using back-off esti-mates of the corresponding senses and using no back-off in the case of “other senses”.
To carry this work out, we must find a suitable WSD method. Current WSD systems do not tend to significantly outperform the most frequent sense baseline. However, as our task-based evaluation is only required WSD for high frequency polysemous verbs, we believe that an existing supervised system could be adapted to generate accurate word sense disambiguation for the chosen verbs. Super-vised systems tend to have a higher accuracy than unsuper-vised systems. A system such as that described in Mihalcea and Moldovan (2002) was one of the two systems which outperformed the most frequent sense baseline in SENSE
-VAL-2.
Immediate future work will include modifying the sys-tem as proposed and carrying out a small scale experiment on evaluation of WSD in this framework.
6.
Conclusion
7.
References
S. Atkins. 1992–93. Tools for corpus-aided lexicogra-phy: the HECTOR project. Acta Linguistica Hungarica, 41:5–72.
B. K. Boguraev and E. J. Briscoe. 1987. Large lexicons for natural language processing utilising the grammar cod-ing system of the Longman Dictionary of Contemporary
English. Computational Linguistics, 13(4):219–240.
E. Briscoe and J. Carroll. 1997. Automatic extraction of subcategorization from corpora. In Proceedings of ACL
ANLP97, pages 356–363.
E. Briscoe. 2001. From dictionary to corpus to self-organizing dictionary: learning valency associations in the face of variation and change. In Proceedings of
Cor-pus Linguistics, pages 79–89.
G. Carroll and M. Rooth. 1998. Valence induction with a head-lexicalized PCFG. In 3rd Conference on Empirical
Methods in Natural Language Proce ssing.
CUP, editor. 1995. Cambridge International Dictionary of
English. CUP.
R. Grishman, C. Macleod, and A. Meyers. 1994. Com-lex syntax: building a computational Com-lexicon. In
In-ternational Conference on Computational Linguistics, COLING-94, pages 268–272.
A. Kilgarriff. 1998. SENSEVAL: An exercise in evalu-ating word sense disambiguation programs. In LREC, pages 581–588.
A. Korhonen. 2002. Subcategorization Acquisition. Ph.D. thesis, University of Cambridge.
S. Kurohashi. 2002. SENSEVAL-2 Japanese translation task. In Proceedings of SENSEVAL-2: Second
Inter-national Workshop on Evaluating Word Sense Disam-biguating Systems.
G. Leech. 1992. 100 million words of English: the British National Corpus. Language Research, 28(1):1–13. B. Levin. 1993. English Verb Classes and Alternations.
Chicago University Press.
C. D. Manning and H. Sch¨utze. 1999. Foundations of
Sta-tistical Natural Language Processing. MIT Press.
R. Mihalcea and D. I. Moldovan. 2002. Pattern learn-ing and active feature selection for word sense disam-biguation. In Proceedings of SENSEVAL-2: Second
In-ternational Workshop on Evaluating Word Sense Disam-biguating Systems.
G. Miller, R. Beckwith, C. Felbaum, D. Gross, and K. Miller. 1990. Introduction to WordNet: An on-line lexical database. Journal of Lexicography, 3(4):235– 244.
D. Roland and D. Jurafsky. 2001. Verb sense and verb subcategorization probabilities. In S. Stevenson and P. Merlo, editors, The Lexical Basis of Sentence
Pro-cessing: Formal, Computational, and Experimental Is-sue. Cambridge University Press, Jon Benjamins,
Ams-terdam. To appear.
D. Roland, D. Jurafsky, L. Menn, S. Gahl, E. Elder, and C. Riddoch. 2000. Verb subcatecorization frequency differences between business-news and balanced cor-pora. In ACL Workshop on Comparing Corpora, pages 28–34.
A. Sarkar and D. Zeman. 2000. Automatic extraction of subcategorization frames for Czech. In 19th
Interna-tional Conference on ComputaInterna-tional Linguistics, pages