Available online:https://edupediapublications.org/journals/index.php/IJR/ P a g e | 186
A study on financial inclusion (with Special
Reference to Baramulla Co-operative Bank)
Dr Vishakha Kutumbale
1& Mehraj u din Bhat
2 1Professor School of Economics, Devi Ahilya Vishwavidyalaya, Indore, (M.P
).
2
Research Student School of Economics, Devi Ahilya Vishwavidyalaya, Indore, (M.P
).
Abstract:
Finance has become an essential part of an economy for development of the society as well as economy of nation. For, this purpose a strong financial system is required in not only in under-developed countries and developing countries but also under-developed countries for sustainable growth. Through Financial inclusion we can achieve equitable and inclusive growth of the nation. Financial inclusion stands for delivery of appropriate financial services at an affordable cost, on timely basis to vulnerable groups such as low income groups and weaker section who lack access to even the most basic banking services.in this research paper The present Study carried out in order to look the role of co-operative banks in the financial inclusion and also to study the perception of people towards the financial inclusion.
Keywords words:-Financial Inclusion, Baramulla Co-Operative Bank, income and saving relationship.
Introduction
inancial inclusion is new paradigm of economic growth which plays a major role in driving away the poverty. Lack of access to financial services in most of rural areas due to high informative barriers and low awareness, poor functioning and financial history of financial institutions, near absence of insurance and pension service create the need and scope of financial inclusion. Financial inclusion is integral to the inclusive growth process and sustainable development of the country. It is a policy of involving a wider section of population deposit mobilization and credit intermediation. Financial inclusion is a buzzword now and has attracted the global attention in the recent and past. In India, it is a new concept. More than 70% of our population lives in the rural areas. Financial inclusion is a necessity for a country where a large chunk of the world’s poor resides. Access to finance by the poor
and vulnerable groups is a prerequisite for poverty reduction, employment, economic growth and social cohesion. Financial inclusion refers to a process that ensures the ease of access, availability and usage of the formal financial system for all members of an economy.
Available online:https://edupediapublications.org/journals/index.php/IJR/ P a g e | 187 often found to be exploitative. An inclusive
financial system facilitates efficient allocation of productive resources and thus can potentially reduce the cost of capital. This system enhances efficiency and welfare by providing avenues for secure and safe saving practices and by facilitating a whole range of efficient financial services like easy day to-day management of finances, safe money transfer etc. The govt. of India as well as the banking industry has recognized this imperative and has undergone fundamental changes over the last two decades. In fact, in order to address the issues of financial inclusion, the Government of India constituted a “Committee on Financial Inclusion” under the Chairmanship of Dr. C. Rangarajan. Not only in India, but financial inclusion has become an issue of worldwide concern, relevant equally in economies of the underdeveloped, developing and developed nations.
Financial inclusion is instrument to the inclusive growth process and sustainable economic development of India. There has been increasing awareness and realization that financial services hold the key to mainstreaming the poor and disadvantaged with the development of the country. Inadequacies in rural access to formal financial system and the seemingly extraordinary terms of informal finance for the poor warrant a strong need and ample space for innovative approaches to serve the financial needs of India’s rural poor. Financial inclusion stands for provision of important financial services like credit, savings, insurance and remittances at an affordable cost to the disadvantaged, marginal and low-income groups across sections of the society. The primary goal of financial inclusion is to broaden the scope of
activities of the formal financial system that could tag the poor people with low incomes into formal financial system in a gradual manner with focus on freeing the poor people from poverty.
Normally the weaker sections of the society are completely ignored by the formal financial institutions, in the race of making chunks of profits or the complexities involved in providing finance to the weaker section. Financial inclusion or inclusive financing is the delivery of financial services, at affordable costs, to sections of disadvantaged and low income segments of society. There have been many formidable challenges in financial inclusion area such as bringing the gap between the sections of society that are financially excluded within the ambit of the formal financial system, providing financial literacy and strengthening credit delivery mechanisms so as to improvised the financial economic growth. After studying these research papers and articles, I have studied the financial inclusion in the district Baramulla J&K via Baramulla cooperative bank and also studied the perception of the respondents towards the financial inclusion.
REVIEW OF LITERATURE:-
Financial inclusion has become the buzzword in academic research, public policy meetings and seminars drawing wider attention in view of its important role in aiding economic development of the resource poor developing economies. Many theories and researches have been done on financial inclusion some of them are as follows:-
RBI definesFinancial Inclusion as “a
Available online:https://edupediapublications.org/journals/index.php/IJR/ P a g e | 188 and low income groups in particular, at an
affordable cost in a fair and transparent manner by regulated mainstream institutional players”. Therefore, the objective of Financial Inclusion (FI) is to extend financial services to the large hitherto unreserved population of the country to unlock its growth potential. In addition, it strives to achieve more inclusive growth by making financing available to the poor in particular. Thus, keeping in view of the interests of the poor people, the Government of India (GoI) has taken a number of measures so that the underprivileged sections of the society can reap the benefits of the financial services
Rangarajan Committee (2008) on financial inclusion stated that: “Financial inclusion
may be defined as the process of ensuring access to financial services and timely and adequate credit where needed by vulnerable groups such as weaker sections and low income groups at an affordable cost.” The financial services include the entire gamut of savings, loans, insurance, credit, payments, etc. The financial system is expected to provide its function of transferring resources from surplus to deficit units, but both deficit and surplus units are those with low incomes, poor background, etc. By providing these services, the aim is to help them come out of poverty.
MandiraSarma and Jesim Pais. (2008).
Financial Inclusion and Development: A Cross Country Analysis suggests that the issue of financial inclusion is a development policy priority in many countries. Among socio-economic factors, as expected, income is positively associated with the level of financial inclusion. Further physical and
electronic connectivity and information availability, indicated by road network, telephone and internet usage, also play positive role in enhancing financial inclusion
Government of India (2008), “Committee
on Financial Inclusion”examined financial inclusion as a delivery mechanism providing financial services at an affordable cost to the Transfer
of funds
Bank Account
Financial Inclusion
Savings
Cheaper credit
Insurance Financial
Available online:https://edupediapublications.org/journals/index.php/IJR/ P a g e | 189 vast sections of the disadvantaged and
low-income groups. The recommendations of the report focused on the following areas. First, financial inclusion should include access to mainstream financial products. Second, banking and payment services should be available to the entire population without discrimination. Third, promotion of sustainable development and generation of employment in rural areas should be a priority. Fourth, financial inclusion must be taken up in a mission mode and thereby suggested the constitution of a National Mission on Financial Inclusion (NMFI) in order to achieve universal financial inclusion within a specific time frame. Fifth, the Committee also recommended for the constitution of two funds with NABARD – the Financial Inclusion Promotion and Development Fund, and the Financial Inclusion Technology Fund for better credit absorption capacity among the poor and vulnerable sections of the country and also for proper and appropriate application of technology in order to facilitate the mandated levels of inclusion. In short, the report provided an understanding of one of the best ways to achieve inclusive growth through financial inclusion.
Michael Chibba. (2009) „„Financial Inclusion, Poverty Reduction and the millennium Development Goals” noted that Financial Inclusion is an inclusive development andPoverty Reduction strategy that manifests itself as part of the emerging FI-PR-MDG nexus.However, given the current global crises, the need to scale-up Financial Inclusion is nowperhaps more important as a complementary and
incremental approach to work
towardsMeeting the MDGs than at any other time in recent history.
Joseph Massey. (2010)„„Role of Financial Institutions in Financial Inclusion” said that, role of financial institutions in a developing country is vital in promoting financial inclusion. The efforts of the government to promote financial inclusion and deepening can be further enhanced by the pro-activeness on the part of capital market players including financial institutions. Financial institutions have a very crucial and a wider role to play in fostering financial inclusion
CRISIL (2013), “Inclusix Financial
Inclusion Index”measured the extent of financial inclusion in India in the form of an index. It makes use of the non-monetary aggregates for calculating financial inclusion. The parameters used by the CRISIL Inclusix took into account the number of individuals having access to various financial services rather than focusing on the loan amount. The three parameters of the index were branch, deposit and credit penetration. These parameters were updated annually and based on the availability of data; additional services such as insurance and microfinance were added. The key findings of the report were as follows: one in two Indians has a savings account and only one in seven Indians has access to banking credit; CRISIL Inclusix at an all-India level stood at a relatively low level of 40.1 for 2011 (on a scale of 100). In short, CRISIL gave ground-level information regarding the progress of financial inclusion in the country’s rural and also in urban areas.
Available online:https://edupediapublications.org/journals/index.php/IJR/ P a g e | 190 included designing principles for maximum
financial inclusion and financial deepening and also framing policies for monitoring the progress in the development of financial inclusion in India. Thus, in order to achieve the goal of maximum financial inclusion and increased access to financial inclusion the committee proposed the following measures: provision of full-service electronic bank account; distribution of Electronic Payment Access Points for easy deposit and withdrawal facilities; provision of credit products, investment and deposit products, insurance and risk management products by formal institutions. The main findings of the report highlighted the following key issues. First, the majority of the small businesses were operating without the help of formal financial institutions. Second, more than half of the rural and urban population did not have access to bank account. Third, savings in terms of GDP have declined in 2011-12. To address these issues, the Committee recommended that each individual should have Universal Electronic Bank Account while registering for an Aadhar card. The committee also proposed for setting up of payments banks with the purpose of providing payments services and deposit products to small businesses and low income households. Also banks should purchase portfolio insurance which will help in managing their credit exposures. Further, the Committee recommended for setting up of a State Finance Regulatory Commission where all the state level financial regulators will work together.
Role
of
cooperative
banks
in
facilitating Financial Inclusion
Cooperative banks have very good network in rural areas; moreover mostly they have local staff. Therefore they are better placed to
understand and solve the problem of rural poverty by strengthening the supply side of Financial Inclusion. They can effectively contribute to improvement in demand side also. However, for effective facilitation of Financial Inclusion there should be total commitment by their respective boards. National Bank for Agriculture and Rural Development (NABARD) should undertake intensive training and development
programme for board members of
cooperative banks. This will result into better commitment by the boards towards poverty reduction in respective areas. Training and Development programme should make them understand their important role in the cause of poverty reduction through professional approach to management. Training inputs should over a period of time, change the approach of board towards management of cooperative banks.
Available online:https://edupediapublications.org/journals/index.php/IJR/ P a g e | 191 borrowers and depositors. However
cooperatives have developed serious weaknesses and need be addressed to urgently. Revitalized cooperative banks can be very effective in facilitating Financial Inclusion. Thrust areas, such as Human Resource Development, Credit Management and Information and Communication Technology are suggested which will strengthen cooperative banks and promote inclusive growth in rural customer grievance redress across all financial products and services which would coordinate with the respective regulator.
Objectives:-
To study over view of the Baramulla co-operative bank.
To understand the progress of the cooperative banks in financial inclusion.
To understand the demography of the respondents.
To analyse the income and saving relationship of the respondents.
To study the perception of the respondents in the financial inclusion.
Research Methodology: -The study area for this research is district Baramulla J&K, in order to understand the nature and extent of financial inclusion in the rural area. The information &data for the research has been collected through Primary sources. Primary data was collected through the questionnaire and personal interviews. In this paper various statistical tools have been used percentage analysis has been used for the performance of the bank performance from the 1990-2015 and also for the demography of the respondents,chi-square test has been used to check the relationship between the gender, age, income and occupation.
Chi-square test is used to test the independence of two variables, each having at least categories. The hypothesis is tested using Chi square test for independence given by:
X2=∑ 𝑂−𝐸
𝐸
2
whereas O is observed frequency and E is Expected frequency
Regression analysis is used to test the overall relationship exists between the dependent variable and a set of independent variables. In this research regression analysis is used to check the causal relationship between the income and savings.
The likert scale method was used to check the perception of the people in the financial inclusion. Six questions were asked, in which everyquestion has five pointscales. In scale given was strongly interested (1) Interested (2) Neutral (3) Disinterested (4) and strongly disinterested (5). Respondents have to give the rating scale to each question. All the responses are shown in pie charts.
History of Baramulla Co-Operative Bank
Baramulla co-operative bank was established in 1920,at that time there was only a single branch in Baramulla, now there are 36 working banks in the in district Baramulla, Kupwara and Bandipora. The bank is named as Baramulla co-operative bank because previously it was working only in district Baramulla only now it’s working in few more districts in the valley. Baramulla co-operative bank is a host of banking services to its customers such as Deposits and loans, and all the Govt sponsored schemes.
Available online:https://edupediapublications.org/journals/index.php/IJR/ P a g e | 192 employees. At present the bank has achieved
the deposits upto 31/03/2015 Rs 29806.28 lakhs and advancedloan Rs 19247.02 lakhs. The bank is running in the net profit for the
year up to 31 March2015 to 31 March2015Rs 43.70 lakhs. loan Rs 19247.02 lakhs. The bank is running in the net profit for the year up Rs 43.70 lakhs.
Data analysis and discussion
Over View of Baramulla Co-Operative Bank:
The table 1.1 shows Number of deposits and amount in Baramulla Co-operative Bank from1950-2015
Source Baramulla Cooperative bank
From the above table it is shown that from the time of establishment of bank its account holders
have been increased and also bank is running in the profit in 1920 there were only one lakhs
current account, 2 lakhs savings account and only fifty thousand fixed deposit’s now in 2015 the
bank has increased its customers 10 times from 1920. In 2015 there are 27976 current account
holders. 153170 saving account holders .19468 fixed deposit account holders .there are also
50730 credit account holders in the bank. DEPOSITS 1920 TOTAL AMOU NT (in Rupees) NO.OF ACC HOLDE RS 1990 Amou nt In lakhs NO.OF ACC HOLDE RS 2001 Amou nt in lakhs NO.OF ACC HOLDE RS 2015 TOTA L Amoun t in Lakhs NO.O F ACC Holde rs CURRENT AC
1,00,000 100 185.0
6
7976 822.4
1
17976 1873.3
9
27976
SAVINGS AC
2,00,000 250 336.0
8
43170 2535.
5
103170 14793.
88 15317 0 TERMDEP OIT FIXED AC
50,000 75 223.6
8
9068 3462.
4
9468 111323
.3
19468
TOTAL DEPOSIT AC
35,0000 425 745.0
0
60214 6820.
3
130614 27799.
03
21031 1
CREDIT AC 00 1088.
Available online:https://edupediapublications.org/journals/index.php/IJR/ P a g e | 193
Table1.2 shows the percentage change in the number of account holders and the amount from the1990-2001 and from 2001-2015
Source: Self-Generated
The percentage analysis of the two periods reflects that there is a sharp decrease in the number of
account holders in CASA accounts(Current account and saving account), whereas there has been
a sharp increase in the number of term deposit account holders. The fall in the number of CASA
account holders is also true for decrease in the amount in these accounts, although it is good that
in the period 1990-2001 there has been a significant increase in CASA account holders and the
amount in these accounts, but for the period 2001-2015 the decrease can be attributed due to :
1. More number of banks opens in this area.
2. Majority of population have already bank account.
3. Lack of awareness about the polices of cooperative banks,
4. Incompetency of Baramulla Co-Operative bank in marketing about itself.
The statistic of Term deposits for number of account holders and amount in this account reflects
that, although there is sharp increase in number of term deposits account holders ( 4.4% -
105.6% ) but the amount in these account has fall down sharply ( 61.82 -17.5 ). It shows that
the data is for semi-rural/rural area. The amount of saving is very low or small; therefore it has
been increased in the number but not in amount. It also reveals that the saving motive of the
costumers of this bank has increased.
1990-2001 2001-2015
CURRENT ACCOUNT
SAVING ACCOUNT
TERM DEPOSITS
CURRENT ACCOUNT
SAVING ACCOUNT
TERM DEPOSITS PERCENTAGE
CHANGE IN THE NO OF
ACCOUNTS HOLDERS
125.30 140.23 4.4 5.5 48.46 105.6
PERCENTAGE CHANGE IN THE AMOUNT (IN LAKHS )
Available online:https://edupediapublications.org/journals/index.php/IJR/ P a g e | 194 0
20 40 60 80
Male Female
Gender
Graph 1 showing the percentage of the respondents
From the above graph it is shown there are 80% male and only 20% female respondents in the
survey held.
Graph 2
Occupation of the
respondents
Graph 2 shows the occupation of the respondents. From the survey of 80 people 36% people are
doing business and 40% are Government employees and 13% people are farmers
Table4 Cross tabulation between Gender and Income of the Respondents Income of the Respondent
Total
Gender Less than
10000
10000-20000
20000-30000
30000-40000
above 40000
Male
Female
12 20 12 11 8 63
2 5 4 4 2 17
Total 14 25 16 15 10 80
0 10 20 30 40 50
BUSINESSMAN SERVICE FARMER
Available online:https://edupediapublications.org/journals/index.php/IJR/ P a g e | 195 The null hypothesis considered is thatthere no significant relationship between the income of the people and gender, these are two independent variables
The result of chi square gives the p-value is .934 which is much higher than the commonly accepted levels of either .05 or .10. So we accept nullhypothesis, therefore we can say that there is a no significant relationship between the income of the people and gender. In my survey the female respondents are earning less in all the occupations as compared to male respondents, so we say that there is gender discrimination. It is also getting reflected from the graph below.
Chi square test Value DF p-value
Available online:https://edupediapublications.org/journals/index.php/IJR/ P a g e | 196 Similarly we have tested the relation between age and income as well as income and occupation of the respondents and the results are shown below.
There Null hypothesis considered is that there is significant Relationship between the age of the respondent and the income of the respondent, both are independent variables.
In the above table in rows age of the respondent is shown and in columns income of the respondents is shown. Since the calculated p- value0.112 is more than the commonly accepted levels of either .05 or .10 so we accept our null hypothesis. So we can say that there is no significant relationship between age and the income of the respondents.
Age of respondents Income of the Respondent
Total
Less than 25
25-35 35-45
Above 45 Total
Less than 10000
10000-20000
20000-30000
30000-40000
above 40000
6 7 1 2 0 16
4 9 8 6 4 31
3 4 4 7 5 23
1 5 3 0 1 10
14 25 16 15 10 80
Chi square test Value Df p-value
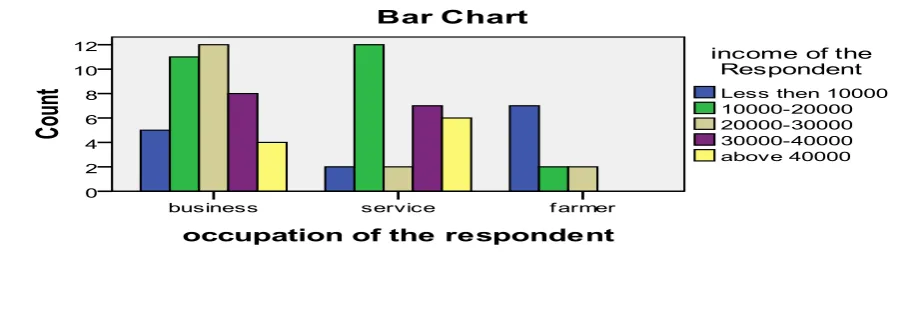
Available online:https://edupediapublications.org/journals/index.php/IJR/ P a g e | 197 The Null hypothesis considered is that, there is no significant relationship between the income and the occupation of the people both of them are independent variables
In the above table income is shown in the columns and the occupation is shown in the row. The calculated p- value 0.001 is less than the 0.05 and 0.01 therefore our null hypothesis is rejected and alternative hypothesis is accepted. Therefore we can say that there is a significant relationship between the income and the occupation of the people, it can also be shown in the graph below.
Table 6 showing Cross tabulation between occupation and Income of the Respondent
income of the Respondent
Total
Occupation Less than
10000
10000-20000
20000-30000
30000-40000
above 40000
Business 5 11 12 8 4 40
Service 2 12 2 7 6 29
Farmer 7 2 2 0 0 11
Total 14 25 16 15 10 80
Chi Square Test
Value Df p-value
Available online:https://edupediapublications.org/journals/index.php/IJR/ P a g e | 198
Income Saving Analysis
From our survey data we also wanted to know about the respondent’s ability to save as most of them belong to lower middle income group of this area. This enquiry will let us know about their saving levels and also their propensity to consume.For this purpose we have used simple regression model to analyze the causal relationship between the monthly income and the saving of the respondents.
t
U
Income
Savings
0
1
t t
t
X
U
Y
0
1
Y
t= 4460.2597 + 0.05618 (Income)
The result of the regression model also shows the power of model is 94.9 % .so for this primary data survey income is an important determinant of savings of the respondents. The results of the regression model also show that, the intercept as well as the slope co-efficient are statistically significant at the 1% level of significance. The intercept gives the average savings of the respondents which is ₹4460. The slope co-efficient of this model gives marginal propensity to save (MPS), for this analysis it is estimated to be 0.056. it reveals that marginal propensity to save is very low because for one unit of increase in income the savings is 0.056. From this statistics we can also deduce marginal propensity to consume (MPC);
MPC=1-MPS=1-0.056=0.094
So it shows that data is from rural/ semi-rural area, therefore people save less and consume more. This justifies the estimated statistics.
Similarly to know the perception of the respondents about the financial inclusion questions were asked on five point likert. The majority of the respondents are not aware about the financial inclusion and all the related schemes. When the questions were asked that are you interested to take the business loans at the reasonable rate, majority of the respondents were strongly interested. People are interested in it but they are not given the proper knowledge and advice. so the govt and banks should launch awareness programmes in this area so that the more and more people will get benefit by these schemes.it is also shown in the pie charts below:-
Model Coefficients Standard
error
t statistics P-value R square
Intercept 4460.2597 775.2246299 5.759506257 0.00000164
Available online:https://edupediapublications.org/journals/index.php/IJR/ P a g e | 199 21%
17%
22% 4%
36%
Advice on welfare benefits
Strongly Intrested Intrested
Neutral Not intrested
Strongly disintrested
24%
19%
22% 2%
33%
TAKE OUT A LOAN AT REASONABLE RATE
Strongly Intrested Intrested
Neutral Not intrested
Strongly disintrested
21%
17%
22% 4%
36%
More information about financial matters
Strongly Intrested Intrested
Neutral Not intrested
Strongly disintrested
Perception towards the financial inclusion
20%
25%
19% 7%
29%
Advice about Managing Debts
Strongly Intrested
Intrested
Neutral
Not intrested
Strongly disintrested
21%
45% 12%
16% 6%
Saving Small Amount of Money
Strongly Intrested Intrested
Neutral Not intrested
Strongly disintrested
21%
28% 24%
3%
24%
Taking a Business Loan
Strongly Intrested
Intrested
Neutral
Not intrested
Available online:https://edupediapublications.org/journals/index.php/IJR/ P a g e | 200 From the above pie chart it is clear that
people more people are interested in saving money and A very few number of people are disinterested in saving the money. From the survey of 80 people 21% are strongly interested in saving money and 45% are interested in saving money. Only 15% are not interested in saving money the people who are not saving money are mostly the farmers and the poor people .the people who are saving more money are mostly the businessman and servicemen.
The second pie chat shows the interested of people taking out the loan at the reasonable rates. In this pie chart it is shown that a small number people are interested in taking out loans at reasonable rates. From the survey it is shown that only 24% of the people are strongly interested and 19% are interested in taking out the loans and also 24% are strongly disinterested in taking out the loans from the banks and other sources.
The third pie chart shows the peoples interest about the managing debts. it is clear that more number of people are interested in taking the advices about the managing the debts. From the survey of 80 people 20% are strongly interested and 25 are interested in advices about managing debts only 29 % are not interested in it. If the people are given proper knowledge about the debts and loans. The people will more interest in taking out loans.
The fourth pie chart shows the percentage of people interested in taking out the business loans. It is clear that 45% are interested and 24% are not interested in taking out business loans. the people of the valley are mostly dependent on their own business. So the banks should launch such type of schemes so
the more number of people should get benefit from it. Also bank should give business loans at a reasonable rate of interest
The fifth pie chart shows the people choice in the welfare benefits. From the pie chart it is clear that more than the half of respondents are interested in advices for welfare benefits and only 36% are not interested in the advices. As we know that the most of the people are living in the backward areas and also don’t have any kind of knowledge about the financial schemes. if the peoples are given the advices the more people will get benefit from these financial services .and also it will help in the development of the people .
Available online:https://edupediapublications.org/journals/index.php/IJR/ P a g e | 201
Conclusion
Financial inclusion has, in reality, far reaching positive consequences which can help resource poor people to access the formal financial services in order to pull themselves out of abject poverty. The focus on the common man is particularly imperative in India as he is the more often ignored in the process of economic development. Indeed, with the process of financial inclusion, the attempt should be to lift the resource poor from poverty through coordinated action amongst the banks, the government and other related institutions, in order to facilitate access to bank accounts and other related services. No doubt, a significant progress has already been achieved in the State of Jammu and Kashmir to achieve the wider objective of Inclusive growth through financial inclusion; even the bankers and the government agencies have shown earnestness in implementing the Financial Inclusion Plan in a coordinated manner. But it is also important to keep in mind that the objective behind all such efforts doesn’t get diluted and that Banks operating in the State don’t resort to camouflaging tactics. A lot has already been done but a lot is yet to be achieved, so bankers need to keep reforming their plans and ensure that the poor are not left to the clutches of informal sources of finance. From the data analysis it is clear that there is a significant increase in the CASA account holders and the amount in these accounts, but for the period 2001-2015 there was a sharp decrease in both the number and amount in these accounts. The term deposits account reflects that, although there is a sharp increase in number of account holders but the amount fall. The saving motive is a very low
in this area, because people are mostly living in the rural and backward areas, also people are illiterate and are not aware about the financial services. In my survey it was also found that there is a gender discrimination in this area because the female respondents are earning less as compared to the male respondents and also the business class and govt. employees have high income then the farmers. so we say income is dependent on the occupation also. The regressions results reveal that marginal propensity to save is very low because people save less and consume more.
The bank should conduct the financial awareness programme there. So the people should get aware about it is benefits. It must be noted that access to a bank account does not necessarily mean usage of the account. The level of awareness about the features and benefits of bank account and banking services are comparatively low. Bank must take step to increase the awareness among people about all schemes and services provided by them. To induce saving habit among BPL households it will lead to continuous usage of bank account. All this will lead to achieving financial inclusion system in effectively for the growth of our economy.
Reference:
[1] Rangarajan Committee (2008),
“Report of the Committee on Financial Inclusion”, The IUP Journal of Financial
Economics, Vol. IX, Issue No. 2
[2] Mandira Sharma and Jesim Pais.
(2008). Financial Inclusion and
Available online:https://edupediapublications.org/journals/index.php/IJR/ P a g e | 202 Indian Council for Research on International
Economic Relations, pp 1-28.
[3] Michael Chibba. 2009. Financial Inclusion, Poverty Reduction and the millennium Development Goals, European Journal of Development Research Vol. 21,
[4] Joseph Massey (2010), “Role of Financial Institutions in Financial Inclusion”, FICCI’s Banking & Finance
Journal, Volume no.2 Issue No. 4.
[5] Report of the Committee on
Financial Inclusion in India (Chairman: C. Rangarajan) (2008), Government of India.
[6] CRISIL (2013), “Inclusix Financial
Inclusion Index”, June.
[7] RBI (2014a), “Report on
comprehensive financial services for small businesses and low Income households”