Electronic Thesis and Dissertation Repository
4-19-2013 12:00 AM
Particle Fluidization in Upward and Inverse Liquid-Solid
Particle Fluidization in Upward and Inverse Liquid-Solid
Circulating Fluidized Bed
Circulating Fluidized Bed
Long Sang
The University of Western Ontario
Supervisor Dr. Jesse Zhu
The University of Western Ontario
Graduate Program in Chemical and Biochemical Engineering
A thesis submitted in partial fulfillment of the requirements for the degree in Doctor of Philosophy
© Long Sang 2013
Follow this and additional works at: https://ir.lib.uwo.ca/etd
Part of the Chemical Engineering Commons
Recommended Citation Recommended Citation
Sang, Long, "Particle Fluidization in Upward and Inverse Liquid-Solid Circulating Fluidized Bed" (2013). Electronic Thesis and Dissertation Repository. 1218.
https://ir.lib.uwo.ca/etd/1218
This Dissertation/Thesis is brought to you for free and open access by Scholarship@Western. It has been accepted for inclusion in Electronic Thesis and Dissertation Repository by an authorized administrator of
(Thesis format: Integrated Article)
by
Long Sang
Graduate Program in Chemical and Biochemical Engineering
A thesis submitted in partial fulfillment of the requirements for the degree of
Doctor of Philosophy
The School of Graduate and Postdoctoral Studies The University of Western Ontario
London, Ontario, Canada
ii
Abstract
The fluidization of particles in upwards and inverse Liquid-Solid Circulating Fluidized Bed is carried out to investigate the hydrodynamic characteristics when using “heavy” and “light” particles, whose densities are higher and lower than that of the surrounding liquid respectively. Generally, the solids are fluidized upwards in the former case, whereas, the downwards fluidization is preferred in the latter scenario.
In the Liquid-Solid Circulating Fluidized Bed (LSCFB) riser, where the upwards fluidization takes place, the effects of particle properties on solids holdup are investigated experimentally based on three parameters: superficial liquid velocity, normalized superficial liquid velocity and excess superficial liquid velocity. The results show that the excess superficial liquid velocity (Ul-Ut), among those three parameters, is a more appropriate parameter to evaluate
the effects of the particle properties on the solids holdup, facilitating general comparisons for different types of particles. Then such particle property effects are studied analytically by incorporating operating parameters and particle properties into a mathematical model, showing excellent agreement with the experimental results. By this model, the transition velocity demarcating the circulating fluidization regime and the transport regime is determined to complete the flow regime map in liquid-solid fluidization systems.
In the Inverse Liquid-Solid Circulating Fluidized Bed (ILSCFB) downer, where the inverse
iii
terminal velocity and one-dimensional slip velocity deduced from the superficial liquid, solids velocities and cross-sectional average solids holdup, suggesting that there is no obvious clustering phenomenon and solids segregation in ILSCFB downer under various operating conditions.
The hydrodynamics under the inverse conventional fluidization regime are also studied by examining the bed voidage and dimensionless bed expansion. A new mathematical model correlating Archimedes and Reynolds number is proposed for the prediction of the bed voidage and dimensionless bed expansion in both inverse and upwards liquid-solid fluidization system, exhibiting better accuracy than that of the well known Richardson and Zaki equation.
The comparisons of the hydrodynamics in ILSCFB and LSCFB are also made based on the force balance discussion, enabling the comparison of inverse and upwards circulating fluidization of particles. Then the generalized flow regime map is developed in terms of dimensionless superficial velocity and dimensionless particle size by determining the demarcations of different flow regimes quantitatively.
Keywords
iv
Co-Authorship Statement
Title: Experimental Investigation of the Effects of Particle Properties on Solids Holdup in an LSCFB Riser
Author: Long Sang, Jesse Zhu
Long Sang designed and performed the major part of the experiment and carried out data analysis under the guidance of advisor Dr. Jesse Zhu. All drafts of this manuscript were written by Long Sang. Modifications were carried out under close supervision of advisor Dr. J. Zhu. The final version of this article was published in
Chemical Engineering Journal, 197 (2012) 322–329
Title: Prediction of Average Solids Holdup and Slip Velocity in Liquid-Solid Circulating Fluidized Bed Riser
Author: Long Sang, Jesse Zhu
Long Sang designed and performed the major part of the experiment and carried out data analysis under the guidance of advisor Dr. Jesse Zhu. All drafts of this manuscript were written by Long Sang. Modifications were carried out under close supervision of advisor Dr. J. Zhu. The final version of this article is ready for submission.
Title: Generalized Fluidization in Inverse and Upwards Liquid-Solid Fluidized Bed
Author: Long Sang, Jesse Zhu
The experimental setup of Inverse Liquid-Solid Circulating Fluidized Bed was designed and modified by Long Sang together with Jianzhang Wen under the guidance of advisor Dr. J. Zhu. All the experimental work was undertaken by Long Sang. All drafts of this manuscript were written by Long Sang. Modifications were carried out under close supervision of advisor Dr. J. Zhu. The final version of this article is ready for submission.
Title: Hydrodynamics in Inverse Liquid-Solid Circulating Fluidized Bed Downer
v
The experimental setup of Inverse Liquid-Solid Circulating Fluidized Bed was designed and modified by Long Sang together with Jianzhang Wen under the guidance of advisor Dr. J. Zhu. All the experimental work was undertaken by Long Sang. All drafts of this manuscript were written by Long Sang. Modifications were carried out under close supervision of advisor Dr. J. Zhu. The final version of this
article is ready for submission.
Title: Local Slip Velocity Behavior in Inverse Liquid-Solid Circulating Fluidized Bed Downer
Author: Long Sang, Jesse Zhu
The experimental setup of Inverse Liquid-Solid Circulating Fluidized Bed was designed and modified by Long Sang together with Jianzhang Wen under the guidance of advisor Dr. J. Zhu. All the experimental work was undertaken by Long Sang. All drafts of this manuscript were written by Long Sang. Modifications were carried out under close supervision of advisor Dr. J. Zhu. The final version of this article is ready for submission.
Title: Advances in (Gas)-Liquid-Solid Circulating Fluidized Bed- A Comprehensive Review
Author: Long Sang, Jesse Zhu
vi
Acknowledgments
I would like to take this opportunity to express the gratitude and appreciation to those who have always been helping and supporting me in the academic and daily life.
My sincerest thank to my Supervisor Dr. Zhu, for believing in my potential, supporting me not only on research but also on daily life during my whole period of Ph.D. study, and setting a role model for me, which ensured my successful fulfillment of this study.
Much appreciation is extended to Dr. D. Karamanev and Dr. Hui Zhang for their helpful discussion and encouragement.
My gratefulness is directed to Mr. Jianzhang Wen for being a good friend beyond age and his
help designing and constructing the experimental equipment. Many thanks go to Mr. Michael
Zhu for his help addressing the electrical issues during the experiments.
Thanks are also extended to my friends in the research group, Ying Ma, Quan He, Jing Xu,
Yuanyuan Shao, Qing Mu, Liqiang Zhang, Jing Fu, Tang Li, Yong Liu, Tracy Wang and Shan
Gao, for their help, advice and friendship.
Many thanks to George Zhang, Kara Malott, Kristen Hunt for their service.
The financial assistance from National Science of Engineering Foundation of Canada and the
Western Engineering Scholarship is gratefully acknowledged.
Great gratitude is to my parents. Without their consistent and unreserved support, I could not have done this mission thus far a success.
vii
Table of Contents
Abstract ... ii
Co-Authorship Statement... iv
Acknowledgments... vi
Table of Contents... vii
List of Tables ... xi
List of Figures ... xii
Chapter 1... 1
1 General Introduction ... 1
1.1 Introduction... 1
1.2 Objectives ... 2
1.3 Thesis structure ... 3
References ... 6
Chapter 2... 8
2 Literature Review... 8
2.1 Hydrodynamics in Liquid-Solid Circulating Fluidized Bed... 9
2.1.1 Flow regimes... 9
2.1.2 Axial solids holdup distribution... 12
2.1.3 Radial solids holdup distribution ... 13
2.1.4 Liquid velocity ... 13
2.1.5 Particle velocity ... 14
2.1.6 Slip velocity ... 15
2.1.7 Modeling ... 15
2.2 Hydrodynamics in conventional inverse fluidized bed... 17
2.3 Hydrodynamics in inverse circulating fluidized bed ... 19
References ... 20
Chapter 3... 24
3 Experimental Apparatus and Measurement Methods ... 24
3.1 The structure of LSCFB and ILSCFB ... 25
3.1.1 Upwards LSCFB... 25
3.1.2 Downwards ILSCFB... 28
viii
3.2.1 Measurement of average solids concentration... 30
3.2.2 Measurement of local solids concentration... 31
3.2.3 Measurement of local particle velocity... 33
3.2.4 Measurement of local liquid velocity ... 34
3.2.5 Measurement of superficial solids velocity ... 35
3.3 Particle properties ... 35
References ... 37
Chapter 4... 38
4 Experimental Investigation of the Effects of Particle Properties on Solids Holdup in an LSCFB Riser ... 38
4.1 Introduction... 38
4.2 Materials and methods ... 41
4.3 Superficial solids velocity Us and its control ... 43
4.4 The effects of particle properties on the hydrodynamics in LSCFB riser ... 45
4.4.1 The effect of the particle density ... 46
4.4.2 The effect of the particle size... 57
4.4.3 The generalized effects of particle properties ... 59
4.5 Conclusions... 60
Nomenclature ... 62
References ... 64
Chapter 5... 66
5 Prediction of Average Solids Holdup and Slip Velocity in LSCFB Riser... 66
5.1 Introduction... 66
5.2 Materials and methods ... 69
5.3 The control of superficial solids velocity Us... 71
5.4 Average solids holdups ... 73
5.5 Analytical model and discussion ... 73
5.6 The effects particle property on solids holdup by model prediction ... 79
5.6.1 The effects of the particle density on solids holdup by model prediction ... 79
5.6.2 The effects of the particle size on solids holdup by model prediction... 82
5.6.3 The effects of the particle sphericity on solids holdup by model prediction ... 85
ix
5.8 Conclusions... 89
Nomenclature ... 90
References ... 92
Chapter 6... 94
6 Comparisons of Fluidization in Inverse and Upwards Liquid-Solid Fluidized Bed.... 94
6.1 Introduction... 94
6.2 Materials and methods ... 96
6.3 The conventional inverse fluidization regime... 100
6.4 Mathematical model for bed expansion ... 101
6.5 Prediction of bed voidage in the inverse and upwards liquid-solid conventional fluidization system ... 107
6.6 Prediction of dimensionless bed expansion in the inverse liquid-solid fluidization system ... 110
6.7 Conclusions... 112
Nomenclature ... 113
References ... 115
Chapter 7... 118
7 Hydrodynamics in Inverse Liquid-Solid Circulating Fluidized Bed Downer ... 118
7.1 Introduction... 118
7.2 Materials and methods ... 120
7.3 The operation of ILSCFB ... 123
7.3.1 Flow regimes... 123
7.3.2 The control of superficial solids velocity Us... 124
7.4 The hydrodynamics in the ILSCFB ... 127
7.4.1 The variations of average solids holdup ... 127
7.4.2 Axial solids holdup distribution... 130
7.4.3 Radial solids holdup distribution ... 133
7.5 Comparisons of ILSCFB and LSCFB... 135
7.5.1 Average solids holdup... 135
7.5.2 Local solids holdup ... 137
7.6 Generalized flow regime map ... 138
7.6.1 Determination of Umf... 140
7.6.2 Determination of Ut... 140
x
7.7 Conclusions... 141
Nomenclature ... 143
References ... 145
Chapter 8... 147
8 Local Particle and Liquid Velocities in Inverse Liquid-Solid Circulating Fluidized Bed Downer ... 147
8.1 Introduction... 147
8.2 Materials and methods ... 148
8.3 Solids holdup distribution in ILSCFB downer ... 152
8.4 Axial and radial distributions of local particle velocity... 154
8.5 Radial distribution of local liquid velocity ... 158
8.6 Radial distribution of local slip velocity... 163
8.7 Conclusions... 165
Nomenclature ... 167
References ... 169
Chapter 9... 171
9 Conclusions and Recommendations ... 171
9.1 Conclusions... 171
9.2 Recommendations... 174
Appendices... 175
A1 An example of error bars for solid holdup, liquid velocity and particle velocity measurements... 175
B1 Superficial solids velocity (Us) in LSCFB and ILSCFB ... 177
B2 Local and average solids holdup in LSCFB ... 181
B3 Local solids holdup in ILSCFB ... 187
B4 Local particle velocity in ILSCFB... 191
B5 Local liquid velocity in ILSCFB... 194
B6 Bed voidage and bed expansion under the conventional fluidization regime in inverse liquid-solid fluidized bed ... 196
xi
List of Tables
Table 2.1Tabulation of different studies conducted earlier on inversed fluidization ... 19
Table 3.1Comparison of LSCFB and ILSCFB structure ... 25
Table 3.2Measurement methods for different parameters ... 30
Table 3.3Measurement positions on axial and radial directions... 31
Table 3.4Physical properties of particles used in LSCFB ... 36
Table 3.5Physical properties of particles used in ILSCFB ... 36
Table 4.1Riser dimensions and particle physical properties used in Zheng et. al. (1999, 2002) and current study ... 40
Table 5.1Riser dimensions and physical properties of particles used in existing literature and current work... 68
Table 5.2The comparison of the Ucv determined by Eq. (5.9) with the experimental results reported by Zheng et. al. (1999, 2002) ... 88
Table 6.1Summary of particle properties used in this study and previously published works in inverse fluidization systems ... 98
Table 6.2Summary of particle properties used in previously published works in upwards fluidization systems ... 99
xii
List of Figures
Fig. 2.1 Flow regimes and flow regime map... 10
Fig. 2.2 Solids holdup at different positions of the riser for 4 types of particles in same size but different density... 12
Fig. 3.1 The schematic structure of LSCFB and ILSCFB. ... 24
Fig. 3.2 The schematic diagram of LSCFB apparatus. ... 26
Fig. 3.3 The schematic diagram of ILSCFB apparatus. ... 28
Fig. 3.4 The schematic diagram of solids holdup and particle velocity measurement with optical fiber probe... 31
Fig. 3.5 The typical calibration curve for the optical fiber probe. ... 32
Fig. 3.6 Schematic of local liquid velocity measurement ... 34
Fig. 4.1 The schematic diagram of LSCFB apparatus. ... 41
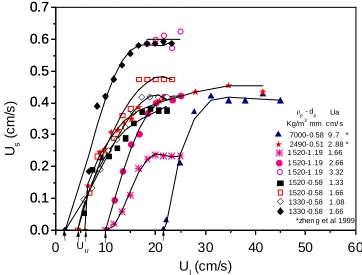
Fig. 4.2 The superficial solids velocity (Us) as a function of combined superficial liquid velocity (Ul) for 5 types of particles under different auxiliary liquid velocity (Ua)... 44
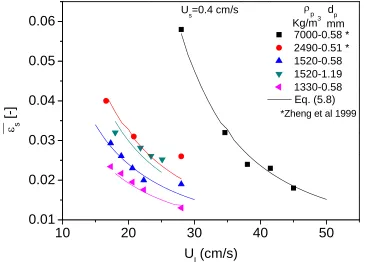
Fig. 4.3 The average solids holdup of 5 types of particles against the superficial liquid velocity under Us=0.4 cm/s. ... 47
Fig. 4.4 The effect of the particle density on (a) the average solids holdup (s) based on the superficial liquid velocity (Ul) and (b) the corresponding local solids holdup across the radial position for 3 types of particles under Us=0.4 cm/s and Ul=28 cm/s... 48
Fig. 4.5 The average solids holdup (s) of 5 types of particles against the normalized superficial liquid velocity (Ul/Ut) under Us=0.4 cm/s... 50
Fig. 4.6 The effect of the particle density on (a) the average solids holdup (s) based on the normalized superficial liquid velocity (Ul/Ut) and (b) the corresponding local solids holdup across the radial position when Us=0.4 cm/s and Ul/Ut=5... 51
Fig. 4.7 The effect of particle density on (a) the average solids holdup (s) based on the excess superficial liquid velocity (Ul-Ut) and (b) the corresponding local solids holdup across the radial position under different Us... 53
Fig. 4.8 The average particle velocity (VP) calculated from Eq. (4.4) vs. the excess superficial liquid velocity (Ul-Ut) for different types of particles from Zheng et. al. (1999) and current study. ... 56
xiii
Fig. 4.10 The average solids holdup (s) versus (a) the superficial liquid velocity (Ul) and (b) the excess superficial liquid velocity (Ul-Ut) for 2 types of
particles when Us=0.4 cm/s... 58
Fig. 4.11 Comparison of the predicted average solids holdup from Eq. (4.5) with the experimental data from the study of Zheng et. al. (1999) and current study. ... 60
Fig. 5.1 The schematic diagram of LSCFB apparatus. ... 69
Fig. 5.2 The superficial solids velocity (Us) as a function of combined superficial liquid velocity (Ul) for 5 types of particles under different auxiliary liquid velocity (Ua)... 71
Fig. 5.3 The experimental and predicted average solids holdups of 5 types of particles against the superficial liquid velocity under Us=0.4 cm/s... 73
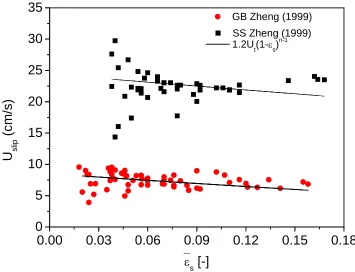
Fig. 5.4 Predicted slip velocity as a function of the solids holdup of glassbeads and steel shots by Zheng et. al. (1999)... 77
Fig. 5.5 Comparisons of average slip velocities by different definitions... 77
Fig. 5.6 Comparison of predicted average solids holdup with experimental results. ... 79
Fig. 5.7 The effects of the particle density on the average solids holdup (s) based on (a) Ul; (b) Ul/Ut; (c) Ul-Ut. ... 81
Fig. 5.8 The effects of the particle size on the average solids holdup (s) based on (a) Ul; (b) Ul/Ut; (c) Ul-Ut. ... 83
Fig. 5.9 The average solids holdup against the average particle velocity. ... 84
Fig. 5.10 The effects of particle sphericity on the average solids holdup (s) based on (a) Ul, (b) Ul/Utand (c) Ul-Ut... 86
Fig. 5.11 Completed flow regime map for LSCFB... 89
Fig. 6.1 The schematic diagram of the ILSFB apparatus... 96
Fig. 6.2 Flow regimes in ILSCFB with increasing of superficial liquid velocity. ... 100
Fig. 6.3 The fitting of 3CDRe2/(4Ar) as a function of the bed voidage. ... 104
Fig. 6.4 The bed expansion index (n) as a function of (a) Ar and (b) Re number... 106
Fig. 6.5 The bed voidage as a function of the superficial liquid velocity (Ul) in (a) inverse and (b) upwards fluidization systems. ... 108
Fig. 6.6 The predicted bed voidage against the experimental results based on (a) Eq. (6.11), (b) Richardson and Zaki Equation. ... 109
Fig. 6.7 The dimensionless bed expansion as a function of superficial liquid velocity (Ul) under different initial bed height for 3 different types of particles. ... 110
Fig. 6.8 The comparisons of predicted dimensionless bed expansion (HT/H0) by this work and the experimental results... 111
xiv
Fig. 7.2 The variation of the axial average solids holdup distribution under the
conventional and circulating fluidization regimes for SF46-0.8. ... 124 Fig. 7.3 The superficial solids velocity (Us) as a function of combined superficial
liquid velocity (Ul) for (a) SF46-0.8 and (b) HGB790-2.5 under different
auxiliary liquid velocity (Ua). ... 126
Fig. 7.4 The average solids holdups (s) against the superficial liquid velocity (Ul)
under various superficial solids velocities (Us) for (a) SF46-0.8 and (b)
HGB790-2.5... 128
Fig. 7.5 The average solids holdups (s) against the superficial solids velocity (Us)
under various superficial liquid velocities (Ul) for (a) SF46-0.8 and (b)
HGB790-2.5... 129 Fig. 7.6 The variations of the axial solids holdup for the SF46-0.8 under various
superficial liquid velocity when (a) Us=0.9 cm/s and (b) Us =1.2 cm/s. ... 131
Fig. 7.7 The variations of the axial solids holdup for the HGB790-2.5 under various superficial liquid velocity when (a) Us=0.35 cm/s and (b) Us =0.8
cm/s. ... 132 Fig. 7.8 Local solids holdup distribution radial positions under various superficial
liquid velocity (Ul) when (a) Us=0.9 cm/s and (b) Us=1.2 cm/s. ... 134
Fig. 7.9 Local liquid velocity distribution at different dimensionless radial
positions under various superficial liquid velocity (Ul) when Us=0.9 cm/s. ... 135
Fig. 7.10 Comparisons of the predicted average solids holdup from Eq. (7.7) valid
for LSCFB with the experimental data in ILSCFB. ... 137 Fig. 7.11 Comparisons of local solids holdup in ILSCFB and LSCFB. ... 138 Fig. 7.12 Generalized flow regime map for both inverse and upwards fluidization
systems... 139 Fig. 8.1 The schematic diagram of ILSCFB apparatus. ... 148 Fig. 8.2 The superficial solids velocity (Us) as a function of combined superficial
liquid velocity (Ul) and the auxiliary liquid velocity (Ua). ... 150
Fig. 8.3 Solids holdup distributions (a) axial and (b) radial when Us=0.9 cm/s. ... 153
Fig. 8.4 Particle velocity distribution in (a) axial direction, (b) radial positions when Us=0.9 cm/s, (c) radial positions when Ul=27 cm/s but various
superficial solids velocities. ... 156
Fig. 8.5 Average particle velocity (Vp) as a function of superficial liquid velocity
(Ul) under different superficial solids velocity (Us)... 157
Fig. 8.6 Comparisons of measured and calculated superficial solids velocity based
on local particle velocity... 158 Fig. 8.7 Local liquid velocity distribution across the radial positions under various
operating conditions (a) single phase flow (b) Us=0.9 cm/s
xv
Fig. 8.8 The comparisons of measured and calculated superficial liquid velocity
(Ul) based on local liquid velocity (Vl). ... 162
Fig. 8.9 Local slip velocity (Uslip) across the radial positions for Us=0.9 cm/s under
various superficial liquid velocity... 163 Fig. 8.10 Comparisons of slip velocity under different definitions. ... 165 Fig. A.1 Error bars for (a) solid holdup; (b) liquid velocity; (c) particle velocity. ... 176
Chapter 1
1
General Introduction
1.1 Introduction
Liquid-Solid Circulating Fluidized Beds (LSCFBs) are gaining in popularity for their wide range of potential applications because of their many advantages including significantly high mass and heat transfer rates, improved liquid-solid contact efficiency, easy control of large quantity of particles etc (Zhu et al. 2000). The design, scale up and operation of such liquid-solid continuous systems require information of phase holdup and flow patterns referred to as the hydrodynamic characteristics. Intensive studies have been carried out to investigate the axial and radial solids holdup distributions (Liang et al. 1996; Liang et al. 1997; Zheng et al. 1999; Zheng et al. 2002), local liquid velocity profiles (Liang et al. 1996; Zheng 1999), slip velocity behaviors (Natarajan et al. 2011).
In the above mentioned LSCFBs, solids are fluidized upwards as their densities are larger than that of the surrounding liquid. Whereas, when the density of the solids is lower than that of the surrounding liquid, the downwards fluidization is necessary, referred to as the
inverse fluidized bed airlift reactor (Kawalec-Pietrenko 2000). Some other characteristics such as heat transfer (Cho et al. 2002; Lu et al. 2006) and mass transfer (Nikolov and Nikov 1994) were also studied.
A detailed literature review on previous hydrodynamic studies in LSCFB and
conventional inverse fluidized bed as presented in Chapter 2, reveals the following issues all of which are addressed in this study:
1. Although the effects of the particle properties have been studied, more comprehensive understandings on such effects are still needed.
2. While in an effort to develop the mathematical models to predict the average solids holdup under the circulating fluidization regime, a more sophisticated model that incorporates particle properties is still necessary.
3. All research on the inverse fluidization only focused on conventional fluidization regime. No research work has ever been conducted to study the hydrodynamics under the circulating fluidization regime in the inverse fluidization systems.
4. No research work has been carried out to generalize the fluidization in both inverse and upwards liquid-solid circulating fluidized bed.
1.2 Objectives
In order to further enhance the understanding of the circulating fluidization, the effects of particles are investigated in the upwards LSCFB:
1. Investigate the effects of the particle density, size and sphericity on the hydrodynamics in LSCFB based on three parameters: superficial liquid velocity, normalized superficial liquid velocity and excess superficial liquid velocity.
To combine the benefits of both inverse fluidization and the concept of circulating fluidization, a new type of liquid-solid circulating fluidized bed, which is called Inverse Liquid-Solid Circulating Fluidized Bed (ILSCFB), should be developed.
1. Design and install a new type of inverse fluidized bed that is able to fluidize and
circulate the particles continuously inside the inverse fluidized bed when the fluidization velocity is larger than the particle terminal velocity.
2. Conduct a comprehensive study on the hydrodynamics of ILSCFB, including the axial/radial solids holdup profile, local liquid velocity, local particle velocity and slip velocity in the downer under a wide range of operating conditions.
3. Propose a flow regimes map for ILSCFBs in terms of dimensionless particle diameter vs. dimensionless liquid velocity.
4. Compare the fluidization in both ILSCFB and LSCFB by proposing analytical mathematical expressions under different fluidization regimes.
1.3 Thesis
structure
This thesis follow the “integrated article” format as outlined in UWO Thesis Guide.
Chapter 1 is a general introduction followed by detailed literature review in Chapter 2.
Chapter 3 provides the details about the experimental apparatus, including the structures of LSCFB and ILSCFB, the measurement techniques and experimental procedures in this study. The information on the particles used in this study is also provided.
Chapter 4 and Chapter 5 reports the experimental studies in the upwards LSCFB system.
and the excess superficial liquid velocity. A straightforward mathematical expression is also proposed based on the force balance analysis.
Chapter 5 further studies the effects of particle properties (density, size and sphericity) on solids holdup and slip velocity in the LSCFB riser through analytical model. The
proposed model incorporates slip velocity, operational parameters and particle properties to predict average solids holdup under the circulating fluidization regime. This model is valid for a wide range of riser dimensions and particle properties with adequate accuracy (>80%) so that it enables the quantitative investigation of the effects of particle properties on average solids holdup and average particle slip velocity. By this model, the transition velocity demarcating the circulating fluidization regime and the transport regime is determined to complete the flow regime map in the liquid-solid fluidization system.
Chapter 6, 7 and 8 report the experimental studies in inverse conventional fluidization and circulating fluidization, respectively.
Chapter 6 reports the experimental results on the bed voidage and dimensionless bed expansion under the inverse conventional fluidization regime. New mathematical equations for the prediction of the bed voidage and dimensionless bed expansion are proposed based on force balance of particle in terms of Archimedes number and Reynolds number for both inverse and upwards liquid-solid fluidization systems.
Chapter 7 presents the hydrodynamic characteristics in the downer of an Inverse Liquid-Solid Circulating Fluidized Bed (ILSCFB) by fluidization of Styrofoam and Hollow Glassbeads whose densities are lower than that of fluidization media. For both types of particles, the axial and radial solids holdup distribution is discussed and the comparisons of the hydrodynamics in ILSCFB and LSCFB are also made based on the force balance
velocity and dimensionless particle size by quantitatively determining the demarcations of different flow regimes.
Chapter 8 reports the local particle and liquid velocities in the downer of an Inverse Liquid-Solid Circulating Fluidized Bed (ILSCFB). The radial profiles of particle velocity,
liquid velocity and slip velocity under various operating conditions are presented. The local slip velocities derived from local particle and liquid velocities are also compared with the single particle terminal velocity and the one-dimensional slip velocity deduced from the superficial liquid and solids velocities and cross-sectional average solids holdup.
References
Cho, Y. J., H. Y. Park, S. W. Kim, Y. Kang and S. D. Kim (2002). Heat transfer and hydrodynamics in two- and three-phase inverse fluidized beds. Industrial and Engineering Chemistry Research 41(8): 2058-2063.
Dewsbury, K. H., D. G. Karamanev and A. Margaritis (2000). Dynamic behavior of freely rising buoyant solid spheres in non-newtonian liquids. AIChE Journal 46(1): 46-51.
Escudie, R., N. Epstein, J. R. Grace and H. T. Bi (2007). Layer inversion and bed contraction in down-flow binary-solid liquid-fluidized beds. Canadian Journal of Chemical Engineering 85(1): 25-35.
Howley, M. A. and B. J. Glasser (2004). A comparison of one-dimensional traveling waves in inverse and normal fluidized beds, Austin, TX, United states, American Institute of Chemical Engineers.
Karamanev, D. G. and L. N. Nikolov (1992). Bed Expansion of Liquid-Solid Inverse Fluidization. Aiche Journal 38(12): 1916-1922.
Karamanev, D. G. and L. N. Nikolov (1996). Application of inverse fluidization in wastewater treatment: From laboratory to full-scale bioreactors. Environmental Progress 15(3): 194-196.
Kawalec-Pietrenko, B. (2000). Liquid circulation velocity in the inverse fluidized bed airlift reactor. Bioprocess and Biosystems Engineering 23(4): 397-402.
Liang, W., S. Zhang, J.-X. Zhu, Y. Jin, Z. Yu and Z. Wang (1997). Flow characteristics of the liquid-solid circulating fluidized bed. Powder Technology 90(2): 95-102.
Liang, W. G., J. X. Zhu, Y. Jin, Z. Q. Yu, Z. W. Wang and J. Zhou (1996). Radial nonuniformity of flow structure in a liquid-solid circulating fluidized bed. Chemical Engineering Science 51(10 pt A): 2001-2010.
Lu, P., Y. Cao, A. Wu and W.-P. Pan (2006). Experimental study of heat transfer in a horizontal swirling fluidized bed, Pittsburgh, PA, United states, International Pittsburgh Coal Conference.
Nikolov, L. and D. Karamanev (1987). Experimental Study of the Inverse Fluidized Bed Biofilm Reactor. Canadian Journal of Chemical Engineering 65(2): 214-217.
Nikolov, V. R. and I. Nikov (1994). Liquid-solid mass transfer in three-phase inverse fluidized bed (TPIFB). Hungarian Journal of Industrial Chemistry 22(2): 125-128.
Renganathan, T. and K. Krishnaiah (2003). Prediction of minimum fluidization velocity in two and three phase inverse fluidized beds. Canadian Journal of Chemical Engineering 81(3-4): 853-860.
Renganathan, T. and K. Krishnaiah (2005). Voidage characteristics and prediction of bed expansion in liquid-solid inverse fluidized bed. Chemical Engineering Science 60(10): 2545-2555.
Ulaganathan, N. and K. Krishnaiah (1996). Hydrodynamic characteristics of two-phase inverse fluidized bed. Bioprocess and Biosystems Engineering 15(3): 159-164.
Vijaya, L. A. C., M. Balamurugan, M. Sivakumar, S. T. Newton and M. Velan (2000). Minimum fluidization velocity and friction factor in a liquid-solid inverse fluidized bed reactor. Bioprocess and Biosystems Engineering 22(5): 461-466.
Zheng, Y. (1999). Flow Structure in a Liquid Solid Circulating Fluidized Bed. Chemical and Biochemical Engineering. London, University of Western Ontario. Ph.D.
Zheng, Y., J.-X. Zhu, N. S. Marwaha and A. S. Bassi (2002). Radial solids flow structure in a liquid-solids circulating fluidized bed. Chemical Engineering Journal 88(1-3): 141-150.
Zheng, Y., J.-X. Zhu, J. Wen, S. A. Martin, A. S. Bassi and A. Margaritis (1999). The axial hydrodynamic behavior in a liquid-solid circulating fluidized bed. Canadian Journal of Chemical Engineering 77(Compendex): 284-290.
Chapter 2
2
Literature Review
The hydrodynamic studies in the liquid-solid circulating fluidization systems have popularities due to a number of attractive features of the LSCFB, such as significantly high mass and heat transfer rates, improved liquid-solid contact efficiency, easy control of large quantity of particles etc. (Zhu et al. 2000), enabling Liquid-Solid Circulating Fluidized Beds (LSCFBs) to have a wide range of potential applications, such as ion exchange system for the continuous recovery protein from cheese whey (Lan et al. 2000),
2.1 Hydrodynamics in Liquid-Solid Circulating Fluidized
Bed
2.1.1 Flow regimes
The flow regimes in liquid-solid systems are dependent on the liquid flow rate. With increasing liquid flow rate, defined by superficial liquid velocity (Ul), the liquid-solid
system experiences several flow regimes as shown in Fig. 2.1a. When the superficial liquid velocity (Ul) is lower than the minimum fluidization velocity (Umf), the bed is in
the fixed bed regime. Increasing the superficial liquid velocity (Ul) beyond the minimum
fluidization velocity (Umf), the liquid-solid system enters the conventional fluidization
Fix bed Conventional fluidization
Circulating fluidization
Transport fluidization
Umf<Ul<Ucr Ucr<Ul<Ucv Ul>Ucv
Riser
Ul<Umf
Increase Ul
(a)
1 0.1
1 10 100
U*cv
U*cf
U*mf
Transport regime
Circulating fluidization regime
Conventional fluidization regime
U l
*
dp*
Fixed bed regime
1 10 100
(b)
As shown in Fig. 2.1b, the transitions of those flow regimes could be determined by the flow regime map (Liang et. al., 1997; Zheng and Zhu, 1999) in terms of dimensionless superficial velocity and dimensionless particle size which are defined as
1/3
* 2 1/3
/ ( ) /
l l l
U U g Re Ar and dp* dp
sg / 2
1/3 Ar1/3 (Grace 1986)respectively. The fixed bed flow regime and the conventional fluidization regime are demarcated by the minimum fluidization velocity (Umf). For the minimum transition
velocity (Ucf) demarcating the conventional fluidization regime and the circulating
fluidization regime, Liang et. al. (Liang et al. 1993) found that such transition velocity is only 0.6 times of the particle terminal velocity. Later on, Zheng and Zhu (1999), reported that this transition velocity (Ucf) is about 1.1~1.2 times of the particle terminal
velocity (Ut). The latter reports seem to be more reasonable because they measured such
transition velocity is determined by the emptying bed method and independent of operating conditions such as the solids inventory and the feeding system. For the transition velocity (Ucv) from the circulating fluidization regime to the transport regime,
Liang et. al. (1997) reported that Ucv is related to both the liquid velocity and the solids
2.1.2 Axial solids holdup distribution
0.00 0.03 0.06 0.09 0.12 0.15 0.18 0.21 0.24
0.0
0.2
0.4
0.6
0.8
1.0
GB-2490-0.51* 11 7.1 SS-7000-0.58* 26 21
PB-1520-0.58 11 3.4 PB-1330-0.58 11 2.5
x/H
s
[-]
Us=0.22 cm/s
* Zheng et. al. (1999)
Ut(cm/s)
p (kg/m3) dp (mm)
SS-7000-0.58* 34.6 21
Ul (cm/s)
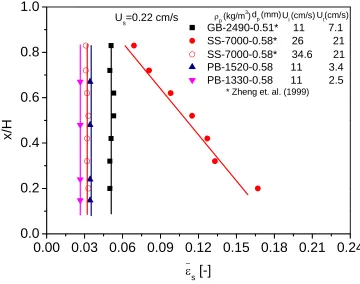
Fig. 2.2 Solids holdup at different positions of the riser for 4 types of particles in same size but different density.
The axial solids holdup distribution in the terms of dimensionless height vs. average
solids holdup (s) is plotted in Fig. 2.2 under similar superficial liquid velocity (Ul) and
superficial solids velocity (Us). It is shown that the axial profiles for the lighter particles
(Glassbeads and plastic beads) are uniform in the entire riser (Zheng et. al., 1999). However, for the heavy particles (steel shot), the axial distribution of solid holdups is not uniform, denser at riser bottom while diluter at riser top, even when Ul=26 cm/s
(Ut=21 cm/s). This non-uniformity could be eliminated by further increasing the liquid
2.1.3 Radial solids holdup distribution
Zheng et. al. (2002) measured the local solids holdup at 7 radial positions and 4 axial locations of LSCFB riser. The radial distribution of solids holdup in LSCFB riser is non-uniform at lower liquid velocity: dilute in the center and denser near the riser wall. This
non-uniformity pattern is also observed at four different heights. Meanwhile, for a given liquid velocity, both the radial non-uniformity and the average solids holdup increase with increasing solids circulation rate (in term of the superficial solids velocity Us). By
further increasing the liquid velocity, the radial non-uniformity decreases significantly. This is because the flow regime has transited from the circulating fluidization regime to the dilute transport regime (Liang et. al., 1997). The radial non-uniformity is also related to the particle density (Zheng et. al., 1999).
The non-uniform distribution of the solid holdup actually can be quantified by introducing the concepts of Standard Deviation and Intermittency Index (Brereton and Grace, 1993), which is classified into the micro flow structures (Zhu et. al., 2000). For both parameters, higher values appear in the wall region. With an increase to the solids circulation rate, the magnitudes of the both parameters also increase. This indicates that fluctuations in the solids movement become more vigorous in the wall region and at higher particle circulation rate, due to the increase in solids holdup in both cases. Although the both parameters can be employed as an indicator of the non-uniform distribution of the solids holdup, Standard Deviation is not easily interpreted because the time-mean density varies from point to point; whereas the intermittency Index is a normalized standard deviation, so that it is more meaningful for the direct comparisons for different operating conditions.
2.1.4 Liquid velocity
same solids circulation rate, this non-uniformity decreases because the flow regime transfers from the circulating regime to the dilute transport regime (Zhu et. al., 2000). Furthermore, Zheng and Zhu (1999) reported that solids circulation rate can significantly affect the radial profile of local liquid velocity. Adding more particles leads to an increase in local liquid velocity at the axis but a decrease at the wall. They argued that
particle concentration in the vicinity of the wall increases more quickly with increasing solids circulation rate in comparison with that at the central region (Zheng et al., 1999). To balance this variation, liquid velocity in the wall region decreases while that in the central region tends to rise.
Such non-uniformity in radial liquid velocity distribution can be quantified by introducing the concept of Radial Non-uniformity Index (RNI), the normalized standard deviation of the cross-sectional average liquid velocity, which varies between 0 and 1, with larger values indicating more non-uniformity in flow structures (Zheng and Zhu 2003). The higher value of RNI indicates larger non-uniform radial liquid velocity distribution. According to their research, RNI value equals to 0 under the conventional fluidization regime because the uniform solids distribution. However, under the circulating fluidization regime, the RNI value increases first and then decreases with increasing liquid velocity until the flow enters the transport regime, where the RNI value is constant and slightly larger than 0.
2.1.5 Particle velocity
Roy and his research team (Roy et al. 1997; Roy et al. 2005) was the first group to measure the radial distribution of particle velocity with larger particles. The increasing
particle velocity under different solids circulation rate and found that with increasing solids circulation rate, the non-uniformity of the radial local particle velocity also increases. Unfortunately, there has been no attempt to investigate the effects of the particle properties on the particle velocity distribution in their reported works.
2.1.6 Slip velocity
The slip velocity in LSCFB have been reported by several groups of researchers (Liang et al. 1997; Zheng 1999; Natarajan et al. 2011), who all found that the calculated apparent slip velocity is larger than the calculated average slip velocity based on the Kwauk (1963) theory extended from the Richardson and Zaki equation, which is valid for the conventional fluidization regime. In order to improve the existing correlations, Natarajan et. al. (2011) and Sang and Zhu (2012, Chapter 4) proposed two mathematical correlations to predict the average slip velocity independently. However, all the above mentioned studies only investigated the average slip velocity. There was no attempt to study the radial local slip velocity in LSCFB, because there are no experimental data of both local liquid velocity and local particle velocity under the same condition by those researchers. The local slip velocity can be one direction for future research.
2.1.7 Modeling
Generally, the modeling studies on LSCFB can be classified into two categories: analytical methods which are based on flow mechanics, classic correlations and assumptions, and numerical methods, which are based on computational fluid dynamics
(CFD). Besides, an artificial neural network (ANN) approach, is developed to model and study the phase holdup distributions in a LSCFB system (Razzak et al. 2012).
1997) is proposed to consider such non-uniformity. In this type of model, the riser is divided into two parts: a core region in the center and an annulus region adjacent to the wall. Within each region, the fluidization is considered homogeneous and the flow conditions such as liquid and solids holdups, particle and liquid velocities are assumed constant. The radial non-uniformity is then taken care of by the flow segregation between
the two regions. By this model, in each region, the average solids holdup, liquid velocity, particle velocity and slip velocity can be predicted under different operating conditions. One limitation of this model is that such predictions are still in terms of average values, so that it cannot provide the precise radial profile. To overcome this limitation, a method based on drift-flux model successfully predicted the flow phenomenon observed in experiments at the cost of introducing one extra empirical parameter called distribution coefficient which is not a flow parameter, making this model rather empirical (Palani et al. 2007) .
For numerical work, Roy and Dudukovic (Roy and Dudukovic 2001) simulated the liquid and solids residence time distributions in the riser, as well as the solids velocity and holdup pattern, based on a CFD two-fluid Euler-Lagrange model. The predicted results were validated with the experimental data and showed its application in predicting the extent of solids backmixing in the reactor. Then Cheng and Zhu (Cheng and Zhu 2005) developed a CFD model based on Eularian-Eularian two phase approach and simulated the hydrodynamics in the riser of an LSCFB under different operating conditions, different particle properties and different riser dimensions. The model predictions had good agreement with the experimental data in the literature. Moreover, the simulation results provided detailed radial profiles of solids holdup, liquid velocity and particle velocity at any axial position as well as the turbulence intensity that are hard to measure in the experiments. Later, the same group of researchers (Cheng and Zhu 2008) investigated the scale-up issue in LSCFB by the CFD model and compared with the
Comparing the both methods, each has advantageous and limitations. For example, the analytical method can provide quick estimation of the flow characteristics in LSCFB but such information is limited to certain conditions. While the CFD method can simulate the “real” flow map inside LSCFB and provide very detailed information of the flow field, the simulation process is time consuming by involving huge amount of calculations.
Therefore, the analytical model is usually used for the reactor design due to its simplicity and the CFD is used for optimizing the reactor design because of its robust simulation.
2.2 Hydrodynamics in conventional inverse fluidized bed
As early as 1982, the flow characteristics in a three-phase inverse fluidized bed have been studied (Fan et. al., 1982). Since then the research work on the inverse liquid-solid fluidized bed has never stopped.
Similar to the upwards fluidization system, the dimensionless bed expansion (HT/H0) is
independent of the initial bed height for the whole range of operation starting from
packed bed to fully fluidized bed (Ulaganathan and Krishnaiah 1996), while the pressure drop increases with increase in liquid velocity till the bed is completely fluidized and remains almost constant (Ulaganathan and Krishnaiah 1996). For the bed expansion, the situation is more complex and intensive studies were conducted.
The different models for correlation of bed expansion with superficial fluid velocity can be classified into three main categories (Fan et al. 1982) in the traditional fluidized bed. Type I model is based on correlations between U/Ui and . The Richardson and Zaki
ones. Ideally, the Richardson and Zaki equation in the upwards fluidization system is suppose to be valid in the inverse fluidization system as well. However, Karamanev and Nikolov (1992) found that there were large deviations between the experimental results and the predicted ones by Richardson and Zaki equation in the inverse system, because the free rising of the lighter particles deviate from the standard drag curve
when Re130 or p 300Kg/m3 , due to its smaller inertia, resulting a horizontal
movement by the turbulent in the flow field. . The same group of researchers also made proper modifications on the calculation of the drag coefficient to enable the Richardson and Zaki equation to be valid in the inverse system again.
Inspired by those differences in calculation of drag coefficient, Karamanev (Karamanev 1996) proposed an explicit way to determine it based on Archimedes number instead of Reynolds number for both “heavy” and “light” particles, facilitating the calculation of the particle terminal velocity and application of the Richardson and Zaki equation. This is important because the definition of Re denotes the ratio of dynamic pressure to shear stress on a moving particle, whereas the definition of Ar denotes the ratio of effective gravitational force to viscous force, which are directly exerted to a free falling or free rising particle. Thus, the definitions of drag coefficient CD and bed expansion index (n)
for falling particles, as well as rising bubbles, would be theoretically more rational and scientific to be based on Ar rather than Re.
Table 2.1 Tabulation of different studies conducted earlier on inversed fluidization
Researcher H
(m) d/D
Density
(kg/m3) Remf or Ret Ar
Fan et al (1982) 2.7 0.062~0.251
(d/0.0762m) 388~930
5 6
1.1 10 ~ 7.65 10 Karamanev and
Nikolov (1992) 1.3
0.016~0.091
(d/0.08m) 75~930
4.5~150
83~2350
6 6
0.008 10 ~ 3.39 10 Ulaganathan and
Krishnaiah (1996) 1.8
0.166~0.266
(d/0.0753m) 126~534 453.5~575
6 6
3.32 10 ~ 5.18 10 Renganathan and
Krishnaiah (2003) 2.2
0.002~0.142
(d/0.089m) 250~917 0.009~810
6
18 ~ 15.4 10 Renganathan and
Krishnaiah (2005) 2.2
0.002~0.142
(d/0.089m) 250~917 0.009~810
6
1.76 ~ 8.21 10
2.3 Hydrodynamics in inverse circulating fluidized bed
References
Cheng, Y. and J.-X. Zhu (2005). CFD modelling and simulation of hydrodynamics in liquid-solid circulating fluidized beds. Canadian Journal of Chemical Engineering 83(2): 177-185.
Cheng, Y. and J. Zhu (2008). Hydrodynamics and scale-up of liquid-solid circulating fluidized beds: Similitude method vs. CFD. Chemical Engineering Science 63(12): 3201-3211.
Cho, Y. J., H. Y. Park, S. W. Kim, Y. Kang and S. D. Kim (2002). Heat transfer and hydrodynamics in two- and three-phase inverse fluidized beds. Industrial and Engineering Chemistry Research 41(8): 2058-2063.
Chowdhury, N., J. Zhu, G. Nakhla, A. Patel and M. Islam (2009). A novel liquid-solid circulating fluidized-bed bioreactor for biological nutrient removal from municipal wastewater. Chemical Engineering and Technology 32(3): 364-372.
Dewsbury, K. H., D. G. Karamanev and A. Margaritis (2000). Dynamic behavior of freely rising buoyant solid spheres in non-newtonian liquids. AIChE Journal 46(1): 46-51.
Escudie, R., N. Epstein, J. R. Grace and H. T. Bi (2007). Layer inversion and bed contraction in down-flow binary-solid liquid-fluidized beds. Canadian Journal of Chemical Engineering 85(1): 25-35.
Fan, L.-S., K. Muroyama and S. H. Chern (1982). Hydrodynamic Characteristics of Inverse Fluidization in Liquid-Solid and Gas-Liquid-Solid Systems. The Chemical Engineering Journal V 24(N 2): 143-150.
Felice, R. D. (1995). Hydrodynamics of liquid fluidisation, Review article number 47 Chemical Engineering Science 50(8): 1213-1245.
Grace, J. R. (1986). Contacting modes and behaviour classification of gas-solid and other two-phase suspensions. The Canadian Journal of Chemical Engineering 64(3): 353-363.
Karamanev, D. G. (1996). Equations for calculation of the terminal velocity and drag coefficient of solid spheres and gas bubbles. Chemical Engineering Communications 147: 75-84.
Karamanev, D. G. and L. N. Nikolov (1992). Bed Expansion of Liquid-Solid Inverse Fluidization. Aiche Journal 38(12): 1916-1922.
Karamanev, D. G. and L. N. Nikolov (1996). Application of inverse fluidization in wastewater treatment: From laboratory to full-scale bioreactors. Environmental Progress 15(3): 194-196.
Kwauk, M. (1963). Generalized fluidization I, steady state motion. Scienta Sinica 12: 587-612.
Lan, Q., J. X. Zhu, A. S. Bassi, A. Margaritis, Y. Zheng and G. E. Rowe (2000). Continuous protein recovery using a liquid - Solid circulating fluidized bed ion exchange system: Modelling and experimental studies. Canadian Journal of Chemical Engineering 78(Compendex): 858-866.
Li, M., G. Nakhla and J. Zhu (2012). Simultaneous carbon and nitrogen removal with enhanced bioparticle circulation in a Circulating Fluidized Bed Biofilm Reactor. Chemical Engineering Journal 181-182: 35-44.
Liang, W.-G. and J.-X. Zhu (1997). A core-annulus model for the radial flow structure in a liquid-solid circulating fluidized bed (LSCFB). Chemical Engineering Journal 68(1): 51-62.
Liang, W., S. Zhang, J.-X. Zhu, Y. Jin, Z. Yu and Z. Wang (1997). Flow characteristics of the liquid-solid circulating fluidized bed. Powder Technology 90(2): 95-102.
Liang, W. G., S. L. Zhang, Z. Q. Yu, Y. Jin and Q. W. Wu (1993). Liquid-Solid circulating fluidized bed (I): studies on the phase holdups and solid circulating rate. Journal of Chemical Industry and Engineering (China) 44: 666-671.
Lu, P., Y. Cao, A. Wu and W.-P. Pan (2006). Experimental study of heat transfer in a horizontal swirling fluidized bed, Pittsburgh, PA, United states, International Pittsburgh Coal Conference.
Nikolov, L. and D. Karamanev (1987). Experimental Study of the Inverse Fluidized Bed Biofilm Reactor. Canadian Journal of Chemical Engineering 65(2): 214-217.
Nikolov, V. R. and I. Nikov (1994). Liquid-solid mass transfer in three-phase inverse fluidized bed (TPIFB). Hungarian Journal of Industrial Chemistry 22(2): 125-128.
Palani, N., R. Velraj and R. V. Seeniraj (2007). A model to predict radial solids holdup and liquid velocity distributions in liquid-solid circulating fluidized bed. Chemical Product and Process Modeling 2(3).
Patel, M., A. S. Bassi, J. J. X. Zhu and H. Gomaa (2008). Investigation of a dual-particle liquid-solid circulating fluidized bed bioreactor for extractive fermentation of lactic acid. Biotechnology Progress, 2540 Olentangy River Road, P.O. Box 3337, Columbus, OH 43210-3337, United States, American Chemical Society.
Ramamurthy, K. and K. Subbaraju (1973). Bed Expansion Characteristics of Annular Liquid Fluidized. 12(2): 184-189.
Razzak, S. A., S. M. Rahman, M. M. Hossain and J. Zhu (2012). Investigation of artificial neural network methodology for modeling of a liquid-solid circulating fluidized bed riser. Powder Technology 229: 71-77.
Renganathan, T. and K. Krishnaiah (2003). Prediction of minimum fluidization velocity in two and three phase inverse fluidized beds. Canadian Journal of Chemical Engineering 81(3-4): 853-860.
Richardson, J. and W. Zaki (1954). Sedimentation and fluidization: Part I. Transactions of the Institution of Chemical Engineers 32(8): 35-53.
Richardson, J. F. and W. N. Zaki (1954). Sedimentation and fluidisation. Institution of Chemical Engineers -- Transactions 32(1): 35-52.
Roy, S., J. Chen, S. B. Kumar, M. H. Al-Dahhan and M. P. Dudukovic (1997). Tomographic and particle tracking studies in a liquid-solid riser. Industrial and Engineering Chemistry Research 36(11): 4666-4669.
Roy, S. and M. P. Dudukovic (2001). Flow mapping and modeling of liquid-solid risers, American Chemical Society.
Sowmeyan, R. and G. Swaminathan (2008). Performance of inverse anaerobic fluidized bed reactor for treating high strength organic wastewater during start-up phase. Bioresource Technology 99(14): 6280-6284.
Ulaganathan, N. and K. Krishnaiah (1996). Hydrodynamic characteristics of two-phase inverse fluidized bed. Bioprocess and Biosystems Engineering 15(3): 159-164.
Vijaya, L. A. C., M. Balamurugan, M. Sivakumar, S. T. Newton and M. Velan (2000). Minimum fluidization velocity and friction factor in a liquid-solid inverse fluidized bed reactor. Bioprocess and Biosystems Engineering 22(5): 461-466.
Wen, C. Y. and Y. H. Yu (1966). Mechanics of fluidization. Chemical Engineering Progress Symposium, 1966.
Zhang, H., T. Wang, J. Wang and Y. Jin (2003). Particle velocity field in liquid-solid circulating fluidized beds. Huagong Xuebao/Journal of Chemical Industry and Engineering (China) 54(10): 1355-1360.
Zheng, Y. (1999). Flow Structure in a Liquid Solid Circulating Fluidized Bed. Chemical and Biochemical Engineering. London, University of Western Ontario. Ph.D.
Zheng, Y. and J. Zhu (2003). Radial Distribution of Liquid Velocity in a Liquid-Solids Circulating Fluidized Bed. International Journal of Chemical Reactor Engineering 1.
Chapter 3
3
Experimental Apparatus and Measurement Methods
Two different liquid-solid circulating fluidized beds were designed and installed in this project, including the upwards Liquid-Solid Circulating Fluidized Bed (LSCFB) and downwards Inverse Liquid-Solid Circulating Fluidized Bed (ILSCFB). In this chapter, the detailed descriptions of the experimental setup and the measurement techniques are presented.
- Circulating fluidization - Co-current flow
- Conventional fluidization - Counter-current flow - Solids storage
Fig. 3.1 The schematic structure of LSCFB and ILSCFB.
counter-currently, so that this column is characterized by large solids retention time, low shear stress and longer liquid retention time.
In LSCFB, because the density of particles is higher than that of water, the particles should be fluidized upwards therefore the column is called riser. While, when the density
of particles is lower than that of water, the particles then should be fluidized downwards in the same column therefore it is called downer. Accordingly, the downer in LSCFB then becomes riser in ILSCFB. The detailed comparisons are conducted in Table 3.1.
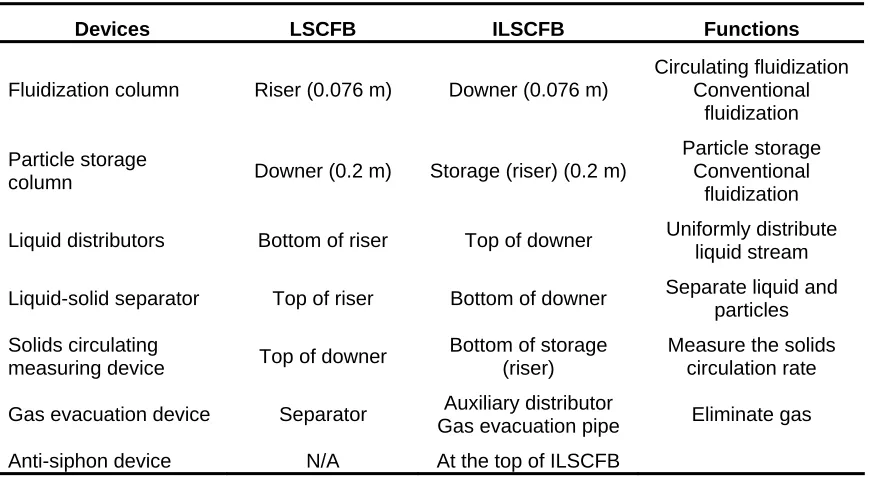
Table 3.1 Comparison of LSCFB and ILSCFB structure
Devices LSCFB ILSCFB Functions
Fluidization column Riser (0.076 m) Downer (0.076 m)
Circulating fluidization Conventional
fluidization Particle storage
column Downer (0.2 m) Storage (riser) (0.2 m)
Particle storage Conventional
fluidization Liquid distributors Bottom of riser Top of downer Uniformly distribute
liquid stream Liquid-solid separator Top of riser Bottom of downer Separate liquid and
particles Solids circulating
measuring device Top of downer
Bottom of storage (riser)
Measure the solids circulation rate Gas evacuation device Separator Auxiliary distributor
Gas evacuation pipe Eliminate gas Anti-siphon device N/A At the top of ILSCFB
3.1 The structure of LSCFB and ILSCFB
3.1.1 Upwards LSCFB
Primary Stream D ir e c ti o n of s o li ds c ir c ul at ion Liquid-solids separator Riser Downer Auxiliary stream Solids circulation measuring device Freeboard section Solids feeding pipe Riser Solids Solids feed Auxiliary stream Primary Stream Auxiliary distributor Optional liquid stream Overflow Overflow
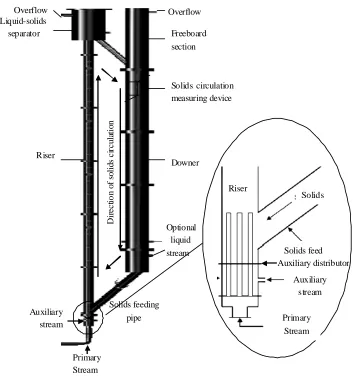
Fig. 3.2 The schematic diagram of LSCFB apparatus.
The liquid and solids flow rates can be controlled independently by adjusting the main and the auxiliary liquid flow rates. The auxiliary liquid stream controls the quantity of the particles recirculating from the downer to the riser: when the auxiliary flow is set to zero, no particles are able to enter the riser and no continuous particle circulation could be formed. Introducing the auxiliary liquid flow, solids do not begin to flow immediately.
3.1.2 Downwards ILSCFB
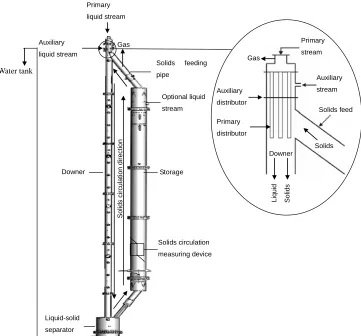
Primary liquid stream Auxiliary liquid stream Downer Liquid-solid separator Solids feeding pipe Solids circulation measuring device Storage Gas Optional liquid stream Auxiliary distributor Primary stream Auxiliary stream Solids Solids feed Downer Primary distributor Li q uid So lid s Gas Water tank S o lid s c ir c ula tio n d ir e cti onFig. 3.3 The schematic diagram of ILSCFB apparatus.
separated by the cylindrical liquid–solid separator at the bottom. Liquid is then returned to the liquid reservoir for reuse while the particles are returned to the storage column after passing through the solids circulation rate measuring device and re-introduced into the downer top via the solid feeding pipe to re-fluidize. Therefore, the light particles are continuously circulating inside ILSCFB system.
The liquid and solids flow rates can be controlled independently by adjusting the primary and the auxiliary liquid flow rates. The auxiliary liquid stream controls the quantity of the particles recirculating from the riser to the downer: when the auxiliary flow is set to zero, no particles are able to enter the downer and no continuous particle circulation could be formed. Introducing the auxiliary liquid flow, solids do not begin to flow immediately. Only when the auxiliary liquid flow reaches a threshold flow rate, solids begin to flow. After that, additional liquid added to the downer top cause more particles to enter the downer.
Some specific characteristics in ILSCFB but not observed in upwards LSCFB must be stressed.
The liquid entering the fluidized bed through the liquid distributor often carries gas bubbles. When such bubbles goes in an upflow fluidized bed, it leaves the bed rapidly from the separator at the top of riser because the direction of its free rise is the same as the direction of liquid flow and therefore it does not change significantly the hydrodynamics in the riser. However, in ILSCFB, those gas bubbles may act like “light” particles and move downwards with the liquid, the flow direction of which is opposite to the bubble rising direction. Such phenomenon will affect the hydrodynamics in ILSCFB downer because of the gas bubbles accumulation. It is very important to evacuate the gas bubble form the fluidized bed. The gas bubbles were removed from the auxiliary liquid
3.2 Measurement
procedures
Key parameters are measured in this study, including average solids holdup (s), local
solids holdup (s), local liquid velocity (Vl), local particle velocity (Vp) and superficial
solids velocity (Us). Their corresponding measuring devices are listed in Table 3.2.
Table 3.2 Measurement methods for different parameters
Parameters Measuring devices
Average solids holdup Optical fiber probe, manometer Local solids holdup Optical fiber probe
Local particle velocity Optical fiber probe
Local liquid velocity Dual conductivity probe and conductivity meter Superficial solids velocity Half butterfly valve
3.2.1 Measurement of average solids concentration
The average solids holdup is obtained from the measuring of pressure drop with monometers. Eight pressure ports are installed along the riser/downer column and connected to eight monometers respectively to obtain the pressure at different riser/downer heights. The detailed sampling positions are listed in Table 3.3. With the following equation, the average solids holdup can be calculated based on the pressure drop due to the density difference between the particles and fluidization
liquid: s l h/ ( H) , where h is the water level difference between two
monometers, H is the height difference between two probes and sl in
Table 3.3 Measurement positions on axial and radial directions
Distance from main liquid distributor (cm) Radial sampling positions, r/R (-)
Riser/downer (7.6 cm I.D.) Riser/downer (7.6 cm I.D.)
10 0 61.5 0.2034 80.5 0.492 183.8 0.6396 260.3 0.7615 311.1 0.8641 387.8 0.9518 438.8 ----
3.2.2 Measurement of local solids concentration
Light Source Light Source Detector Detector
Fig. 3.4 The schematic diagram of solids holdup and particle velocity measurement with optical fiber probe.
The local solids concentration is measured with the multi-fiber type fiber optic concentration probe as shown in Fig. 3.4. The 3.8 mm diameter probe tip consists of approximately 8000 emitting and receiving quartz fibers, each having a diameter of 15m. The active area, where the fibers are located, is approximately 1 mm by 1 mm. A
small volume of particles are illuminated by the emitted light, and reflect the light back to the receiving fiber. The reflected light intensity, which is correlated to the volumetric
over time, so that a quantitative measure of the local solids concentration is achieved with prior accurate calibration.
These probes, which are a type of intrusive measurement, are simple and practical, effective for local properties and for highly turbulent and denser systems. Moreover, they
are nearly free of interference by temperature, humidity, electrostatics and electromagnetic fields. The major difficulty in using this reflective optical fiber probe is that precise calibration is required prior to carrying out prior solids concentration measurements.
0.0
0.5
1.0
1.5
2.0
2.5
3.0
3.5
4.0
0.00
0.05
0.10
0.15
0.20
0.25
s=0.0961V Chanel 1
Chanel 2
s
[-]
V (V)
s=0.0603V
Fig. 3.5 The typical calibration curve for the optical fiber probe.
build up a full calibration curve. Once the solids concentration calibration curve is obtained, the measurement voltage signals can be easily related to the solids holdups. Fig. 3.5 shows a typical calibration curve for the optical fiber probe.
3.2.3 Measurement of local particle velocity
The multiple-fiber optical probe is a type of probe, which can be used to measure solids concentration and particle velocity simultaneously. To attain the particle velocity, a cross-correlation between two light receiving channels is required to be applied. The particles in the downer move downward to reflect the light emitted by the probe back to channel B and channel A respectively, which are two bundles of receiving fibers. The particle velocity can be determined by
/
p e AB
V L T (3.1)
where Le is the effective distance between channel A and B, which is calibrated by the
manufacturer (1.69 mm in this study). TAB is the time lag between the signal of one
particle detected by channel B and channel A. The cross-correlation of
0
1
( ) lim T ( ) ( )
AB
T T A t B t dt
(3.2)is applied to determine TAB (Horio et al. 1988).
3.2.4 Measurement of local liquid velocity
Conductivity meter
Conductivity probes
Carbon black + NaCl
Fig. 3.6 Schematic of local liquid velocity measurement
3.2.5 Measurement of superficial solids velocity
Superficial solids velocity is measured by a half butterfly valve as shown in Fig. 3.2 and 3.3. The 0.2 m diameter storage column is divided into two halves by a central vertical plate with two half butterfly valves fixed at the top and the bottom. By appropriately
flipping the top/bottom valve, all the falling/rising particles are induced to pass through the other half column, which is sealed by the bottom/top valve. Thus, all the particles are collected in one half column and increase the packed bed height with time elapsing. A certain distance from the closed valve is marked with a line. Once the particles bed surface passes the line, the accumulative time is recorded. The superficial solids velocity in the storage column can then be obtained by knowing the time period for solids accumulation and the solids packed height.
3.3 Particle
properties
All experiments were carried out at ambient temperature. Tap water was used as the fluidizing liquid. The physical properties of the 3 types of particles employed in LSCFB and Styrofoam and Hollow Glassbeads used in ILSCFB are listed in Table 3.4 and Table 3.5 respectively. The terminal particle velocity is determined by the following equation (Karamanev 1996):
4 3 p l t l D gd U C (3.3)
2 3
1 3
432 0.517
(1 0.0470 )
1 154 D C Ar Ar Ar (3.4)
valid for both free falling and free rising particles, but when Ar1.18 10 6d2p ,
0.95
D
Table 3.4 Physical properties of particles used in LSCFB
Particles Density (kg/m3) Size (mm) Ar Ut (cm/s)
Plastic beads 1330 0.58 632 2.47
Plastic beads 1520 0.58 995 3.39
Plastic beads 1520 1.19 8600 6.41
Table 3.5 Physical properties of particles used in ILSCFB
Particles Density (kg/m3) Size (mm) Ar Ut (cm/s)
Styrofoam I 46 0.8 9000 10.8
Hollow Glassbeads 790 2.5 320000 9.63
Styrofoam II 15 5 3310000 30.8
References
Horio, M., K. Morishita, O. Tachibana and N. Murata (1988). Solids distribution and movement in circulating fluidized beds. Circulating Fluidized Bed Technology II, Toronto, Pergamon Press.