Design and Performance Analysis of Digital
Low
-
Pass FIR Filter using Weighted Least
Square Error Method with Different Weights
Asha Devi1, Dr.Sanjeev Dhull2
PG Scholar, Dept. of ECE, GJUST, Hisar, Haryana, India1
Professor, Dept. of ECE, GJUST, Hisar, Haryana, India2
ABSTRACT: Digital FIR filters are very important part of digital signal processing systems. They are used in different type of applications including image processing, communication systems and medical field etc. Various methods are used for designing FIR filters including window method, frequency sampling method, optimal filter design methods. In this paper an optimization technique that uses weighted least square error (L2) method is proposed for the design of Digital FIR low pass filter. FIR filter is designed using different weighting function. Different weights are applied on the pass band and the stop band and then distortion (peak error) is calculated. The magnitude response and filter coefficients are demonstrated for the designed FIR low pass filter.
KEYWORDS: FIR, WLS method, weight, magnitude response.
I. INTRODUCTION
Digital filters are basic building blocks for digital signal processing applications. A filter is a frequency-selective device. The function of the filter is to pass signal components at some desired frequencies and to remove signal components at some other frequencies [1]. These are essential parts of many digital signal processing systems like control systems, systems for audio and video processing, communication systems and systems for medical applications. As the number of applications involving digital filtering is increased due to this variety of requirements that have to meet by digital filters has also increased. For that reason, there is a need for design techniques that can satisfy sophisticated specifications. Digital filters are classified as Recursive (FIR) and Non-Recursive (IIR) filters.
Fig 1: Types of Digital filters
The response of the non-Recursive or Finite Impulse Response (FIR) filters depends only upon Present and previous input values of the signal. The response of Recursive or Infinite impulse response (IIR) filters depends on present inputs, past inputs and the previous outputs also. A set of specifications that may be either in discrete time or frequency
Digital filters
Recursive
Filters (FIR)
domain is required to design a digital filter. Digital filters operate on discrete time signals and consists of multipliers, adders and delay elements (shift registers) implemented in digital logic.
In this paper, we have designed low pass FIR filter using weighted least square error criteria with different weights on pass band and stop band. In section II we will study the FIR filter design problem. Section III includes results and discussion and Section IV gives conclusion.
II.FIR FILTER DESIGN
In the FIR system, the impulse response sequence is of finite duration, i.e., it has a finite number of non-zero terms [2].
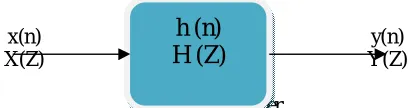
FIR filters can be completely specified by transfer function
H (z) = ∑ ℎ( )
Here h(n) is the impulse response of the filter.
x(n) y(n)
X(Z) Y(Z)
Fig 2: FIR filter Here x(n) is the input sequence and y(n) is the output sequence.
L2-NORM MINIMIZATION METHOD
L2-norm method, also known as the LSM (Least Square Minimization Method), is widely used for parameters estimation. In this method, a discrete-time transfer function is assumed and an error function is formulated on the basis of some desired amplitude and phase response. After that the error function is minimized with respect to the transfer function coefficients. In this method the desired phase and amplitude responses are obtained when the value of the norm approaches zero. It is an iterative method and, as a result, it usually involves a large amount of computation.
The weighted least square error is represented by equation as
ɛ = ( )| ( )− ( )|
Here
H (ω) : The actual amplitude response.
H(ω) : The ideal amplitude response.
W(ω): Nonnegative weighting function.
The weighting function W(ω) is used to provide more importance to specific parts of the frequency response. Using weighting function we can weight the stop band more heavily than the pass band and vice-versa. After choosing the length N and the type of the filter, our goal is to minimizes ɛ .When the filter impulse response h(n) is calculated by truncating the inverse discrete-time Fourier transform of the desired amplitude response ,then we obtain optimal solution according to the unweighted square error criterion. This method is known as ‘impulse response truncation (IRT). In this method firstly the inverse Fourier transform of the desired amplitude response is taken, then shifting and truncating of this is done in order to make it causal and of finite length. But in this when the square error decreases for longer filters, the peak error does not diminish. This effect, known as Gibbs phenomenon, is a main weakness of the IRT method.
There are several approaches to reduce the size of the peak error:
1. Multiplying the impulse response h(n) by a window. This is called windowing technique. 2. By introducing a transition band between the pass band and stop band.
3. By square error criterion in which the neighbourhood is deleted around the band edge. It is done with the help of a weighting function W(ω) that is equal to zero in the chosen neighbourhood.
The weighting function W(ω) is used to improve the FIR low pass filter as
1. it allows to eliminate Gibbs phenomenon by deleting a neighbourhood around the band edge , and 2. it allows you to assign different weights to the pass band and stop band.
As digital Filters are very important parts of digital signal processing (DSP) system. A lot of research work has been done on digital filters .L. Litwin mentioned the concept of digital filter as simply a discrete time, discrete amplitude convolve [3]. Lawrence R.Rabiner discussed several techniques such as windows method, frequency sampling method and equiripple designs for FIR filters design. In this with the help of these techniques the filter characteristics, ease of design and methods of realization have been compared [4]. Aimin Jiang and Hon Keung Kwan proposed a technique to design a Sparse FIR filter. In this technique there is decrease in non-zero-valued filter coefficients by employing weighted least-square (WLS) approximation error constraints on the frequency domain [5]. Niraja Singh and Pushpraj Tanwar designed a Sparse FIR filter. In this design the implementation complexity is reduced by decreasing the number of non-zero-valued coefficients [6] . In this weighted least square (WLS) error method is used for this. Sabah M. Ahmed et. al. designed digital FIR filter using genetic algorithm(GA) [7] .
Here we have designed digital low pass FIR filter using weighted least square error (WLS) criteria.
III RESULTS AND DISCUSSION
In this paper we have designed a digital FIR low pass filter using weighted least square error (L2) method. Weighted FIR filter design has been studied using weights on the pass band and stop band. These weights give different responses.
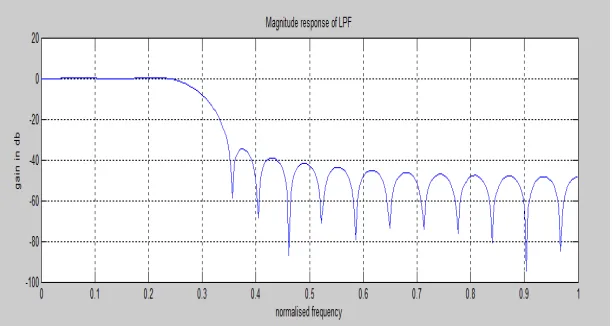
Fig 3 shows Magnitude response of low pass FIR filter using weighted least square error method:
Fig 3: Magnitude response of low pass FIR filter
Fig 4: Impulse response of low pass FIR filter
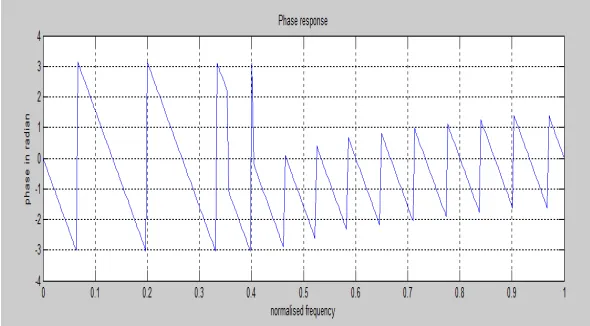
Fig 5 shows Phase response of low pass FIR filter using weighted least square error method:
Fig 5: Phase response of low pass FIR filter
TABLE 1
Parameters of Low pass FIR filter design using weighted least square error method
PARAMETERS MINIMUM VALUE MAXIMUM VALUE
N(length) 31 31
M( order) 15 15
K( weight) 10 10
fp (pass band freq.) 0.2600 0.2600
fs(stop band freq.) 0.3400 0.3400
h(impulse response) -0.0580 0.2921
wp(pass band edge) 0.8168 0.8168
Low pass FIR filter design with different applied weights:
Weight 1:
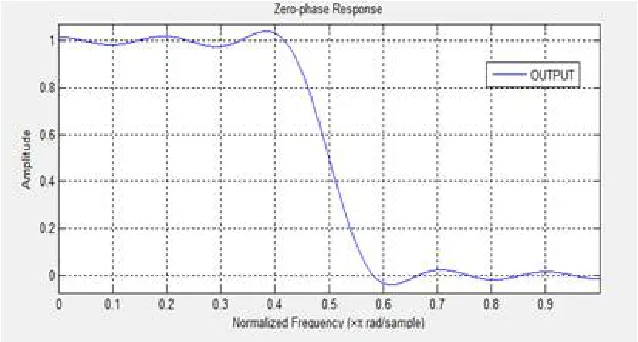
In this sample weights on both pass band and stop band of the filter are taken low i.e. 1 on pass band and 1 on stop band. Fig 6 shows the weighted low pass FIR filter amplitude frequency response using 1:1 weights or equal weights.
Fig 6: Amplitude frequency response of Weighted low pass FIR filter with 1:1 weights
When we apply equal low weights on both pass band and stop band of the filter then distortion is low. This distortion on both sides is 1%.
Weight 2:
In this sample weights on both pass band and stop band of the filter are taken different i.e. 25 on pass band and 1 on stop band. Fig 7 shows the weighted low pass FIR filter amplitude frequency response using 25:1 weights.
Fig 7: Amplitude frequency response of Weighted low pass FIR filter with 25:1 weight
Weight 3:
In this sample weights on both pass band and stop band of the filter are taken different i.e. 50 on pass band and 1 on stop band. Fig 8 shows the weighted low pass FIR filter amplitude frequency response using 50:1 weights.
Fig 8: Amplitude frequency response of Weighted low pass FIR filter with 50:1 weights
When we apply 50:1 weights on pass band and stop band of the filter then distortion is very low on pass band i.e. 0.1% and on stop band distortion is 1%.
Weight 4:
In this sample weights on both pass band and stop band of the filter are taken different i.e. 75 on pass band and 1 on stop band. Fig 9 shows the weighted low pass FIR filter amplitude frequency response using 75:1 weights.
Fig 9: Amplitude frequency response of Weighted low pass FIR filter with 75:1 weights
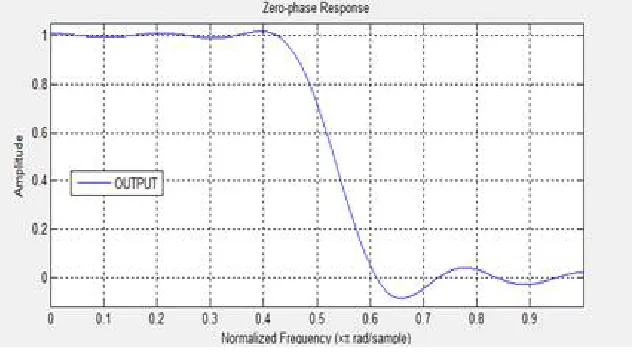
When we apply 75:1 weights on pass band and stop band of the filter then distortion is low on pass band i.e.1% and on stop band distortion is high i.e. 10%.
In this sample weights on both pass band and stop band of the filter are taken different i.e. 100 on pass band and 1 on stop band. Fig 10 shows the weighted low pass FIR filter amplitude frequency response using 100:1 weights.
Fig 10: Amplitude frequency response of Weighted low pass FIR filter design with 100:1 weights
When we apply 100:1 weights on pass band and stop band of the filter then distortion is low on pass band i.e. 1% and on stop band distortion is high i.e. 12%.
Weight 6:
In this sample weights on both pass band and stop band of the filter are taken different i.e. 1 on pass band and 25 on stop band. Fig 11 shows the weighted low pass FIR filter amplitude frequency response using 1:25 weights.
Fig 11: Amplitude frequency response of Weighted low pass FIR filter design with 1:25 weights
When we apply 1:25 weights on pass band and stop band of the filter then distortion is very low on both sides i.e. 0.1%.
Weight 7:
Fig 12: Amplitude frequency response of Weighted low pass FIR filter design with 1:50 weights
When we apply 1:50 weights on pass band and stop band of the filter then distortion is moderate on pass band i.e. 5% and on stop band distortion it is low i.e. 1%.
Weight 8:
In this sample weights on both pass band and stop band of the filter are taken different i.e. 1 on pass band and 75 on stop band. Fig 13 shows the weighted low pass FIR filter amplitude frequency response using 1:75 weights.
Fig 13: Amplitude frequency response of Weighted low pass FIR filter design with 1:75 weights
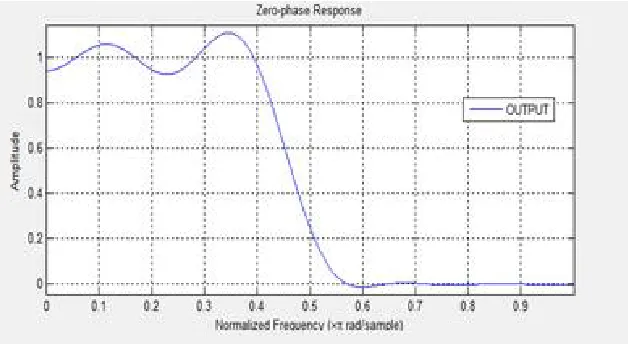
When we apply 1:75 weights on pass band and stop band of the filter then distortion is high on pass band i.e. 10% and on stop band distortion it is low i.e. 1%.
Weight 9:
Fig 14: Amplitude frequency response of Weighted low pass FIR filter design with 1:100 weights
When we apply 1:100 weights on pass band and stop band of the filter then distortion is high on pass band i.e. 10% and on stop band it is very low i.e. 0.1%.
Weight 10:
In this sample weights on both pass band and stop band of the filter are taken equal high i.e. 100 pass band and 100 on stop band. Fig 15 shows the weighted low pass FIR filter amplitude frequency response using 100:100 weights.
Fig 15: Amplitude frequency response of Weighted low pass FIR filter design with 100:100 weights
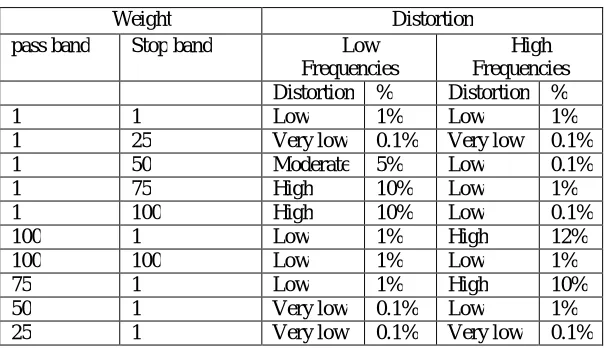
TABLE 2
Comparative Table for Different Applied Weights
Weight Distortion
pass band Stop band Low Frequencies
High Frequencies Distortion % Distortion %
1 1 Low 1% Low 1%
1 25 Very low 0.1% Very low 0.1%
1 50 Moderate 5% Low 0.1%
1 75 High 10% Low 1%
1 100 High 10% Low 0.1%
100 1 Low 1% High 12%
100 100 Low 1% Low 1%
75 1 Low 1% High 10%
50 1 Very low 0.1% Low 1%
25 1 Very low 0.1% Very low 0.1%
IV.CONCLUSION
FIR filters are used to reduce the noise from the signals. Noise is the major issue during signal transmission. In this paper FIR filter is designed using weighted least square error method. In this method different weights are used and we observe that after applying weight function distortion reduces. In this paper different weights are applied on the pass band and stop band and we conclude that when equal low pass and high pass weights are applied then distortion is low i.e. 1%.With the different weights on pass band and stop band distortion varies on both pass band and stop band. In this we conclude that filter gives better performance if weight taken as 25:1 and 1:25 it gives very low distortion i.e. 0.1%.
REFERENCES
[1] A. Antoniou, “Digital signal processing: signals, systems and filters,”McGraw-hill ,New York,2005. [2] E. C. Ifeachor and B. W. Jervis , “Digital Signal Processing,” A Practical Approach, Prentice Hall, 2002. [3] L. Litwin , “FIR and IIR digital filters,” IEEE Potentials 0278-6648, pp.28–31, 2000.
[4] Lawrence R.Rabiner, “A new optimal window,” IEEE Trans. Signal Processing, vol.39, pp. 1753–1769, Aug. 1991.
[5] A. Jiang and H. K. Kwan, “WLS design of sparse FIR digital filters,” IEEE Trans. Circuits System .I , Reg. Papers , vol.60, pp. 125-135, Jan. 2013.
[6] Niraja Singh and Pushpraj Tanwar, “FIR (sparse) filter design using IST algorithm,” IJIET, vol. 2, Issue 2, pp.386- 394, April 2013.
[7] Sabah M. Ahmed, “Design of FIR Filters With Arbitrary Amplitude And Phase Specifications Using Genetic Algorithm, ”IEEE Potentials 0-7803-8294-3, pp. 648-651, 2004.
[8] D. Mandal, S. P. Ghoshal, RajibKar and Sangeeta Mandal, “Craziness based Particle Swarm Optimization algorithm for FIR band stop filter design,” Swarm and Evolutionary Computation,(Elsvier),vol. 7, pp. 58–64,2012.
[9] D. Mandal, S. P. Ghoshal, RajibKar and Sangeeta Mandal, “Design of optimal linear phase fir high pass filter using craziness based particle swarm optimization technique ,”Computer and Information Sciences, (Elsevier), vol. 24, pp. 83-92, 2012.
[10] Borah, Amlan Deep, Abir J. Mondal, Deboraj Muchahary, and Alak Majumder. "FIR low pass filter design using Craziness base Particle Swarm Optimization Technique," International Conference in Communications and Signal Processing (ICCSP), pp. 0870-0874, 2015.
[11] D. Mandal, S. P. Ghoshal, RajibKar and Sangeeta Mandal, “Novel Particle Swarm optimization for Low Pass FIR Filter Design, ”WSEAS Transactions on Signal Processing ,Issue 3, vol.8, July, 2012.
[12] Rani, Surekha, Balwinder Singh Dhaliwal, and Sandeep Singh Gill. "Differential Evolution Biogeography Based Optimization for Linear Phase Fir Low Pass Filter Design," Chemical and Process Engineering Research 31 , pp. 81-88 , 2015.