Performance Analysis of EDFA Amplifier for
DWDM System using RZ
Dinesh Birdi1, Mandeep Singh2
PG Student [ECE], Dept. of ECE, University College of Engineering, Punjabi University, Patiala, India1
Assistant Professor, Dept. of ECE, University College of Engineering, Punjabi University, Patiala, India2
ABSTRACT: In this paper, analysis of DWDM system using EDFA in C band. Optimum results of Gail, Noise Figure,
Gain Flattening and BER are obtained by using input channel power, EDFA length, and Pump Power and Erbium concentration. Gain of EDFA is proportional to the difference in population of intermediate level and lower level. The population inversion can be controlled by proper choosing of fiber length and injected pump power to EDFA. There are two methods of pumping. But the results are obtained at 980 nm only. Using optical simulation software, results are obtained.
KEYWORDS: Doped Fiber Amplifier (EDFA), Dense Wavelength Division Multiplexing (DWDM), Noise Figure
(NF).
I.INTRODUCTION
The marvellous expansion of the high speed Internet and data traffic has created huge demand for transmission bandwidth of dense wavelength division multiplexed (DWDM) optical communication systems. The high speed transmission over the global telecommunication network without repeaters will continue to grow at an exponential rate and only optical fiber amplifiers will be able to meet the challenge. In optical fiber communication, when the light signal is transmitted over long distance then it gets attenuated and to recover this signal, optical amplifier is needed. The conventional optical amplifiers, such as the erbium doped fiber amplifier (EDFA) and Raman amplifier, are the imperative components for DWDM system [3]. The popular material for long-haul telecommunication for application is a silica fiber doped with erbium which is known as erbium-doped-fiber-amplifier or EDFA.
It provides new life to the optical fiber transmission and the subsequent research into technologies that allow high bit rate transmission over long distance. In an EDFA a, large number of signal channels are incorporated and wavelength division multiplexing is employed. Due to increasing demand for high bandwidth in optical communication systems, the long wavelength band (L-band) has been developed as a natural extension of conventional band. There is a consistent need for development in C and L band EDFA amplifiers.This amplifier is designed in order to minimize the impairments due to fiber nonlinearities and to enhance the gain bandwidth and/or gain flatness of DWDM system.
Dense Wavelength Division Multiplexing is employed along with large bandwidth erbium doped fibers for increasing the capacity of the network. Gain spectrum depends on the doping material, fiber length and temperature and other parameters [10]. DWDM allows information at various channels to be transmitted in different wavelength with its huge channel capacity and link distance and utilizes many wavelengths spaced narrowly. To take advantage of advance optical technology, DWDM systems generate many wavelengths in the range around 1550nm. DWDM fibers can transmit at speed of up to 400 giga-bits per second [12].
ISSN (Print) : 2320 – 3765 ISSN (Online): 2278 – 8875
I
nternational
J
ournal of
A
dvanced
R
esearch in
E
lectrical,
E
lectronics and
I
nstrumentation
E
ngineering
(An ISO 3297: 2007 Certified Organization)
Vol. 4, Issue 7, July 2015
II.EDFA OPERATION
EDFA is a conventional silica fiber doped with the Erbium, that’s why it is the mostly used fiber amplifier. The basic principle of EDFA is Stimulated Emission. Each free ion of Erbium exhibits discrete energy level. The energy level refers to an amount of particular energy contained by the ion corresponding either to absorb or emitted energy. Amplification in Erbium doped fiber is closely related to the changes in energy level of Erbium ions. Absorbing energy will increase its energy level and vice versa for emitting energy. In amplification terms, emitting light is associated with emitting photons. Absorption of pump photons excites Erbium ions to higher energy states.
K3 excited state
K2 metastable state
Fig. 1 Energy Levels of Erbium ions
At higher energy levels, the ions may dissipate energy radiatively by releasing photons or converting the energy into heat [13]. Optical excitation of the Erbium occurs by injecting photons with wavelengths corresponding to Erbium absorption peaks into the Erbium doped fiber. Electrons within the Erbium crystal are elevated into metastable states by using a pumping light source at wavelength 980nm or 1480nm
.
Amplification occurs due to the fact that when photons with wavelengths in the 1550nm range, thy cause stimulated emission of these states [8]. When erbium is stimulated with some suitable wavelength (980nm or 1480nm pump source) light energy, erbium ions are excited to some high energy metastable state. After some time these ions decay back to ground state, by giving up their energy in the form of light. If during decay process some light energy already exist within the fiber then this decay process is stimulated. Hence, the name is stimulated emission.
III.SYSTEM SETUP
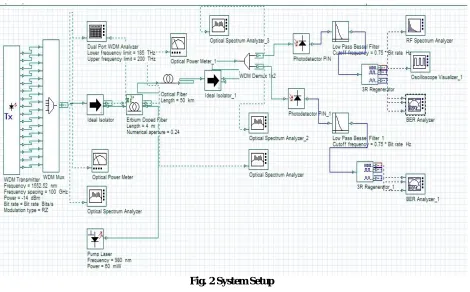
In the range of 1550 nm, we simulate a 16 channel DWDM system. RZ modulation is used in the system. The 16 multiplexed channels are usually simulated in the range of 1552 nm to 1565 nm, which is though sometimes changed to evaluate the performance of system for varying wavelength. Frequency spacing is set generally to 0.8 nm between various channels, having wavelength range of 12 nm. Power of each channel is -14dBm, which is though varied toevaluate the effect of varying input power on Gain and Noise of the active fiber.The optical isolator is moreover used to attain stable amplifier operation, which functions to block the reflected light into the amplifier. Pumping at 980nm is used to excite the doped atoms to a higher energy level.
Pump
light 1550 nm signal light
1550 nm signal light
Fig. 2 System Setup
IV.PUMPING
There is a necessity to pump erbium ions at middle state, so that population inversion is achieved. There are two different configurations: direct pumped at 1480 nm wavelength or indirect pumped at 980 nm wavelength. Indirect method is pumped at 980 nm then the erbium ions of ground state are continuously travelled to the top state. At top state, the erbium ions are non-radiatively decline to the middle state. In the same way, they fall from middle state to the ground state radiating the desired wavelength. This process is known as three level mechanism. This method is used to describe the lifetime of two upper states. The average time of atoms which are hold on a particular state as they shift spontaneously down to the next state is called time of spontaneous emission.
The middle state has a longer life time of erbium ions than the life time of upper state of erbium ions. So, the middle state is referred as metastable state. Ate the upper state, the erbium ions are pumped which move to the middle state will very rapidly and at that level they will hold on for a long time. In the same mean, to create population inversion, erbium ions will assemble at the middle state.
In direct method (at 1480 nm), there are only two energy states which are involved when it pumps directly. By external optical energy at 1480 nm, the erbium ions are constantly grabbed from the ground state and arranged at the middle state till the life time of erbium ions at the middle state is long. In this way, they assemble at middle at middle state again to create population inversion.
V. RESULT
ISSN (Print) : 2320 – 3765 ISSN (Online): 2278 – 8875
I
nternational
J
ournal of
A
dvanced
R
esearch in
E
lectrical,
E
lectronics and
I
nstrumentation
E
ngineering
(An ISO 3297: 2007 Certified Organization)
Vol. 4, Issue 7, July 2015
TABLE I. Pump Power is constant and Optical Fiber length is varied
In this, Pump Power is constant and the optical fiber length is varied from 10km to 35 km to obtain the graph of optical spectrum analyzer and BER analyzer.
TABLE II. Pump Power is varied and Optical Fiber is constant
In this, Pump Power is varied from 50 mW to 100 mW and the optical fiber length is constant to obtain the graph of optical spectrum analyzer and BER analyzer.
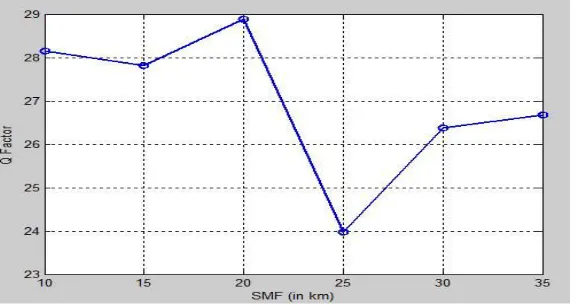
Fig. 3 Variation of Q-Factor with Length
The pump power is constant i.e. 50mW and optical fiber length is varied from 10 km to 35 km. In the fig. 3, it shows Optical Fiber
Length (in Km)
BER BER_1 Q.F Q.F_1
10 -175 -196 28.15 29.84
15 -170 -184 27.82 28.93
20 -184 -178 28.89 28.42
25 -127 -150 23.97 26.03
30 -153 -140 26.37 25.13
35 -157 -126 26.67 23.91
Pump Power (in mW)
BER BER_1 Q.F Q.F_1
50 -175 -196 28.15 29.84
60 -175 -195 28.18 29.76
70 -175 -189 28.16 29.29
80 -176 -185 28.29 28.96
90 -177 -180 28.32 28.60
Fig. 4 Variation of Q-Factor with Pump Power
In the fig. 4, it shows the graph of Pump Power Vs Q-factor. The Pump Power is constant i.e. 50mW and Pump Power is varied from 50mW to 100mW. In this, as the Pump Power increases and then graph is drawn between Q-Factor and Pump Power.
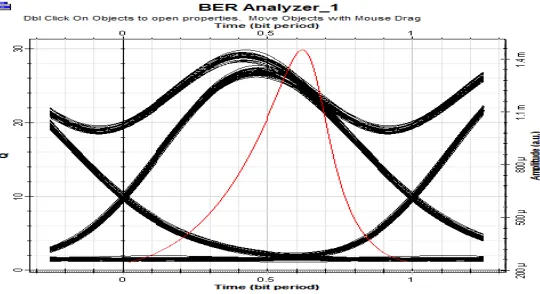
Fig. 5 BER Analyzer (Eye diagram between Time & Amplitude)
In the same way, at the pump power of 50mW, BER graph is obtained between Time and Amplitude. Fig. 5 shows the graph of Time Vs Amplitude.
ISSN (Print) : 2320 – 3765 ISSN (Online): 2278 – 8875
I
nternational
J
ournal of
A
dvanced
R
esearch in
E
lectrical,
E
lectronics and
I
nstrumentation
E
ngineering
(An ISO 3297: 2007 Certified Organization)
Vol. 4, Issue 7, July 2015
In the fig. 6, it shows the graph of Time Vs Amplitude. At the pump power of 50mW, BER graph is obtained between Time and Amplitude.
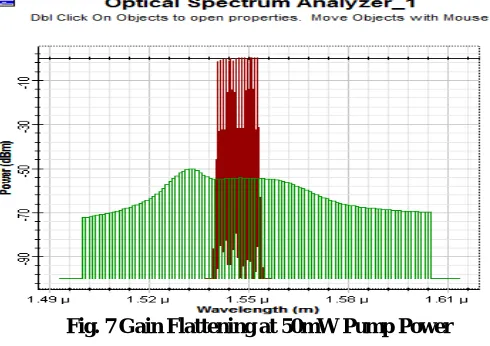
Fig. 7 Gain Flattening at 50mW Pump Power
In this fig. 7, it shows Gain Flattening at 50mW Pump Power. In this, the graph is drawn between Wavelength and Power.
VI.CONCLUSION
In this paper, the system for 16- channel amplification was analyzed with gain flatness from 1552nm to 1565nm bandwidth. The fiber length of 10km and 50mW pump power and an average noise figure of 0.5dB were obtained from the simulation. This DWDM system has a good performance of BER which is in the range of 10-175 to 10-196. Varying concentration of Erbium ions changed the gain and the best performances were obtained. Also input power was varied, and the optimal values of gain and noise figure were obtained for a value of -14dBm. All the values were taken at pump wavelength of 980nm.
REFERENCES
[1] M.A. Othman, M.M. Ismail, H.A. Sulaiman, M.H. Misran and M.A.M. Said, “EDFA-WDM Optical Network Analysis”, International Journal of Electronics and Computer Science Engineering, ISSN 2277-1956/V1N4, pp.1894-1904.
[2] InderpreetKaur and Neena Gupta, “Optimization of Fiber Length ForEdfa to Enhancethe Channel Capacity of Dwdm System,” InternationlSymposis on Intrumentation& Measurement, Sensor Network and Automation (ISMA), IEEE 2012, pp. 7-10.
[3] Simranjit Singh and R. S. Kaler, “Flat-Gain L-Band Raman-EDFA Hybrid Optical Amplifier for Dense Wavelength DivisionMultiplexed System,” IEEE Photonics Technology Letters, Volume. 25, No. 3, February 1, 2013, pp. 250-252.
[4] Xing, Liang, Li Zhan, Lilin Yi, and Yuxing Xia. "Gain-enhanced double-pass long-wavelength-band erbium-doped fiber amplifier using backward pumping."Optical Engineering46, no. 12 (2007), pp. 124203-1 – 124203-4.
[5] Anthony, Ricky, and SambhunathBiswas. "Temperature dependent gain analysis of a cascaded C-band EDFA DWDM network."Procedia Technology4 (2012), pp. 92-96.
[6] Rashid, Banaz O., and Perykhan M. Jaff. "Gain and Noise Figure Performance of Erbium-Doped Fiber Amplifiers at 10Gbps." Kirkuk University Journal Scientific Studies (2008): 60-69.
[7] BanazO., and Perykhan M. Jaff. "Gain and Noise Figure Performance of Erbium-Doped Fiber Amplifiers at 10Gbps."Kirkuk University Journal Scientific Studies(2008),” IEEE Transl. J. Magn. Japan, vol. 2, pp. 740-741, August 1987, pp. 1-8.
[8] JyotiGujral, Maninder Singh, “Performance Analysis of 4-Channel WDM System with and without EDFA,” International Journal of Electronics & Communication Technology, Vol. 4, Issue Spl - 3, April - June 2013, pp. 70-74.
[9] Cokrak, A. Cem, and AhmetAltuncu. "Gain and noise figure performance of Erbium doped fiber amplifiers (EDFA)."Journal of electrical & electronics engineering4, no. 2 (2004).741, August 1987 [Digests 9th Annual Conf. Magnetics Japan, p. 301, 1982].
[10] Pain, Somnath, et al. "Analysis of Length Dependent Gain and Noise Figure in a Dual Stage L-Band EDFA configuration."Electronics, Communication and Instrumentation (ICECI), 2014 International Conference on. IEEE, 2014, pp. 1-4.
[11] Anil Agarwal, Sudhi Kumar Sharma, “Performance Comparison of Single & Hybrid Optical Amplifiers for DWDM System Using Optisystem,” IOSR Journal of Electronics and Communication Engineering, e-ISSN: 2278-2834,p- ISSN: 2278-8735.Volume 9, Issue 1, Ver. VI (Feb. 2014), pp. 28-33.
BIOGRAPHY
Dinesh Birdi is pursuing M.TECH final year in department of Electronics and
Communication Engineering at University College of Engineering, Punjabi University, Patiala. She has done her B.TECH in trade Electronics and Communication Engineering from RIMT-MAEC, Mandi Gobindgarh. Her research interest includes Erbium Doped Fiber Amplifier and Dense Wavelength Division Multiplexing
Mandeep Singh is Assistant Professor at University College of Engineering, Punjabi