IJEDR1401105
International Journal of Engineering Development and Research (www.ijedr.org)589
Multi Attribute Decision Making:
A Tool for Robot Selection
1Rakesh V. Adakane, 2Alok R. Narkhede
Assistant Professor, Department of Mechanical Engineering,
Yeshwantrao Chavan College of Engineeing, Wanadongri, Nagpur – 440016, India
1[email protected], 2alok.narkhede@gmail,com
________________________________________________________________________________________________________
Abstract—Industrial robots are mainly employed to perform monotonous and dangerous production jobs,multi-shift
operations etc. to reduce the delivery time , improve the work environment, lower theproduction cost and even increase the product range to fulfill the customers' needs. When achoice is to be made from among several alternative robots for a given industrial application, selection of a robot is one of the most difficult problems in today’s manufacturing environment. This problem has become more challenging recently due to increasing specifications and complexity of the robots. Therefore, selection of robot becomes an important problem, because improper selection of the robots may adversely affect the profitability of the company. This study aims to solve a robot selection problem for powder coating. This paper mainly focuses on solving the robot selection problem using the MADM methods like AHP, TOPSIS, and PROMETHEE which has already become a quite popular.
Keywords-Robot selection, MADM, AHP, TOPSIS, PROMETHEE.
I. INTRODUCTION
An industrial robot is a reprogrammable multifunctional manipulator designed to move materials, parts, tools or other devices by means of variable programmed motions and to perform a variety of other tasks (Rao, 2007).The robot selection problem has become more difficult in recent years due to increasing complexity, available features, and facilities offered by different robotic products. Therefore, selection of robot becomes an important problem, because improper selection of the robots may adversely affect the profitability of the company. Several factors (criteria or attributes) have to be considered while selecting a robot effectively. The factors may be objective or subjective in nature. The objective criteria refer to those attributes of robots that can be measured and assigned numerical values, e.g. velocity of the robot arm, load capacity of the robot, repeatability, robot cost, memory capacity, manipulator reach, types of drives (actuators) and degree of freedom, etc. The subjective criteria are those that are qualitative in nature, e.g. vendor‟s service quality, robot‟s programming flexibility, etc. Since decision-making is a complex process we need for simple, systematic, and logical methods or mathematical tools to guide decision makers in considering a number of selection attributes and their interrelations. The applications of quite a good number of multiple attribute decision making (MADM) methods for solving the deterministic decision making problems of the industrial environment have been reported in the literature (Rao, 2007). However, these methods have their own merits and demerits.
MADM is employed to solve problems involving selection from a finite number of alternatives. Each decision table in MADM methods consists of four main parts, namely: (a) alternatives, (b) attributes, (c) relative importance of each attribute, and (d) measures of performance of attributes for different alternatives. Given the decision table input data and a decision making method, we need to find the best alternative and/or to rank the entire set of alternatives. The aim of the present paper is to compare the manual and robotic powder coating operation. The RTA method suggests the robot method is economical. But selecting a best robot from many alternatives is difficult task. This can be solved using MADM methods like AHP, TOPSIS and PROMETHEE which suggest the best one.
II. LITERATURE REVIEW
A good amount of research work has been carried out in recent past for robot selection, but still it is a new concept in industry at large, so it is not unusual for an industry to be a first time robot purchaser. Knott and Getto (1982) suggested a model to evaluate different robotic systems under uncertainty, and different alternatives were evaluated by computing the total net present values of cash flows of investment, labor components, and overheads. Liang and Wang (1993) proposed a robot selection algorithm by combing the concepts of fuzzy set theory and hierarchical structure analysis. The algorithm was used to aggregate decision makers‟ fuzzy assessments about robot selection attribute .Agrawal et al. (1991) proposed a robot selection procedure to rank the alternatives in a shortlist by employing TOPSIS (technique for order preference by similarity to ideal solution) method. An expert system was also developed to assist the decision maker to establish priorities and visualize the selection process at various stages. Zhao et al. (1996) have introduced genetic algorithm (GA) for optimal Robot Selection problem for a CIM system. Khouja and Kumar (1999) used options theory and an investment evaluation procedure for selection of robots weightings, and to obtain fuzzy suitability indices. Bhangale et al. (2004) had used TOPSIS and graphical method for the selection of a robot for some pick-n-place operation.Bhattacharya et al. (2005) integrated AHP and quality function deployment (QFD) methods for solving industrial robot selection problems, while considering seven technical requirements and four alternative robots.
IJEDR1401105
International Journal of Engineering Development and Research (www.ijedr.org)590
method .Vijay Manikrao Athawale(2011 )In this paper, ten most popular MCDM methods are considered and their relative performance are compared with respect to the rankings of the alternative robots as engaged in some industrial pick-n-place operation.III. MADM METHODS
MADM is Multi Attribute Decision Making method employed to solve problems involving selection from a finite number of alternatives. Each decision table in MADM methods consists of four main parts, namely:
(a) Alternatives, (b) attributes, (c) relative importance of each attribute, and (d) measures of performance of attributes for different alternatives. Given the decision table input data and a decision making method, we need to find the best alternative and/or to rank the entire set of alternatives.In this paper, in order to compare the ranking performance of different MADM methods while solving a painting type of industrial robot selection problem, the following three MADM methods are considered.
A. Analytic Hierarchy Process (AHP),
B. Technique for Order Preference by Similarity to Ideal Solution (TOPSIS) method, C. PROMETHEE (Preference Ranking Organization Method for Enrichment Evaluation)
A. Analytic Hierarchy Process
The AHP method (Saaty, 1980) involves a general theory of measurement, which is used to derive ratio scale from both the discrete and continuous paired comparisons in multi-level hierarchical structures. The procedural steps of AHP are as follows:
Step 1. Define the problem and structure the corresponding hierarchy with a goal/objective at the top level, criteria and sub-criteria at the intermediate levels and alternatives at the lowest level.
Step 2. Step 2:
A. Construct a set of pair-wise comparison matrices for each level in the hierarchy and make all the pair-wise comparisons using the fundamental scale of absolute numbers from 1 to 9. An element when self-compared is assigned a value of one. Assuming that there are N number of criteria in a decision-making problem, the pair-wise comparison of it criterion with respect to jthone yields a square matrix, A1, where aij= 1 when i = j and aji= 1/aij(aijis the comparative importance of ith criterion with respect to jthone).
B. Find the relative normalized weight (wj) for each criterion by (i) calculating the geometric mean of ithrow, and (ii) normalizing the geometric mean of rows in the pair-wise comparison matrix. This can be represented by the following equations:
(1)
(2)
C. Calculate matrices A3 and A4 such that A3 = A1 x A2 and A4 = A3/A2. Where A2 = [w1, w2,…,wN] T
. D. Determine the maximum eigenvalue (λmax) which is the average of matrix A4.
E. Calculate the consistency index (CI) as follows:
CI = (λmax– N)/ (N – 1) (3)
The smaller is the value of CI, the smaller is the deviation from consistency. F. Calculate consistency ratio as CR = CI/RI (4)
where RI is the random index obtained by different orders of the pair-wise comparison matrices. Usually, a CR of 0.1 or less is considered as acceptable which reflects an unbiased judgment of the decision maker.
Step 3. Step 3: Compare the alternatives pair-wise with respect to how much better they are in satisfying each of the considered criterion.
Step 4. Step 4: Obtain the overall performance score for an alternative by multiplying the relative normalized weight (wj) of each criterion with its corresponding normalized weight value for each alternative and summing up over all the criteria for the alternative. A ranking of the alternatives is obtained in descending order, depending on the overall performance scores indicating the best and the worst choices for a given problem.
B. TOPSIS method
This method is based on the concept that the chosen best alternative should have the shortest Euclidean distance from the ideal solution and is the farthest from the negative ideal solution. The main steps involved in TOPSIS method are presented as below:
Step 1. Determine the goal/objective of the problem and identify the pertinent selection criteria.
Step 2. From the original decision matrix, obtain the normalized decision matrix, Rij using the following equation:
1/2
(5)
Step 3. Obtain the weighted normalized matrix, Vij.
Vij = WjRij (6)
Step 4. Derive the ideal (best) and the negative ideal (worst) solutions as follows
(7)
IJEDR1401105
International Journal of Engineering Development and Research (www.ijedr.org)591
where J=(j=1,2,...,n) / j is associated with beneficial criteria and J′=(j=1,2,...,n) / j is associated with non-beneficial criteria.Step 5. Calculate the separation measures of each alternative from the ideal and the negative ideal solutions using the following equations
(9) (10)
Step 6. The relative closeness of an alternative to the ideal solution can be expressed as below:
Ci=Si-/(Si+ + Si-) (11)
Step 7. Based on the relative closeness measures, the alternatives are ranked in descending order.
C. PROMETHEE method
The PROMETHEE method was firstly proposed by Brans (1985) [11]. The method uses outranking relation between pairs of alternatives to solve problems which have a finite alternatives and are needed to be sorted considering with conflicting criteria and different units. Unlike other ranking methods which apply the same evaluation scale and preference function in the evaluation process, the PROMETHEE usually uses different preference functions to define different decision attributes according to their different features [11, 12].
When a pair of alternatives (a, b) is compared, a preference function is used to express the difference between the two alternatives in terms of a preference degree range [0, 1]. Usually, two PROMETHEE methods [9] can be employed to solve the evaluation problems: PROMETHEE I and PROMETHEE II. Compared to PROMETHEE I that provide a partial ranking of alternatives, PROMETHEE II offer a complete ranking from the best alternative to the worst one. Therefore, PROMETHEE II is chosen in the hybrid decision making approach. The procedure of PROMETHEE II is constituted by four steps.
1. Calculating the deviations based on compared twoalternatives with respect to jth criterion:
dj(a,b)=fj(a) - fj(b) j=1,2,..., k. (12) (12)
Where j denotes the jth criterion, k stands for the finite number of criteria. 2. Applying the preference function:
Pj(a,b)=Fj[dj (a,b)]j=1,2,..., k. (13) (13)
0≤Pj(a,b)≤1 j=1,2,..., k. (14)
where Pj(a, b) expresses the preference of alternative a with regarding to alternative b on the jth criterion.
3. Calculating a global preference index. The overall preference index of alternative a over alternative b is denoted as:
(a,b)= j=1,2,..., k. (14) (15)
Where wj represents the weight of the criterion j.
4. Calculating the outranking flows. The outgoing flow Ф+ which expresses the outranking character of alternative a (how a dominates all the other alternatives) and the incoming flow Ф- which indicates the outranked character of alternative a (how is a dominated by all the other alternatives) can be represented as follows:
(15)
(16)
Where A denotes the alternative set. The net flow Ф(a) which is defined by equation (17) expresses the overall preference degree of alternative a. Higher value of Ф(a) means a better performance of alternative a.
ø (a) = ø+(a) – ø–(a) (17)
IV. ROBOT SELECTION PROBLEM
This paper deals with the selection of the most appropriate industrial robot for Powder coating operations where it has to avoid certain obstacles. Performance of an industrial robot is often specified using different attributes. Repeatability, load capacity, mass of robot, Cost of robot, manipulator reach and velocity are observed to be the most critical attributes affecting the robot selection decision. Repeatability is the measure of the ability of a robot to return to the same position and orientation over and over again. Loadcapacity is the maximum load that a manipulator can carry without affecting its performance. Maximum tip speed is the speed at which a robot can move in an inertial reference frame. Manipulator reach is the maximum distance that can be covered by the robotic manipulator so as to cover the maximum painting area. Here the vertical and horizontal reach of the robot are important attributes. The cost f the robot is a decisive factor from industry point of view. The mass of robot is the last attribute considered in this study. In this paper seven different attributes are considered as Vertical reach (VR), Horizontal reach (HR), pay lad capacity (P), Repeatability(Re),Cost of Robot(C), Mass Of Robot(M) and Speed of Robot(S). Thus the selection problem consists of seven attributes and fifteen alternatives of robot.
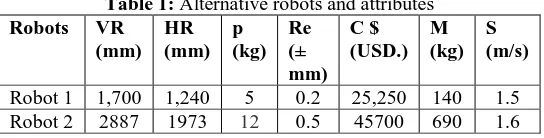
Table 1: Alternative robots and attributes
Robots VR (mm)
HR (mm)
p (kg)
Re (± mm)
C $ (USD.)
M (kg)
S (m/s)
IJEDR1401105
International Journal of Engineering Development and Research (www.ijedr.org)592
Robot 3 1,852 1,256 5 0.15 29350 110 2Robot 4 2,806 2,054 15 0.5 35500 540 2 Robot 5 2662 2558 10 0.3 40700 630 2 Robot 6 1000 1620 5 2 32250 610 2 Robot 7 2947 1658 20 0.06 37,500 280 1.7 Robot 8 2800 1400 15 0.2 50700 530 1.5 Robot 9 3,000 2600 10 0.5 47900 600 2
Robot
10 5147 2700 15 0.15 42250 590 2 Robot
11 2965 2515 6 5 44750 480 2
Robot
12 1459 1225 7 0.15 34000 250 1.5 Robot
13 2394 2975 13 0.15 51200 540 2 Robot
14 4450 2665 20 0.5 55450 795 2 Robot
15 2053 1722 20 0.06 45000 220 2
A. AHP Method
The following is the normalized matrix obtained from table 3 using step 2a of AHP Method. The normalized matrix is shown in table 4.
Table 2: Normalized Matrix of AHP
Robots VR (mm)
HR (mm)
p (kg)
Re (± mm)
C $ (USD.)
M (kg)
S (m/s)
Robot 1 0.33 0.417 0.3 0.3 1 0.785 0.75 Robot 2 0.561 0.663 0.6 0.12 0.5525 0.159 0.8 Robot 3 0.36 0.422 0.3 0.4 0.8603 1 1 Robot 4 0.545 0.69 0.8 0.12 0.7112 0.203 1 Robot 5 0.517 0.86 0.5 0.2 0.6204 0.174 1 Robot 6 0.194 0.545 0.3 0.03 0.7829 0.18 1 Robot 7 0.573 0.557 1 1 0.67 0.392 0.85 Robot 8 0.544 0.471 0.8 0.3 0.498 0.207 0.75 Robot 9 0.583 0.874 0.5 0.12 0.5271 0.183 1 Robot 10 1 0.908 0.8 0.4 0.5976 0.1864 1 Robot 11 0.576 0.845 0.3 0.012 0.5642 0.2291 1 Robot 12 0.284 0.412 0.4 0.4 0.7426 0.44 0.75 Robot 13 0.465 1 0.7 0.4 0.4931 0.203 1 Robot 14 0.865 0.896 1 0.12 0.4553 0.138 1 Robot 15 0.399 0.579 1 1 0.5611 0.5 1
Let the decision maker decides to use the AHP method to determine the weights (wj) of the attributes, and prepare the following
matrix:
Table 3: Weights of the attributes
VR HR P Re C M S VR 1 2 5 3 1 7 4
HR 0.5 1 2.5 1.5 0.5 3.5 2
P 0.2 0.4 1 0.6 0.2 1.4 0.8
Re 0.3333 0.6667 1.6667 1 0.3333 2.3333 1.3333
C 1 2 5 3 1 7 4
M 0.1429 0.2857 0.7143 0.4286 0.1429 1 0.5714
S 0.25 0.5 1.25 0.75 0.25 1.75 1
The normalized weights of each attribute are calculated using step 2 b of AHP Method and these are considered as matrix A2: WVR=0.2918, WHR=0.1459, WP=0.0584, WRE=0.0973, WC=0.2918, WM=0.0417, WS=0.0729.
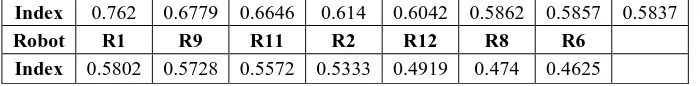
The multiplication of normalized matrix and weight matrix A2 gives the ranking of robot s follows.From table 6 values of the robot selection index, robot 10 is considered as the best choice among the robots considered for the given industrial application.
Table 4: Rank of robots using AHP
IJEDR1401105
International Journal of Engineering Development and Research (www.ijedr.org)593
Index 0.762 0.6779 0.6646 0.614 0.6042 0.5862 0.5857 0.5837Robot R1 R9 R11 R2 R12 R8 R6 Index 0.5802 0.5728 0.5572 0.5333 0.4919 0.474 0.4625
B. TOPSIS Method
The quantitative values of the robot selection attributes, which are given in Table 3 are normalized as explained step 2 of TOPSIS. Relative importance of attributes (aij) is assigned using the AHP method and these are WVR=0.2918, WHR=0.1459, WP=0.0584, WRE=0.0973, WC= 0.2918, WM=0.0417, WS=0.0729.
The weighted normalized matrix is calculated, using step 3 of topsis and is shown below in table8.
Table 5: Weighted normalized matrix of TOPSIS
Robots VR HR p Re C M S
Robot 1 0.0447 0.0223 0.0058 0.0035 0.0453 0.0030 0.0151 Robot 2 0.0759 0.0355 0.0139 0.0088 0.0819 0.0146 0.0162 Robot 3 0.0487 0.0226 0.0058 0.0027 0.0526 0.0023 0.0202 Robot 4 0.0737 0.0369 0.0174 0.0088 0.0637 0.0114 0.0202 Robot 5 0.0700 0.0460 0.0116 0.0053 0.0730 0.0133 0.0202 Robot 6 0.0263 0.0291 0.0058 0.0354 0.0578 0.0129 0.0202 Robot 7 0.0774 0.0298 0.0231 0.0011 0.0672 0.0059 0.0172 Robot 8 0.0736 0.0252 0.0174 0.0035 0.0909 0.0112 0.0151 Robot 9 0.0788 0.0467 0.0116 0.0088 0.0859 0.0127 0.0202 Robot 10 0.1353 0.0485 0.0174 0.0027 0.0758 0.0125 0.0202 Robot 11 0.0779 0.0452 0.0069 0.0885 0.0802 0.0101 0.0202 Robot 12 0.0383 0.0220 0.0081 0.0027 0.0610 0.0053 0.0151 Robot 13 0.0629 0.0535 0.0150 0.0027 0.0918 0.0114 0.0202 Robot 14 0.1169 0.0479 0.0231 0.0088 0.0994 0.0168 0.0202 Robot 15 0.0540 0.0309 0.0231 0.0011 0.0807 0.0046 0.0202 Ideal (best) and negative ideal (worst) solutions are calculated using step 4, and these are given as:
Ideal best Ideal worst V+vr 0.1353 V-vr 0.0263
V+hr 0.0535 Vhr 0.0220
V+p 0.0231 V-p 0.0058
V+re 0.0011 V-re 0.0885
V+c 0.0453 V-c 0.0994
V+m 0.0023 V-m 0.0168
V+s 0.0202 V-s 0.0151
Separation measures are calculated using step 5 and these are:
sa+ sa- sa+ sa-
R1 0.09757 0.10333 R9 0.07199 0.099876 R2 0.07425 0.096741 R10 0.03303 0.143812 R3 0.09390 0.101456 R11 0.11197 0.060342 R4 0.06766 0.101409 R12 0.10440 0.095549 R5 0.07324 0.100851 R13 0.08691 0.099491 R6 0.11927 0.068129 R14 0.05974 0.124731 R7 0.06643 0.108533 R15 0.09157 0.096511 R8 0.08268 0.098493
The relative closeness of a particular alternative to the ideal solution iscalculated using step 6 of TOPSIS, and these are:
Robot R1 R2 R3 R4 R5 R6 R7 R8 Index 0.514 0.565 0.519 0.599 0.579 0.363 0.620 0.543
Robot R9 R10 R11 R12 R13 R14 R15 Index 0.581 0.813 0.350 0.477 0.533 0.676 0.513
This relative closeness to the ideal solution can be named as the „robot selection index‟ in the present work. Alternative robots are arranged in descending order of their robot selection index. Robot 10 is having maximum index thus it is best choice.
C. PROMETHEE Method
IJEDR1401105
International Journal of Engineering Development and Research (www.ijedr.org)594
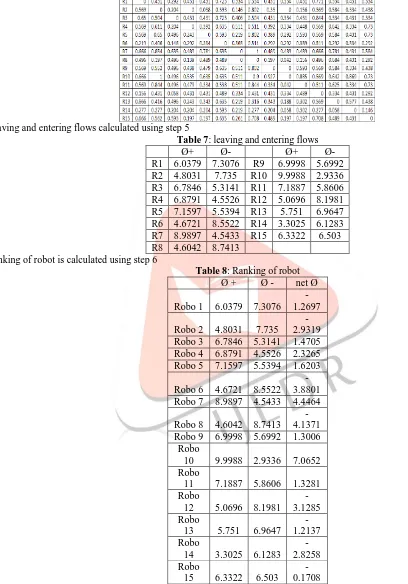
flows for different alternative robots are estimated, using step 5 and are given in Table 9.Based on these leaving and entering flows, the net outranking flow values for the alternative robotsare then determined, as given in Table 10.Table 6: Aggregated Preference function
Leaving and entering flows calculated using step 5
Table 7: leaving and entering flows
Ø+ Ø- Ø+ Ø-
R1 6.0379 7.3076 R9 6.9998 5.6992 R2 4.8031 7.735 R10 9.9988 2.9336 R3 6.7846 5.3141 R11 7.1887 5.8606 R4 6.8791 4.5526 R12 5.0696 8.1981 R5 7.1597 5.5394 R13 5.751 6.9647 R6 4.6721 8.5522 R14 3.3025 6.1283 R7 8.9897 4.5433 R15 6.3322 6.503 R8 4.6042 8.7413
Ranking of robot is calculated using step 6
Table 8: Ranking of robot Ø + Ø - net Ø Robo 1 6.0379 7.3076
-1.2697 Robo 2 4.8031 7.735
-2.9319 Robo 3 6.7846 5.3141 1.4705 Robo 4 6.8791 4.5526 2.3265 Robo 5 7.1597 5.5394 1.6203 Robo 6 4.6721 8.5522
-3.8801 Robo 7 8.9897 4.5433 4.4464 Robo 8 4.6042 8.7413
-4.1371 Robo 9 6.9998 5.6992 1.3006
Robo
10 9.9988 2.9336 7.0652 Robo
11 7.1887 5.8606 1.3281 Robo
12 5.0696 8.1981 -3.1285 Robo
13 5.751 6.9647 -1.2137 Robo
14 3.3025 6.1283 -2.8258 Robo
15 6.3322 6.503 -0.1708
The alternatives are now ranked in descending order according to the net outranking flow value, which again gives Robot 10 as the best choice.
Table 9: Rank of robot by each method Rank of Robot
ROBOT AHP TOPSIS PROMETHEE
R1 9 11 10
R2 12 7 12
IJEDR1401105
International Journal of Engineering Development and Research (www.ijedr.org)595
R4 5 4 3
R5 6 6 4
R6 15 14 14
R7 2 3 2
R8 14 8 15
R9 10 5 7
R10 1 1 1
R11 11 15 6
R12 13 13 13
R13 8 9 9
R14 3 2 11
R15 4 12 8
V. CONCLUSION
The goal of any company is to earn the maximum profit at minimum input. This can be achieved by systematic study and effective implementation of various techniques to improve the Quality and productivity of the system. The cited example demonstrates the potentiality, applicability and simplicity of the MADM method in solving robot selection decision-making problems. The project presents a robot selection procedure based on the Multiple Attribute Decision Making (MADM) approach which suggests the best suitable robot. All the three methods suggest that robot 10 is best choice. The method can incorporate the decision maker‟s preferences regarding the relative importance of different robot selection attributes.
REFERENCES
[1] R. V. Rao, “Decision Making in the Manufacturing Environment using Graph Theory and Fuzzy Multiple Attribute Decision Making Methods”, Springer-Verlag, London, 2007.
[2] R. V. Rao and K. K. Padmanabhan, “Selection, Identification and Comparison of Industrial Robots using Digraph and Matrix Methods”, Robotics and Computer-Integrated Manufacturing, Vol 22, pp 373-383, 2006.
[3] R. V. Rao and B. K. Patel, “Decision making in the manufacturing environment using an improved PROMETHEE method”, International Journal of Production Research, Vol 48, pp 4665-4682, 2009.
[4] R. V. Rao ,B. K. Patel, and M. Parnichkun, “Industrial robot selection using a novel decision making method considering objective and subjective preferences:Robotics and Autonomous Systems”,2011.
[5] V. P. Agrawal, V. Kohli and S. Gupta “Computer aided robot selection: the „multiple attribute decision making‟ approach”, International Journal of Production Research , Vol 29,pp1629–1644, 1991.
[6] P. P. Bhangale, V.P. Agrawal, S. K. Saha, “Attribute based specification, comparison and selection of a robot”, Mechanism & Machine Theory Vol 39, pp 1345– 1366, 2004.
[7] D. E. Booth and M. Khouja, “A robust multivariate statistical procedure for evaluation and selection of industrial robots”, International Journal of Operations & Production Management, Vol 12, pp15–24, 1992.
[8] N. Boubekri, M. Sahoui and C. Lakrib, “Development of an expert system for industrial robot selection. Computers & Industrial Engineering”, Vol 20,119–127, 1991.
[9] M. Bragilia, A. Petroni, “Evaluating and selecting investments in industrial robots”, International Journal of Production Research Vol 37, pp 4157–4178, 1999.
IJEDR1401105
International Journal of Engineering Development and Research (www.ijedr.org)596
[11] C. H. Goh, Y. C. A. Tung, C.H. Cheng, “A revised weighted sum decision model for robot selection”, Computers &Industrial Engineering, Vol 30, pp 193–198, 1996.
[12] M. M. Imang, R. J. Schlesinger, “Decision models for robot selection: a comparison of ordinary least squares and linear goal programming method.” Decision Sciences, Vol 20, pp 40–53,1989.