IJEDR1404011
International Journal of Engineering Development and Research (www.ijedr.org)3428
Design and Optimization of Iron Slag Matrix
Composite Materials
1
Ch.Ram Mohan,
2Y.N.V Santhosh Kumar,
3Ch.Ramesh
1 M. Tech Scholar (Aerospace Engineering), 2,3Assistant Professor 1,2Nimra Institute of Science & Technology, Vijayawada,
3
PACE Institue of Technology, Ongole
________________________________________________________________________________________________________
Abstract - In recent years composites have attracted substantial importance as a potential structural material. Most basic and common attractive features of composites that make them useful for industrial applications. In order to meet the dynamic desires the conventional materials are not alone enough. So, by combining these traditonal materials with some non-traditional materials hybrid properties can be achieved which is the origin for the compostie materials.The objective of present work is to use this industrial waste i.e. Slag as particulate filler material to the epoxy matrix composites by molding technique with different weight fractions ( 0%, 5%,10%,15%, 20% ) to study the mechanical behaviour of reinforced polymer composite material. The change in weight is studied for Slag under different tests like, tensile, bending and impact for obtaining the result. The conclusion helps us to predict the mechanical behavior of various constituents of Slag had resulted in better mechanical properties. The composite can be regarded as a useful light weight engineering material.
________________________________________________________________________________________________________
I. INTRODUCTION
The first uses of composites date back to the 1500s B.C. when early Egyptians and Mesopotamian settlers used a mixture of mud and straw to create strong and durable buildings. Straw continued to provide reinforcement to ancient composite products including pottery and boats. Later, in 1200 AD, the Mongols invented the first composite bow. Using a combination of wood, bone and “animal glue,” bows were pressed and wrapped with birch bark. These bows were extremely powerful and accurate.
Composite materials are engineering materials made from two or more constituent materials with significantly different physical or chemical properties which remain separate and distinct on a macroscopic level within the finished structure. A composite material is a microscopic or macroscopic combination of two or 22more distinct materials with a recognizable interface between them.A Composite in engineering sense is any materials that have been physically assembled to form one single bulk without physical blending to foam a homogeneous material. The resulting material would still have components identifiable as the constituent of the different materials.
A common example of a composite is concrete. It consists of a binder (cement) and reinforcement (gravel). Adding reinforcement (rebar) transforms concrete into a three-phase composite .The individual materials that make up composites are called constituents. Most composites have two constituent materials: a binder or matrix, and reinforcement. The reinforcement is usually much stronger and stiffer than the matrix, and gives the composite its good properties. The matrix holds the reinforcements in an orderly pattern. Because the reinforcements are usually discontinuous, the matrix also helps to transfer load among the reinforcements.
Preparation of Samples
The Samples are prepared by reinforcing the pig iron slag to unsaturated polyester resin to improve the mechanical properties of resin. The industrial waste is collected from LANCO pig iron industry at Srikalahasti. Various ingredients are added to the solution in order to improve the bonding properties and strength of the pure resin.
Major ingredients
i. Resin – Unsaturated polyester and Epoxy ii. Catalyst – ketone peroxide
iii. Hardener – cobalt (Accelerater) iv. Powder –slag.
II. THE PROPERTIES OF THESE INGREDIENTS
A. Resin
IJEDR1404011
International Journal of Engineering Development and Research (www.ijedr.org)3429
Polyester resins are thermosetting and, as with other resins, cure exothermically. The use of excessive catalyst can, therefore, cause charring or even ignition during the curing process. Excessive catalyst may also cause the product the fracture or form a rubbery material.B. Catalyst
Methyl ethyl ketone peroxide (MEKP) is an organic peroxide, a high explosive similar to acetone peroxide. MEKP is a colorless, oily liquid whereas acetone peroxide is a white powder at STP; MEKP is slightly less sensitive to shock and temperature, and more stable in storage. Dilute solutions of 30 to 60% MEKP are used in industry and by hobbyists as the catalyst which initiates the polymerization of polyester resins used in glass-reinforced plastic, and casting. For this application, MEKP is dissolved in dimethyl phthalate, cyclohexane peroxide, or diallyl phthalate to reduce sensitivity to shock. Benzoyl peroxide can be used for the same purpose. MEKP is a severe skin irritant and can cause progressive corrosive damage or blindness.
C. Cobalt
Cobalt-based catalysts are also important in reactions involving carbon monoxide. Steam reforming, useful in hydrogen production, uses cobalt oxide-base catalysts. Cobalt is also a catalyst in the Fischer-Tropsch process, used in the conversion of carbon monoxide into liquid fuels. The hydroformylation of alkenes often rely on cobalt octacarbonyl as the catalyst, although such processes have been displaced by more efficient iridium- and rhodium-based catalysts, e.g. the Captive process.
The hydrodesulphurization of petroleum uses a catalyst derived from cobalt and molybdenum. This process helps to rid petroleum of sulfur impurities that interfere with the refining of liquid fuels.
D. Slag composition
Table: 1
SiO2 19.95%
Al2O3 0.57%
CaO 32.40%
MgO 9.80%
FeO 0.32%
MnO 0.45%
Fe2O3 34.40%
SiO2 19.95%
E. Special Features Improves adhesion
Creates physico-chemical bond with inorganic substrates Increases tensile strength and modulus of composites Increases flexural strength and modulus of composites Increases compressive strength of composites
F. Properties
Table: 2
Characteristic Test Method Unit Specification
Appearance Visual Clear Liquid
Viscosity at 25oC ASTM-D 445 M Pa < 10 Density at 25oC ASTM-D 4052 g/cc 1.05 - 1.09
Flash Point ASTM-D 93 °C 122
Storage life Years 1
Boiling point 1200C
Refractive Index 1.428 – 1.43
G. Method of preparation For Polyester
Table: 3
Sample Resin Catalyst Accelerator Flue dust/Sludge/Slag
Pure resin 96% 2% 2% 0
5% 91% 2% 2% 5%
10% 86% 2% 2% 10%
15% 76% 2% 2% 15%
IJEDR1404011
International Journal of Engineering Development and Research (www.ijedr.org)3430
The samples are prepared for different types of tests such as tensile, flexural and iM Pact. The mould is prepared on smooth ceramic tile with rubber shoe sole to the required dimension. Initially the ceramic tile is cleaned with shellac (NC thinner) a spirituous product to ensure clean surface on the tile. Then mould is prepared by keeping the rubber sole on the tile. The gap between the rubber and the tile is filled with mansion hygienic wax. A thin coating of PVA (polyvinyl alcohol) is applied on the contact surface of the specimen, using brush. The resulting mould is cured for 24 hours.The mixture is prepared as per the above mentioned percentage and poured into the mould.
This is left for solidification for 24 hours and then removed from the sheet. The specimens are post cured at 500C for 2hrs in oven
H. Testing Of Specimens
The specimens prepared are subjected to 3 types of tests 1. Tensile test – Uniaxial tensile test
2. Bending test – 3-point flexural test 3. IM Pact test – V- notched iM Pact test
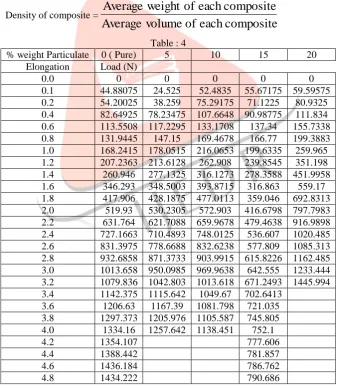
I. Density of composite
In order to find the density of the composites we have to find the volume of the composites using Archimedes principle. Take a graduated flask and fill it with water without air bubbles, up to a level (say 100ml). Now immerse the specimens (having same weight of fiber) into the water. Now the water is displaced to some extent and the water level in the flask is noted. The difference between the two levels gives the volume of the composites. Now average volume of each composite is calculated. The weights of all composites are noted using a digital weighing balance of 0.01gms least count. The average mass of each composite is then calculated.
Density of composite =
composite
each
of
volume
Average
composite
each
of
weight
Average
Table : 4
% weight Particulate 0 ( Pure) 5 10 15 20
Elongation Load (N)
0.0 0 0 0 0 0
0.1 44.88075 24.525 52.4835 55.67175 59.59575 0.2 54.20025 38.259 75.29175 71.1225 80.9325 0.4 82.64925 78.23475 107.6648 90.98775 111.834 0.6 113.5508 117.2295 133.1708 137.34 155.7338 0.8 131.9445 147.15 169.4678 166.77 199.3883 1.0 168.2415 178.0515 216.0653 199.6335 259.965 1.2 207.2363 213.6128 262.908 239.8545 351.198 1.4 260.946 277.1325 316.1273 278.3588 451.9958 1.6 346.293 348.5003 393.8715 316.863 559.17 1.8 417.906 428.1875 477.0113 359.046 692.8313 2.0 519.93 530.2305 572.903 416.6798 797.7983 2.2 631.764 621.7088 659.9678 479.4638 916.9898 2.4 727.1663 710.4893 748.0125 536.607 1020.485 2.6 831.3975 778.6688 832.6238 577.809 1085.313 2.8 932.6858 871.3733 903.9915 615.8226 1162.485 3.0 1013.658 950.0985 969.9638 642.555 1233.444 3.2 1079.836 1042.803 1013.618 671.2493 1445.994 3.4 1142.375 1115.642 1049.67 702.6413
3.6 1206.63 1167.39 1081.798 721.035 3.8 1297.373 1205.976 1105.587 745.805 4.0 1334.16 1257.642 1138.451 752.1
4.2 1354.107 777.606
4.4 1388.442 781.857
4.6 1436.184 786.762
IJEDR1404011
International Journal of Engineering Development and Research (www.ijedr.org)3431
Fig:1. Load vs Elongation of Slag for Epoxy ResinJ. Load Vs Elongation of Slag for Polyster
The tensile load versus elongation curve of Slag specimens is shown in fig 5.1. For pure particulate specimen as the load increases the elongation also increases gradually. It reached the peak at a load of 751.4460 N with a elongation of 3mm. For 5% particulate weight as the load increased the elongation also increased but the rate of deflection is slightly more than pure specimen. It reached the peak at a load of 808.1478 N. For 10% particulate weight as the load increased the elongation also increased but the rate is greater than 15% particulate specimen, it reached the peak at a load of 1167.390 N with a elongation of 3 mm. For 10% particulate weight specimen the variation of the curve is similar to 20% particulate weight but it reached the peak at a load of 1056.79 N with a deflection of 2.4mm
Table: 5 Load vs Elongation of slag for Polyster
% weight Particulate 0 ( Pure) 5 10 15 20
Elongation Load (N)
0.0 141.7545 108.1062 97.90380 123.606 109.7815 0.1 168.4657 155.9098 177.1595 182.732 185.9786 0.2 197.6780 189.5292 193.4532 221.1174 187.1963 0.4 243.5332 226.8072 259.7688 283.3128 225.908 0.6 283.2637 281.9394 337.4640 374.5458 276.781 0.8 336.4830 333.3438 403.7796 461.2662 381.5167 1.0 390.1940 394.7544 517.5756 573.2964 473.501 1.2 437.7710 445.3740 634.7070 688.0734 499.259 1.4 480.9352 494.2278 754.7814 792.0594 548.913 1.6 518.9490 555.0498 870.7356 840.7170 625.458 1.8 548.3750 613.7136 961.5762 911.0220 711.714 2.0 587.8642 664.7256 1045.157 888.7860 825.668
2.2 627.3495 704.9466 1103.428 917.931
2.4 659.7225 737.3196 1154.637 1056.79
2.6 679.5878 762.2370 1191.130 2.8 724.3040 785.7810 1142.211
Fig:2.
Tensile Strength Vs Percentage Weight of Slag
The tensile strength versus percentage weight of Slag is shown in the fig 5.3. There is an increase in the graph which reached a maximum value at 20 %. The value of tensile strength at 5% weight of particulate is 33.53MPa and there is an increase in the tensile strength at 10% weight of particulate to a value of 30.35MPa. The increment in the tensile strength has later decreased at 15 % weight of particulate to an amount of 31.08MPa.Thae tensile strength at 20% weight of particulate to an amount of 38.55 Mpa. The values of the tensile strength and the percentage weight is given in the table 6
0 20 0 40 0 60 0 80 0 100 0 120 0 140 0
0 1 2 3 4
Elongation
IJEDR1404011
International Journal of Engineering Development and Research (www.ijedr.org)3432
Table:6. Tensile Strength Vs Percentage Weight of SlagFig:3 Tensile Strength Vs Percentage Weight of Slag
K. Tensile Modulus Vs Percentage Weight of Slag
The tensile modulus versus percentage weight graph of Slag is shown in the figure 5.4. The tensile modulus reached maximum value at 20% and minimum value at 10%. The value of tensile modulus at 20% weight of slag is 602.34 MPa. The tensile modulus value decreased at 10% weight of slag to a value of 379.375MPa and there is again an decrease in the value at 5% and 15% weight of slag to a value of419.12 MPa. The values of tensile modulus and the percentage weight of slag is shown in the table 7.]
Table : 7 Tensile Modulus Vs Percentage Weight of Slag Percentage wt of Slag 0% 5% 10% 15% 20% Tensile modulus(Mpa) 397.916 419.12 379.375 419.58 602.34
Fig:4. Tensile Modulus Vs Percentage Wt of Slag
Specific Tensile Strength Vs Percentage Weight of Slag
Table: 8 Specific Tensile Strength Vs Percentage Weight of Slag
percentage wt of Slag 0% 5% 10% 15% 20%
Sp Tensile strength(Mpa/kgm-3) 0.026 0.0244 0.0218 0.0153 0.0255 percentage wt of Slag 0% 5% 10% 15% 20%
IJEDR1404011
International Journal of Engineering Development and Research (www.ijedr.org)3433
FIG 5.: Sp. Tensile Strength Vs Percentage Wt of SlagFlexural Strength Vs Percentage Wt of Slag
The flexural strength versus percentage weight of Slag is shown in the figure 5.7. The flexural strength reached a maximum value at 20%. The flexural strength at 20% weight of lime sludge is 104.3784 MPa. The flexural strength at 15% weight of slag is 88.145 Mpa. The flexural strength at 10% weight of slag is 83.205Mpa. The values of flexural strength and percentage weight of Slag is given in table
Fig:6. Flexural Strength Vs Percentage Wt of Slag
Specific Flexural Strength Vs Percentage Weight of Slag
Table:9 Specific Tensile Strength Vs Percentage Weight of Slag
percentage wt of Slag 0% 5% 10% 15% 20%
SpTensile strength(Mpa/kgm-3) 0.1114 0.0741 0.0615 0.0681 0.0759
Fig: 7. Specific Tensile Strength Vs Percentage Weight of Slag
Impact strength Vs Percentage Weight of Slag
Table 10 Impact strength Vs Percentage Weight of Slag percentage wt of Slag 0% 5% 10% 15% 20% Impact strength(Nm/mm2) 0.0017 0.0021 0.002 0.0045 0.0076
Fig: 8. Impact strength Vs Percentage Weight of Slag
Tensile Strength Vs Percentage Weight of Slag
Tab: 11.Tensile Strength Vs Percentage Weight of Slag
percentage wt of Slag 0% 5% 10% 15% 20%
IJEDR1404011
International Journal of Engineering Development and Research (www.ijedr.org)3434
Fig: 9. Tensile Strength Vs Percentage Weight of SlagSpecific Flexural Modulus Vs Percentage Weight of Slag
Tab: 12. Specific Flexural Modulus Vs Percentage Weight of Slag
percentage wt of Slag 0% 5% 10% 15% 20%
SpFlexuralModulus(Epoxy) 2.7281 2.367 1.904 2.345 2.417 SpFlexuralModulus(Polyster) 2.44516 2.281 2,2508 2.301 1.936
FIG10: Specific Flexural Modulus Vs Percentage Wt of Slag
Impact strength Vs Percentage Weight of Slag
Tab: 13. Impact strength Vs Percentage Weight of Slag percentage wt of Slag 0% 5% 10% 15% 20% Impact strength(Epoxy) 0.0017 0.0021 0.002 0.0045 0.0076 Impact strength(Polyster) 0.0022 0.0018 0.0011 0.0034 0.0052
IJEDR1404011
International Journal of Engineering Development and Research (www.ijedr.org)3435
Fig: 12 The above image is imported from Pro-e to Ansys using IGES (Initial Graphical Exchange Specification) format Meshed model:Fig: 13The above image is showing meshing is used to divide the problem into number of small problems and also to apply the material and element properties
Loads applied
. Fig: 14 loads acting on spring Displacement:
Fig: 15 The above image is showing distributed shape or variation of geometry shape after applying loads. The maximum displacement is 3.588 mm.
Von-Mises Stress:
Fig: 16The above image is showing vonmises stress value. Vonmises stress depends on vonmises theory of failure. E-glass with 20% iron
IJEDR1404011
International Journal of Engineering Development and Research (www.ijedr.org)3436
Fig: 17 The above image is showing distributed shape or variation of geometry shape after applying loads. The maximumdisplacement is 2.445 mm Von-mises stress:
Fig: 18 The above image is showing vonmises stress value. Vonmises stress depends on vonmises theory of failure.
S-glass epoxy:
Displacement:
Fig: 19 The above image is showing distributed shape or variation of geometry shape after applying loads. The maximum displacement is 2.984 mm.
Von-mises stress:
Fig: 20 The above image is showing vonmises stress value. Vonmises stress depends on vonmises theory of failure. S-glass epoxy with 20% iron:
Displacement:
Fig: 21 The above image is showing distributed shape or variation of geometry shape after applying loads. The maximum displacement is 2.199 mm.
IJEDR1404011
International Journal of Engineering Development and Research (www.ijedr.org)3437
Fig: 22 The above image is showing vonmises stress value. Vonmises stress depends on vonmises theory of failure. By observing the above results we conclude that s-glass with 20% iron is better.III. CONCLUSION
Tensile, Flexural and impact tests are conducted on specimen in different compositions of Slag for epoxy and polyster . From the tensile and flexural test young’s modulus of the specimen for different compositions are calculated. It can be observed that the young’s modulus of the specimen get improved by reinforcing Slag.
There is an increase in tensile and flexural properties up to 20% by reinforcing slag.. Impact properties gradually decreased by increase in weight of Slag.
By using the mixture of cement and Slag as a reinforcing material the mechanical properties of the specimen increased.
IV. SCOPE FOR FUTURE EXPERIMENTATION
Cement can be varied in different proportions for improving the mechanical properties of the specimen.
Some other particulates like granite powder or any other industrial waste can be added for improving the mechanical behaviour
The impact strength can be raised by improving the fineness of the particulate powder.
Other tests like wear resistance test, die electric test can also be conducted to study mechanical behaviour.
REFERENCES
[1] Alok Satapathy, Amar patnaik, “Analysis of dry sliding behavior of red mud filled polyester composites using taguchi method”
[2] Pongdhorn sae-oui , Chakrit Sirisinha , Uthai Thepsuwan , kannika Hattapanit. “Roles of Silane coupling agents on properties of silica filled polycholoroprene”
[3] P.Mareri, S.Bastide, N.Binda, & A.Crespy “Mechanical behavior of poly propylene composites cantaining fine mineral filler: effect of filler surface treatment”
[4] H. Weibeck, D.F. borrely, C. Xavier, “The effect of silane coupling agent on a composite polyamide-6/talc”, Barz. J. Chem, Eng. Vol. 15 n.4 Sao Paulo Dec 1998.
[5] T. Chaowasakoo, N. Sombatsompop, “ Mechanical and morphological of fly/epoxy composites using conventional thermal and microwave curing methods”, composites science and technology 67(2007) 2282-2291.
[6] Soon-Chul Kwon, Tadaharu Adachi, Wakako Araki, Akihiko Yamaji, “ Effect of composing particles of 2 sizes on mechanical properties of spherical silica-particulate reinforced epoxy composites”.
[7] Zhu, S. Schmauder, “ Prediction of failure properties of short fiber reinforced composites with metals and polymer matrix”. [8] I.H. Tavman, “ Thermal and mechanical properties of copper powder filled poly(ethylene) composites”.
[9] H. Ku, W. Jacobson, M. Trada, F. Cardona, D. Rogers “ Tensile tests of formaldehyde SLG reinforced composites: Pilot study”, journal of composite materials, vol.42, No.26/2008.
[10] S.F. Hassan and M. Gupta “ Effect of Nano-ZrO2 particulates reinforced on microstructure and mechanical behavior of solidification processed elemental Mg”, journal of composite material, Vol.41, No. 21/2007.
[11] Alvarez, A. Vazquez and O. De La Osa, “ Cyclic Water Absorption Behavior of Glass-vinylester and glass-epoxy composites”, journal of composite materials, Vol.41, No. 10/2007.
[12] M.A. Aboudzadeh. S.M. Mirabedini, M. Atai, “ Effect of silane based treatment on the adhesion strength of acrylic lacquers on the PP surfaces”.
[13] Pongdhorn Sae-oui, Chakrit Sirisinha, Uthai Thepsuwan, Kannika Hatthapanit “ Roles of silane coupling agents on properties of Silica- filled Poychloroprene”