ABSTRACT
SHRIVASTAVA, RACHIT. Building a Large Display Interface for Manual Labeling & Classification in Machine Learning Training. (Under the direction of Benjamin Watson.)
© Copyright 2018 by Rachit Shrivastava
Building a Large Display Interface for Manual Labeling & Classification in Machine Learning Training
by
Rachit Shrivastava
A thesis submitted to the Graduate Faculty of North Carolina State University
in partial fulfillment of the requirements for the Degree of
Master of Science
Computer Science
Raleigh, North Carolina 2018
APPROVED BY:
Andrew Rhindos Patrick FitzGerald
DEDICATION
BIOGRAPHY
ACKNOWLEDGEMENTS
I would like to thank my my mother, father and sister for their constant support and encouragement. I would also like to thank North Carolina State University and James B. Hunt Jr. Library for giving me an opportunity and providing me resources to pursue academic excellence.
I would like to extend my gratitude to Dr. Benjamin Watson for giving me this opportunity to work on this exciting project. It’s because of his constant feedback and guidance that I was able to make the prototype for an immersive interface and complete this research. I would also like to thank Andrew Rhindos and Patrick FitzGerald for consenting to being a part of my thesis committee.
I would to thank James Herrick and Patrick Cronin from Institute of Emerging Issues, NCSU for lending me with the Surface Table to test my prototype.
TABLE OF CONTENTS
LIST OF FIGURES. . . vi
Chapter 1 INTRODUCTION . . . 1
1.1 Proposed Solution . . . 2
Chapter 2 RELATED WORK. . . 3
2.1 Machine Learning Training Process . . . 3
2.1.1 The Data Labeling Problem . . . 4
2.2 Qualitative Coding . . . 4
2.3 Immersive Interfaces . . . 5
2.4 Tangible UI . . . 7
Chapter 3 ML TRAINING INTERFACE . . . 9
3.1 QC-ML Interaction . . . 9
3.2 Interface Design . . . 11
3.2.1 Model Visualization . . . 11
3.2.2 Derived Data . . . 12
3.2.3 Data Display . . . 12
3.2.4 Classification Interaction . . . 12
3.3 Tools & Technology . . . 12
3.4 QC-ML Prototype Interface . . . 13
3.5 Input/Output Assumptions . . . 23
3.5.1 Input JSON Data Format . . . 23
3.5.2 Output JSON Data Format . . . 23
Chapter 4 EVALUATION . . . 27
4.1 Study Process . . . 27
4.1.1 Participants . . . 27
4.1.2 Data Preparation . . . 28
4.1.3 The Study . . . 28
4.2 Results . . . 30
4.2.1 Positive Comments . . . 31
4.2.2 Negative Comments . . . 31
4.3 Inference from study comments . . . 32
Chapter 5 FUTURE WORK & DISCUSSION . . . 35
Chapter 6 CONCLUSION. . . 37
Bibliography . . . 38
APPENDIX . . . 40
LIST OF FIGURES
Figure 2.1 Qualitative Coding Methods[Sal16] . . . 5
Figure 2.2 Manual Coding using Post-its on Tabletop . . . 6
Figure 2.3 Interactive Tabletops used as a collaboration tool . . . 6
Figure 2.4 Pinch-Zoom vs Conventional GUI Buttons . . . 7
Figure 2.5 TUI GUI Interaction Model[Ish08b]. . . 8
Figure 3.1 Possible Interface for a QC structured ML as proposed by[CW] . . . 11
Figure 3.2 Affinity Mapping . . . 13
Figure 3.3 Digital cards/post-its . . . 14
Figure 3.4 Home Screen . . . 15
Figure 3.5 Classification Categories - The Classification Board . . . 16
Figure 3.6 Detailed Description on Post-Its/Cards . . . 17
Figure 3.7 ML Training Progress Bar . . . 17
Figure 3.8 Total Machine Learning Training Progress . . . 18
Figure 3.9 Inter-Coder Agreement Matrix . . . 18
Figure 3.10 Codebook . . . 19
Figure 3.11 History . . . 20
Figure 3.12 History - Undo . . . 20
Figure 3.13 Information Button . . . 21
Figure 3.14 An Early Moment in ML Training . . . 22
Figure 3.15 The prototype running on a Microsoft Surface Table. . . 22
Figure 3.16 The prototype running on a large wall display. . . 23
Figure 3.17 Input JSON example . . . 25
Figure 3.18 Output JSON example . . . 26
Figure 4.1 A Traditional Spreadsheet Interface . . . 28
Figure 4.2 The Evaluation Process . . . 29
Figure 4.3 Participants average familiarity with different aspects of the study . . . 31
Figure 4.4 Ratings for both the interfaces by the 7 participants . . . 33
Figure 4.5 Average Ratings for both the interfaces by the 7 participants . . . 33
Figure 4.6 Representation of Number of labels agreed upon by the participants with the two interfaces vs Number of participants agreeing . . . 34
Figure 4.7 A pre-subtracted unanimity amongst participants . . . 34
CHAPTER
1
INTRODUCTION
to easily label and classify data, thereby making ML more trainable, understandable, reliable and explainable, and greatly broadening its use case.
1.1
Proposed Solution
Our goal is increase the utility and accessibility of ML classifiers by making interaction with them straightforward and efficient enough to allow domain experts to train them, and to explain their results to their peers. To achieve this, we will hide algorithmic detail with interaction based on Qualitative Coding (QC)[Sal16]and focused around data. QC is a research method used for decades by the humanities and behavioral sciences to extract meaningful information from non-numeric data such as text, videos or imagery.
To meet this goal, we created an application based on QC methodology that would ease this la-beling process and provide qualitative feedback to domain expert trainers. The application not only makes labeling easy and even fun but also provides feedback to the trainer on how much of the data they have labeled and how their work compares to other trainers.[Stu07]paper discusses the impor-tance of having feedback in the ML training process and how it help trainers to collaborate effectively.
In the subsequent chapters I will introduce you to machine learning training, how ML algorithm
training takes place, and the role our prototype plays in the entire process. We will introduce
qualita-tive coding, and explain how we make use of its methodology in our prototype to support interaction between non-ML experts and ML algorithms during training. We’ll also discuss different alternative
UI technologies, including immersive and tangible interfaces, their use cases and how they’re helpful in creating rich, collaborative applications. This thesis also portrays our entire process in creating a
CHAPTER
2
RELATED WORK
This chapter describes some of related work in the field of interaction for Machine Learning Training. It also provides evidence of work towards development of a user feedback-driven ML model in some form, along with some insights about Qualitative Coding, Immersive and Tangible Interfaces, and how these technologies can be used to create a natural dialog between the domain experts and the ML Algorithm.
There has been little research into resolving the communication gap between domain experts and ML algorithms. Simone Stumpf and colleagues carried out a think-aloud study asking ML users to provide feedback to the explanations of machine learning predictions to help it improve[Stu07]. Users provided suggestions for re-weighting of features, some even proposed adding new features, feature combinations, relational features, and wholesale changes to the learning algorithm.
2.1
Machine Learning Training Process
A complete ML scenario starts with a problem to be solved and ends with a mechanism or an algorithm that can make predictions about new instances of similar data. In this thesis our focus is on supervised learning (with manually labeled examples). ML in general involves certain stages, details of which have been mentioned in the Appendix-A[Gar15],
• Model Development and Training • Model Testing and Deployment
The first stage is collection of data from various resources. Next comes removal of redundant data, transformation of data per requirements (eg. normalization of numeric data to a common scale), and most importantly in our context, data labeling, by asking domain experts to make judgments about the unlabeled data. Some of this labeled data is used to train the model, which predicts labels by fitting complex functions to data features. The model is then evaluated by comparing the results produced by the model and the remainder of the labeled data.
2.1.1 The Data Labeling Problem
A crucial ingredient for machine learning is labeled data. Unfortunately manual labeling of ML data is tedious, especially when the trainer is not familiar with ML algorithms. Labeling lacks an interface that could help non-ML trainers perform their task data easily. There have been certain applications which help domain experts to cluster these datasets, but few have built interfaces supporting labeling. One such application is mentioned in[FO03], it also refers to the training problem itself:
https://www.oreilly.com/ideas/creating-large-training-data-sets-quickly.
2.2
Qualitative Coding
QC is a manual classification method widely used in the humanities and behavioral sciences. It has been used as a tool to extract meaningful information from non-numeric data such as text, videos or images for decades. Let’s consider some of the common terms used in QC. Users are referred to as ’Coders’ and a ’Code’ is mostly a word or short phrase that symbolically assigns a summative, salient, essence-capturing, and/or evocative attribute for a portion of language-based or visual data[Sal16]. Coders work independently in a highly iterative process to review data, label it with codes, group these codes into categories, draw themes from categories, and finally build theory from themes.
The first cycle of QC coding labels data with codes. Here researchers or domain experts perform high-volume work, making few high level inferences. The remainder of the process is second cycle coding, during which researchers group the codes into different categories and generate theoretical conclusions based on the patterns found from first cycle, Figure 3.1.
Figure 2.1Qualitative Coding Methods[Sal16]
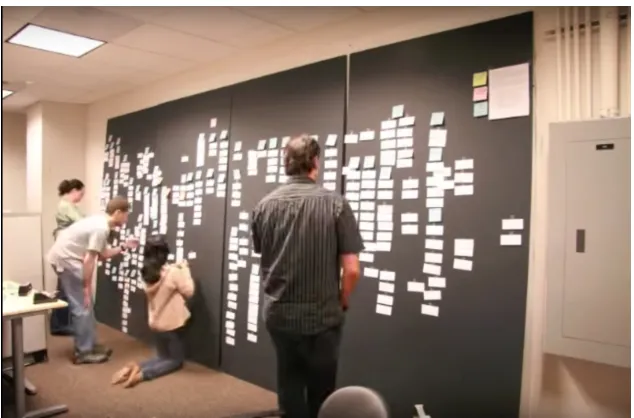
board or table to display the raw data, group it, and label it with codes (Figure 2.2). This offloads much of the cognitive work of recalling and organizing large data collections.
As a very well established methodology for manual data labeling, we believe that QC can form the basis for an effective ML training interface. Christensen and Watson[CW]have discussed this in more detail, we offer our own in depth discussion in the next chapter.
2.3
Immersive Interfaces
Figure 2.2Manual Coding using Post-its on Tabletop
collaborative interaction. Though often overlooked in favor of virtual and augmented reality, these large interfaces are also quite immersive, engaging a fuller range of our senses than traditional desktops.
Figure 2.3Interactive Tabletops used as a collaboration tool
walls and ceiling surrounded a viewer by projected images to provide a viewer-centric perception. [Win01]describes various types of interactive workspaces such as Barehands, PointRight which help users collaborate without using conventional methods. Such systems provides not only touch, but also spatial interactions to the user, increasing user engagement by filling most of their visual field and interacting with more of their body.
Figure 2.4Pinch-Zoom vs Conventional GUI Buttons
Immersive interfaces could enable us to create a digital interface for labeling and categorization of ML data that mirrors the post-it data displays used by QC coders. Sitting around a large tabletop touch display, users might move and group these digital post-its to label corresponding data items. The interface could visualize task completion, monitor their agreement with other coders, offer detail about the data represented by each card, and support annotation about certain data and codes.
2.4
Tangible UI
Tangible user interfaces (TUIs), earlier known as graspable user interfaces, support user interaction with the digital world through a physical media[Ish08a]. Humans tend to grasp and manipulate physical objects much more easily then tapping a flat screen; interaction with a physical object provides immediate sensory feedback to the user. TUIs are generally built from systems of physical artifacts that are digitally coupled with computation.
As an example, Ishii and colleagues developed Urp[Ish08b]and[UI00], an urban planning simulator for modeling the interaction between buildings and their environment, including shadows and wind flow. Urp is an instance of a newMCRpd interaction model (Model-Control-Representation-physical-digital), which differs from the GUI’s well-known Model-View-Controller (MVC) model by renaming the MVC model’s View component to Representation, and dividing it into two parts (Figure 2.5. The first part,physical representations(rep-p) is the physically embodied artifacts, while the second,digital representation(rep-d) is the computationally mediated (e.g. projected) components of TUIs. This model describes several properties of TUIs:
Figure 2.5TUI GUI Interaction Model[Ish08b]
(to themodel).
• Physical representations embody mechanisms for interaction (enablingcontrol).
• Physical representations are perceptually coupled to actively mediated digital representations (rep-d).
• The state of physical representations embodies key aspects of the digital state (themodel). Many TUIs have been developed since the introduction of Tangible Interfaces in early 1990s. Urp[UI99], mediaBlocks[Ull98]and SandScape[Wan02]were some of the initial projects. TUIs have a major limitation: they are tailored for certain applications, and cannot easily be reused for others. Despite this, TUIs can support a wide range of applications, including visualization, education, system management, simulation and construction.
What heuristics should guide the design of a tangible UI? Sharlin, Watson and others suggest three[Sha04]:
• Intuitive spatial mapping to the application.
• Unification of input and output to improve action-perception coupling. • Support for trial-and-error, exploratory tasks, enabling learning.
CHAPTER
3
ML TRAINING INTERFACE
A product’s development life-cycle involves rapid iteration, with frequent design changes. This prototype ML training application was no exception. Improvements made for each iteration in-volved software and hardware constraints, modifications to requirements, as well as software and visualization effectiveness and aesthetics.
This chapter describes some of the design decisions taken, tools and technology used, challenges faced and how we overcame those to arrive at our final prototype application. We also describe how qualitative coding methodology guided the development of an interface for ML labeling, and in particular how that methodology motivated our use of an immersive interface.
3.1
QC-ML Interaction
Our goal is to improve the interface for ML algorithm training, supporting a natural dialog between algorithm and domain experts without ML expertise. Below we describe how QC can help solve many of the problems addressed by Nielsen and Molich’s heuristics[NM90]:
(a) Codebooks.Indexing the codes being used (remember that QC’scodesare ML’slabels). They include the codes themselves, their definitions, inclusion and exclusion criteria, typical examples and boundary cases.
(b) Data Displays.Visualizing coder/labeler work by organizing data tokens on on tables or walls.
(c) Memos.Capturing coder/labeler reasoning: notes about why a data item was coded as it was, and any broader implications.
(d) Histories.Recording item-by-item coding history, permitting rollback of a series of labels that must be redone.
2. Error Correction.Most ML classifiers consider the training data to be correct, but since the data are prepared by humans, error is likely. QC relies on iteration, histories and multiple coders to rectify these errors. In ML labeling, we support histories and multiple expert trainers, and display the classes domain experts define, and plan to visualize data item goodness of fit and model impact.
3. Iteration and Visibility.Qualitative coding limits the number of coding iterations with mea-sures of success such as inter-coder agreement, and by a focus on key examples. Collaborative coding has little value if coding partners cannot code similarly, so QC iteration continues until they do, as measured by percent agreement (similar to ML’s error rate), or improved measures Cohen’s kappa and Krippendorff’s alpha (which account for chance agreement and differences in coding distribution[Gwe01]). Our interface treats ML classifiers as coding partners, assessing manual/automated agreement using these improved measures.
4. Collaboration.Both QC coders and ML domain experts regularly collaborate with peers. In QC, this supported by shared data displays. Similarly, our ML training interface visualizes data being classified by partner domain experts, while inter-coder agreement measures how similarly partners code. Interaction with ML based automated partners will be supported similarly, with data displays permitting experts to compare ML work to their own, inter-coder agreement measures succinctly indicating the similarity of that work, and examples making any differences concrete.
6. Real World System Match.QC often relies on manipulation of physical objects to improve coding, and to monitor its state. As a typical digital technology, ML has never approximated this real world interaction, making it difficult for those without great digital fluency to use ML. Our interface displays data in the form of’Digital Post-its’. To classify data items, an expert simply drags its’Digital Post-it’into the desired color-coded category. By bridging this divide, our interface makes ML more efficient, accessible, and collaborative.
3.2
Interface Design
As we have already noted, qualitative coding (manual classification) has many similarities to machine learning (automated classification). Both involve labeling of data items, and building theories (or models in ML) from the data[Mul16]. We used Christensen and Watson’s idea[CW]that QC’s manual classification experience can be recreated in an immersive interface. They proposed three key elements:Model Visualization, Derived Data, and Data Display.
Figure 3.1Possible Interface for a QC structured ML as proposed by[CW]
3.2.1 Model Visualization
3.2.2 Derived Data
Derived data is obtained through the process of classification. As data is classified, the system builds a classification history, updates inter-coder agreement, and supports label indexing in a codebook. The history can either be stored as the global step-by-step process of training the model, or sorted by the different sets of categories by which the data is being classified. Inter-coder agreement is displayed as a color-mapped matrix, with values determined by Cohen’s kappa or Krippendoff’s alpha[Gwe01]. The codebook automatically compiles a list of all the labels used, and supports both automated and manual explanation of code use with illustrative examples.
3.2.3 Data Display
The data display shows the data items with which the domain expert has been working, and sorts them by class. This is the workspace where experts classify uncategorized labels interactively. As in QC, labels can be predetermined or generated by experts on the fly.
3.2.4 Classification Interaction
Christensen and Watson[CW]suggest that training interaction might follow these steps. The expert:
• Determines the label for a data item by going to its detailed view and understanding the item’s features.
• Assigns a label to the item by dragging it to a category.
• The model visualization updates automatically, reflecting both the labeling of the data item itself, and the effect of that training on the ML model.
• Derived data also updates automatically. The history now shows the latest classification. The inter-coder agreement matrix is updated slightly by that classification. If the last classification introduced a new label, it is added to the codebook.
3.3
Tools & Technology
Our prototype ML training UI was therefore developed using a range of web technologies including HTML5, CSS3 and JavaScript (JS). Some of the JS libraries that we explored during the prototyping of this large screen interface were:
• React • BootStrap 4
• d3 • p5
• CreateJS • node
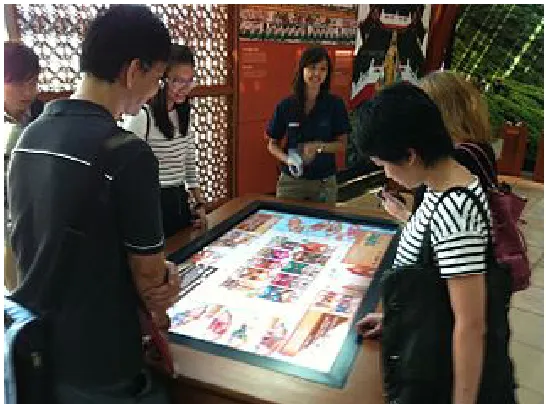
To recreate the physical experience of qualitative coding using cards or Post-Its, we tested our software on a Microsoft Surface Table, in particular Samsung’s Interactive Display SUR40, a large screen, tabletop, touch-enabled display.
3.4
QC-ML Prototype Interface
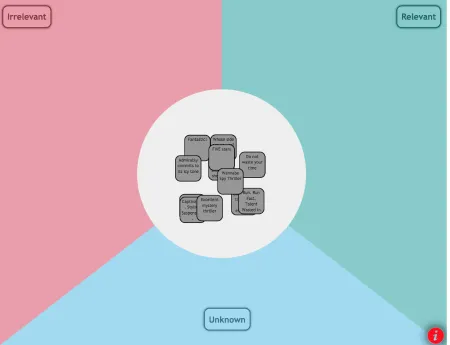
Christensen and Watson[CW]propose a structure for QC-enabled ML interfaces, as seen in Figure 3.1. This section describes the layout and features of the QC-enabled, immersive prototype interface we developed. In particular, the interface simulates the physical setup QCcodersuse while labeling (i.e. Affinity Mapping, Figure 3.2).
Figure 3.2Affinity Mapping
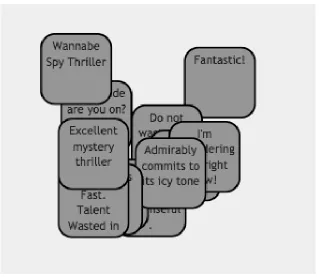
Figure 3.3Digital cards/post-its
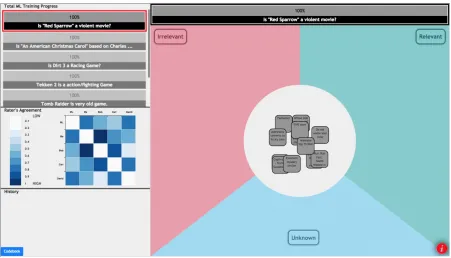
Figure 3.4 shows an overview of our QC-enabled UI. It is a home screen consisting of four major sections: theclassification board(approximating QC’s data display), theinter-coder agree-ment visualizationandhistory(both part of QC’s derived data), andML training progress(model visualization).
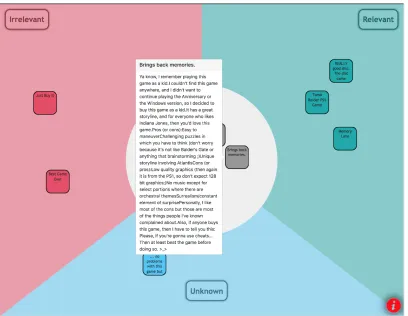
The classification board is equally divided into a pie structure (Figure 3.5), with one “slice” per data category/class. Each category has a distinct color. As domain expert trainers move a data item into a pie slice, it is classified and takes on the category’s color (Figure 3.6), while the prototype updates the ML training progress bars (Figure 3.7). For example, in the given figure, we have four categories, namely Unclassified (in Gray), Irrelevant (in Red), Relevant (in Green) and Unknown (in Blue). At the initial load, the data items to be classified appear as digital Post-Its/cards in the center unclassified section of the classification board.
Tapping on the digital Post-Its (Figure 3.6) provides domain experts with a pop-up describing the corresponding data item features in detail. Normally, the post-it merely displays is a brief heading/summary of this information.
Figure 3.4Home Screen
in the classification board, and again represent the categories in the current set.
The set of stacked bars in Figure 3.8 shows ML training progress made by all collaborating domain experts across all category sets, defined here by several questions against the data). The current category set is highlighted with the red-marked border. A simple swipe up or down scrolls through category sets/questions. Tapping on any progress bar brings that question in the current view and populates all of its label into the staging area.
The matrix in Figure 3.9 displays inter-coder (or inter-rater) agreement, such as Cohen’s kappa or Krippendoff alpha, and is used to evaluate the robustness of the data labeling. Each entry in the matrix specifies the agreement between twocodersor domain experts working on the same data, with white indicating strong agreement, and darker blues indicating disagreement. We have also shown the machine learning algorithm as one of the raters in order to evaluate its agreement with domain experts. To avoid biasing domain experts, the matrix isnotupdated after every data item classification. Instead, it is updated infrequently (e.g. at 10 minute intervals).
Figure 3.10 shows the codebook, an index of the codes used in classification. Each entry includes the code itself, its definition, inclusion and exclusion criteria, as as well as typical examples and boundary cases.
Figure 3.6Detailed Description on Post-Its/Cards
Figure 3.8Total Machine Learning Training Progress
a stack sorted in reverse temporal order, with the most recent move listed first. Each category set (here defined by a question against the data) has its own history stack maintained throughout the session.
Figure 3.11History
Figure 3.12 shows the undo option available for the domain expert users for each move in the history. This helps them remove an entry made through the classification process. This is particularly helpful when hundreds of data items have been classified, making it difficult to locate that item in the classification board. Ultimately, the history might also offer a rollback function, undoing all classifications after a certain point in time.
A small button on the right bottom corner of the ML training UI (Figure 3.13) introduces each section of the interface.
Figure 3.13Information Button
Figure 3.14An Early Moment in ML Training
Figure 3.16The prototype running on a large wall display.
3.5
Input
/
Output Assumptions
Our ML training prototype accepts input and produces output in JSON files using our own custom format. This might later be customized to function with ML training APIs such as IBM Watson’s Discovery. For example, the Discovery API provides information one data item at a time; this could be used to retrieve the information for an item, and then it could be reorganized into our own input format.
3.5.1 Input JSON Data Format
Our input JSON format is made up of a unique user id, a count of the different classification categories and a list of their names (their index in the input array corresponds to their unique ids), the category set/questions count, and a detailed description for each question. This description for each category set/question consists of a unique question id, the question itself, number of data items to be labeled for this question and a brief heading and description of each data item. The input JSON format is as displayed inFigure 3.17. Thevaluesarray consists of all the questions required for the training process.
3.5.2 Output JSON Data Format
1
{
2
"id"
: 12345,
3
"classificationCategories"
: 3,
4"categories"
:
[
5
"Relevant"
,
6"Unknown"
,
7"Irrelevant"
8
],
9
"questionsCount"
: 1,
10"values"
:
[{
11
"id"
: 1,
12
"src"
:
"This is a sample question?"
,
13"cardsCount"
: 2,
14
"values"
:
[{
15
"head"
:
"A"
,
16"description"
:
""
17
},
18
{
19
"head"
:
"B"
,
20"description"
:
""
21
}
22
]
23
},
24
{
25
"id"
: 2,
26
"src"
:
"This is second sample question?"
,
27"cardsCount"
: 2,
28
"values"
:
[{
29
"head"
:
"C"
,
30"description"
:
""
31
},
32
{
33
"head"
:
"D"
,
34"description"
:
""
35
}
36
]
37
}
38
]
39
}
1
{
2
"uid"
: 12345,
3"question_id"
: 1,
4"data_id"
: 4,
5
"previous_category_id"
: 0,
6"current_category_id"
: 2
7
}
CHAPTER
4
EVALUATION
This chapter describes our usability evaluation of our immersive, QC-enabled ML training interface. We compared it to a traditional spreadsheet interface using a think-aloud methodology.
"Thinking aloud may be the single most valuable usability engineering method", mentions Jakob Nielsen[Nie94]in his bookUsability Engineering. We used this direct observation approach for evaluating usability for the purpose of this study. We asked participants to think out loud while they performed any task upon the interface. This method is of great use to determine users’ expectations and figuring out good and bad facets of a product.
4.1
Study Process
4.1.1 Participants
4.1.2 Data Preparation
We wanted to keep our questions and labels as simple and familiar, so that our participants would not require an unusual expertise. We therefore chose product review data from Amazon as test data. We used a very small part of the data from[ML13]. It consists of product reviews and meta data from Amazon, including 142.8 million reviews spanning May 1996 - July 2014. We randomly chose seven different movie and computer game products, and formed our own questions against this data, considering what a buyer might ask about each movie or computer game. For example, one question was “Is Dirt 3 a racing game?” We arbitrarily chose 10-15 product reviews for each movie or game as data items for our evaluation. These data were displayed to participants using our prototype large screen UI, as well as a traditional spreadsheet interface (Figure4.1).
Figure 4.1A Traditional Spreadsheet Interface
4.1.3 The Study
qualitative coding (Figure 4.3). The participants were then debriefed the purpose of the study, what the interface does, and what role it plays in the machine learning training process. They shown a small clip of affinity mapping and howcodersuse this technique to classify labels.
Figure 4.2The Evaluation Process
The participants were next asked to work using both interfaces, labeling 10-15 reviews for each of six questions in our Amazon test data. Three participants were given the spreadsheet interface first, and four were given the large screen prototype interface first. This was done to make sure there is no ordering bias in the usability evaluation.
of reviews into categories such as Relevant, Irrelevant, or Unknown with respect to the currently displayed question. We again probed their thinking with questions (listed below). We routinely asked them about their level of interest in the classification process while using both the interfaces. The questions asked to the participants while they were working with the large screen display interface were:
• How can you could find description for each data item?
• What do you infer from the charts at the top?
• How would you compare your results with others?
• Study the notes others have left about their classification work. Tell us what you think those
notes mean.
• Try to undo one of your reviewed labels.
Once the participants classified all the data items for each of the six questions, the study was completed. We learned their general opinion about the large screen interface by interviewing them, asking some more questions such as:
• How would you rate your experience with this interface, can you compare and contrast the two
interfaces you’ve interacted in the past hour?
• What was the most satisfying aspect of the large screen interface?
• What was the least satisfying aspect of the large screen interface?
• What was confusing in the application?
4.2
Results
Recall that participants rated their familiarity on a scale of 1 to 5 (1 being lowest and 5 being highest) with machine learning, usage of large screen touch displays, and qualitative coding. Figure 4.3 shows average familiarity of the participants with each topic. Note that our participants knew very little about qualitative coding.
Figure 4.3Participants average familiarity with different aspects of the study
4.2.1 Positive Comments
• Participants preferred the QC-enabled UI to the spreadsheet
• They found dragging and dropping cards much easier than manipulating spreadsheet menus
• Participants found our QC-enabled interface more engaging (fun, game-like) than spread-sheets
• The sounds our interface made after classification of each card was satisfying to participants • Participants appreciated being able to control the level of information depicted for each data
item in our interface
• Participants found our interface’s consistent color coding of categories in data display, visual-ization and history useful
• They found our directional "pie" interaction useful
4.2.2 Negative Comments
• Participants found our interface overwhelming at first. However, they did seem to gain famil-iarity with it quickly.
• Participants expected to see a heading/title at the top of our interface. This expectation may come from more complex applications with multiple screens; ours only has one.
• Participants didn’t notice the codebook. It was displayed minimally with a small button lower left. We might call it out along with other interface elements when users press the information button (lower right). Also, in even larger displays, we might display it continuously.
• Several participants noted that the undo option in the history section seemed redundant, given the ease of undoing individual classifications in the classification board. Because our experiment used a very small dataset, they may not have appreciated the value of the history to rollback changes in larger datasets.
4.3
Inference from study comments
Participants rated their overall experience with the interfaces on a scale of 1 to 5, where 1 was the worst and 5 was the best. The average rating given by the seven participants for our QC-enabled interface was4.0as compared to2.1for the traditional spreadsheet interface (Figure 4.5).
We received both positive and negative comments on our interface design and usability. The interface was appreciated for its aesthetics, but the participants failed to understand the importance of certain sections such as the undo option in history, and inter-coder agreement. They considered these two features as unnecessary and biasing respectively. Since these participants were not familiar with qualitative coding (see Figure 4.3), their appreciation of these interface elements may have been limited.
Addressing the participants concern with undo, they believed that undo could be easily per-formed by dragging back the data item from its current location to its previous one. Only one participant pointed out a convincing use case for undo, that it would be a helpful feature when there was a large number of post-its on the screen: one could easily go through history and do the needed rollback, while searching for data items in a big pile would be difficult. Indeed, the undo feature is similar to version control, it helps to bring back the state of the machine learning training process to a desired one, in cases of any wrongly trained data.
Another section that went unnoticed was the codebook. We often had to point it out to par-ticipants, but once they saw what was mentioned in the codebook, they understood how they could make use of it to classify data items. Thereafter, we observed that participants would visit the codebook before beginning classification with each question/set of categories.
Figure 4.4Ratings for both the interfaces by the 7 participants
Figure 4.5Average Ratings for both the interfaces by the 7 participants
such as one participant who was more disposed towards using the spreadsheet, overall this trend held true.
Figure 4.6Representation of Number of labels agreed upon by the participants with the two interfaces vs Number of participants agreeing
CHAPTER
5
FUTURE WORK & DISCUSSION
Our prototype was tested with a single static dataset, and was not coupled to any interactive ML algorithm. Future work might connect our front-end interface to such an algorithm, for example using Watson’s IBM Watson Discovery API.
Our prototype user interface works well for large screens or table top displays. A further improve-ment in this interface would transform it from touch to a tangible. Today’s touch user interfaces are ironically named, since they offer neither physical objects to manipulate, nor different textures to feel. Feedback through a touch interface is merely a digital one. Adding true tangibility to our UI should make it more intuitive and delightful.
CHAPTER
6
CONCLUSION
Our work addresses the need for an improved interface for ML training. We observed that ML Training lacks an intuitive UI, and described the need of such an interaction. We advocated ways for improving the classification and labeling for Machine Learning training data by implementation of a user interface. Qualitative coding played an important role in determining the design of this user interface for machine learning training. Some of its methodologies, such as keeping history logs, maintaining codebooks, representing the progress of partners, and data display helped in improving the training process for the domain experts with little knowledge about the underlying Machine Learning Algorithm.
We created a prototype interface for large touch displays, and evaluated it by performing a ’think-out-loud’ usability test with a small group of participants. We received both positive as well as some negative feedback from the participants. We determine that the traditional spreadsheet interface lacks certain features, as the users felt the need of more interaction in making the classification and labeling process painless, understandable by comparing and contrasting it with the large screen display interface. Although the methods of qualitative coding were not of great usefulness to some of our participants, due to their limited knowledge in the field, we believe these methods would be more sensible for domain experts working over the long term.
BIBLIOGRAPHY
[Bol80] Bolt, R. A."Put-that-there": Voice and gesture at the graphics interface. Vol. 14. 3. ACM, 1980.
[CW] Christensen, J. & Watson, B. “Structuring Human-ML Interaction With an Immersive Interface Based on Qualitative Coding” ().
[CN92] Cruz-Neira, C. et al. “The CAVE: audio visual experience automatic virtual environment”.
Communications of the ACM35.6 (1992), pp. 64–73.
[Ded09] Dede, C. “Immersive Interfaces for Engagement and Learning”.Science323.5910 (2009), pp. 66–69. eprint:
http://science.sciencemag.org/content/323/5910/66.
full.pdf
.[FO03] Fails, J. A. & Olsen Jr., D. R. “Interactive Machine Learning”.Proceedings of the 8th International Conference on Intelligent User Interfaces. IUI ’03. Miami, Florida, USA: ACM, 2003, pp. 39–45.
[Gar15] Garreta, R.A Gentle Guide to Machine Learning @ONLINE. 2015.URL:
https://monkeylearn.
com/blog/gentle-guide-to-machine-learning/
.[Goo17] Google.Progressive Web Apps. 2017.URL:
https://developers.google.com/web/
progressive-web-apps/
(visited on 05/08/2018).[Gwe01] Gwet, K. “Handbook of inter-rater reliability: How to estimate the level of agreement between two or multiple raters”.Gaithersburg, MD: STATAXIS Publishing Company
(2001).
[Ish08a] Ishii, H. “Tangible Bits: Beyond Pixels”.Proceedings of the 2Nd International Conference on Tangible and Embedded Interaction. TEI ’08. Bonn, Germany: ACM, 2008, pp. xv–xxv. [Ish08b] Ishii, H. “The Tangible User Interface and Its Evolution”.Commun. ACM51.6 (2008),
pp. 32–36.
[ML13] McAuley, J. & Leskovec, J. “Hidden Factors and Hidden Topics: Understanding Rating Dimensions with Review Text”.Proceedings of the 7th ACM Conference on Recommender Systems. RecSys ’13. Hong Kong, China: ACM, 2013, pp. 165–172.
[Mit97] Mitchell, T. M. et al. “Machine learning. 1997”.Burr Ridge, IL: McGraw Hill45.37 (1997), pp. 870–877.
[Mye00] Myers, B. et al. “Past, present, and future of user interface software tools”.ACM Transac-tions on Computer-Human Interaction (TOCHI)7.1 (2000), pp. 3–28.
[Ni06] Ni, T. et al. “A survey of large high-resolution display technologies, techniques, and applications”.Virtual Reality Conference, 2006. IEEE. 2006, pp. 223–236.
[Nie94] Nielsen, J.Usability engineering. Elsevier, 1994.
[NM90] Nielsen, J. & Molich, R. “Heuristic Evaluation of User Interfaces”.Proceedings of the SIGCHI Conference on Human Factors in Computing Systems. CHI ’90. Seattle, Washing-ton, USA: ACM, 1990, pp. 249–256.
[Sal16] Saldaña, J.The coding manual for qualitative researchers. Sage, 2016.
[Sha04] Sharlin, E. et al. “On tangible user interfaces, humans and spatiality”.Personal and Ubiquitous Computing8.5 (2004), pp. 338–346.
[Stu07] Stumpf, S. et al. “Toward Harnessing User Feedback for Machine Learning”.Proceedings of the 12th International Conference on Intelligent User Interfaces. IUI ’07. Honolulu, Hawaii, USA: ACM, 2007, pp. 82–91.
[UI00] Ullmer, B. & Ishii, H. “Emerging frameworks for tangible user interfaces”.IBM Systems Journal39.3.4 (2000), pp. 915–931.
[Ull98] Ullmer, B. et al. “mediaBlocks: physical containers, transports, and controls for online media”.Proceedings of the 25th annual conference on Computer graphics and interactive techniques. ACM. 1998, pp. 379–386.
[UI99] Underkoffler, J. & Ishii, H. “Urp: a luminous-tangible workbench for urban planning and design”.Proceedings of the SIGCHI conference on Human Factors in Computing Systems. ACM. 1999, pp. 386–393.
[Wan02] Wang, Y. et al. “SandScape”.Home page at http://tangible.media.mit.edu/projects/ Sand-Scape/SandScape.htm(2002).
[Wei93] Weiser, M. “Some computer science issues in ubiquitous computing”.Communications of the ACM36.7 (1993), pp. 75–84.
[WW11] Wigdor, D. & Wixon, D.Brave NUI world: designing natural user interfaces for touch and gesture. Elsevier, 2011.
APPENDIX
A
BEGINNER’S GUIDE TO ML
The bookMachine Learningby Tom Mitchell[Mit97]offers this definition of machine learning: "A computer program is said to learn to perform atask Tfromexperience E, if its performance at
task T, as measured by aperformance metric P, improves with experience E over time." Suppose an algorithm has been given image and is asked to determine if it has a particular person’s face in it (task T). It could learn by comparing the images that have the person’s face to those that do not (experience E). The algorithm’s performance (P) could be measured as the percentage of new images that the algorithm correctly identifies.
Machine Learning has many real world applications, including image processing, data mining, video games and analyzing text data. The ability of a self-driving car to process the images of road signs/blocks or other vehicles or people moving nearby comes from an ML algorithm that detects these objects. Facebook recognizes you in an uploaded image using an ML algorithm which learns from your previous tagged images. ML algorithms enable the characters in a video game to move around the environment without colliding with each other. Spam filtering, detecting fraudulent transactions from banks/cards, and recommending products on e-commerce sites are other ML applications.
Figure A.1Machine Learning Process
way training examples are fed into the algorithms, how it uses them and the type of problems they solve. For supervised learning, you feed in the inputs and provide a corresponding target to train the algorithm, so that when test input is submitted algorithm provides a target output after sufficient training. Whereas, unsupervised learning is when you are training your machine learning task only with a set of inputs which will be able to find the structure or relationships between different inputs. In this thesis and QC-enabled interface development, we focus on supervised learning.
The entire process for ML is not automated, most of it involves human collaboration to reach to the designated solution. The steps are[Gar15],
1. Data (or Feature) Exploration and Preparation
This is the stage in which data is collected to be used to represent as training and test examples. For example with a self-driving car, data might be objects in the camera frame, distance to each object, and type of object, including road signs, traffic cameras, etc.
2. Data (or Feature) Preprocessing
Here, redundant data is removed and only required data is kept for the training the algorithm. Only the important features are extracted and transformed to meet the requirements of the algorithm to be trained.
3. Model Development and Training
the better results you may get. In the process a model develops capable of predicting labels for other input values.
4. Model Testing and Deployment
This phase is completely automated, with the model validated against a new and labeled set of test data. The performance is measured in terms of the accuracy of the data correctly identified by the algorithm.
![Figure 2.1 Qualitative Coding Methods [Sal16]](https://thumb-us.123doks.com/thumbv2/123dok_us/1254553.1158062/13.612.146.482.78.359/figure-qualitative-coding-methods-sal.webp)

![Figure 2.5 TUI GUI Interaction Model [Ish08b]](https://thumb-us.123doks.com/thumbv2/123dok_us/1254553.1158062/16.612.134.495.76.229/figure-tui-gui-interaction-model-ish-b.webp)
![Figure 3.1 Possible Interface for a QC structured ML as proposed by [CW]](https://thumb-us.123doks.com/thumbv2/123dok_us/1254553.1158062/19.612.171.456.339.507/figure-possible-interface-qc-structured-ml-proposed-cw.webp)