Neuro Fuzzy Classification and Detection Technique for Bioinformatics Problems
Mohd Fauzi bin Othman
1, Thomas Moh Shan Yau
Control and Instrumentation Department, Faculty of Electrical Engineering,
Universiti Teknologi Malaysia, Skudai, Malaysia
[email protected]
Abstract
Bioinformatics is an emerging science and technology which has lots of research potential in the future. It involves multi interdisciplinary approaches such as mathematics, physics, computer science and engineering, biology, and behavioral science. Computers are used to gather, store, analyze as well as integration of patterns and biological data information which can then be applied to discover new useful diagnosis or information. In this study, the focus will be directed to the classification or clustering techniques which can be applied in the bioinformatics fields based on the Sugeno type neuro fuzzy model or ANFIS (Adaptive Neuro Fuzzy Inference System). It is very important to identify new integration of classification or clustering algorithm especially in neuro fuzzy domain as compared to conventional or traditional method. This paper explores the suitability and performance of recurrent classification technique, Fuzzy C Means (FCM) act as classifier in neuro fuzzy system compared to subclustering method. A package of software based on neuro fuzzy model (ANFIS) has been developed using MATLAB software and optimization were done with the help from WEKA. A set diabetes data based on real diagnosis of patient will be used.
1. Introduction
The focus and the main objectives of this study will be on the classification technique for bioinformatics problems in the context of neuro fuzzy system (ANFIS) domain. A major problem in bioinformatics analysis or medial science is attaining the correct diagnosis of certain important information. For the ultimate diagnosis, normally, many tests generally involve clustering or classification of large scale data. All of these test procedures are said to be necessary in order to reach the ultimate diagnosis. However on the other hand, too many tests could complicate the main diagnosis process which could then lead to difficulty in
have prompted the study on the classification or clustering technique to be carried out with ANFIS (Adaptive Neuro Fuzzy Inference System) model which performs the role as a classifier in bioinformatics field.
Bioinformatics and computational biology involve the use of techniques including applied mathematics, informatics, statistics, computer science, chemistry and biochemistry to solve biological based problems. The early definition of bioinformatics and computational biology are rooted in life sciences as well as computer and information sciences and technologies. According to the National Institute of Mental Health released on July 17, 2000 [1], bioinformatics is defined as research, development, or application of computational tools and approaches for expanding the use of biological, medical, behavioral or health data, including those to acquire, store, organize, archive, analyze, or visualize such data. Meanwhile, Computational Biology is defined as the development and application of data-analytical and theoretical methods, mathematical modeling and computational simulation techniques to the study of biological, behavioral, and social systems. Bioinformatics and computational biology each maintain close interactions with life sciences to realize their full potential.
b
i i A
a
c
x
x
21
1
)
(
−
+
=
µ
2. Literature Review
2.1Adaptive Neuro Fuzzy Inference System (ANFIS)
A general review of the history and introduction to neuro-fuzzy models has been given by Brown [2,3] and Irwin, Warwick and Hunt [4]. Detlef Nauck, Frank Klawonn and Rudolf Kruse [6] and J. S. R. Jang, C. T. Sun and E. Mizutani [5] have details reviews on the ANFIS (Adaptive Neuro Fuzzy Inference System) model. A neural-fuzzy system is a combination of neural networks and fuzzy systems in such a way that neural networks or neural networks algorithms are used to determine parameters of fuzzy system. This means that the main intention of neural-fuzzy approach is to create or improve a fuzzy system automatically by means of neural network methods.
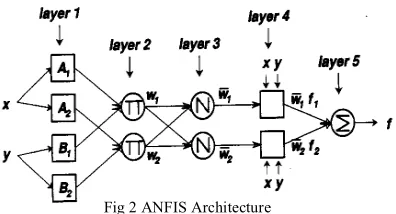
Adaptive neuro fuzzy inference system basically has 5 layer architectures and each of the function is explained in detail below:
Layer 1 Every mode in this layer is an adaptive node with a node function where x (or y) is the input to node
I and Ai (or Bi-2) is a linguistic label and O1,I is the membership grade of fuzzy set A ( = A1, A2, B1 or B2) and it specifies the degree to which the given input x
(or y) satisfies the quantifier A. The membership function for A can be parameterized membership function as given in equation 1 or normally known as Bell function and {ai, bi, ci} is the parameter set
(1)
),
(
,1
x
O
i=
µ
Ai for i = 1,2, or),
(
2
,
1
y
O
i B
i
=
µ
− for i = 3,4, (2)Layer 2 Every node in this layer is a fixed node labeled II, whose output is the product of all the incoming signals Each node output represents the firing strength of a rule.
),
(
)
(
,2
w
x
y
O
i
i B
A i
i
=
=
µ
µ
i = 1,2 (3)Layer 3 Every node in this layer is a fixed node labeled N. The ith node calculates the ratio of the ith rule’s firing strength to the sum of all rules’ firing
strengths. outputs of this layer are called normalized firing strengths.
,
2 1 ,
3
w
w
w
w
O
ii i
+
=
=
i = 1,2 (4) Layer 4 Every node I in this layer is an adaptive node with a node function. Where
w
i is a normalized firing strength from layer 3 and {p
i,
q
i,
r
i } is the parameter set of this node. Parameters in this layer are referred to as consequent parameters.
O
4,i=
w
if
i=
w
i(
p
ix
+
q
iy
+
r
i,
(5)Layer 5 The single node in this layer is a fixed node labeled ∑, which computes the overall output as the summation of all incoming signals. Overall output:
i i
i i i i i
i
w
f
w
f
w
O
∑
∑
=
∑
=
1 , 5
(6)
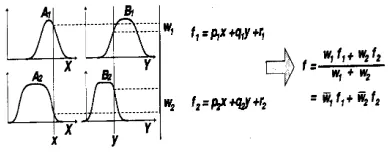
For simplicity, we assume that the fuzzy inference system under consideration has two input x and y and one output z. For a first-order Sugeno fuzzy model [5, 6, 7], a common rule set with two fuzzy if-then rules is the following:
Rule 1: If x is A1 and y is B1, the f1 = p1 x + q1 y + r1, (7) Rule 2: If x is A2 and y is B2, the f2 = p2 x + q2 y + r2.
(8)
Figure 1 illustrates the reasoning mechanism for this Sugeno model where it is the basis of ANFIS model. Subsequently the corresponding equivalent ANFIS architecture is as shown in Figure 2, where nodes of the same layer have similar functions. ANFIS has hybrid learning capability which compromised of back propagation and least square method.
∑
∑
− −
=
Ni m ij N
i i
m ij
j
u
x
u
c
1 1
.
Partition of Data
3872 484
252
2048 Training Data Target Data Checking Data Application data
Fig 2 ANFIS Architecture
2.2 Subclustering Algorithm
This technique is used when there is not a clear idea on how many clusters there should be for a given set of data, subclustering clustering method can be used for estimating the number of clusters and the cluster centers in a set of data [9]. This method is an extension of the Mountain clustering method proposed by Yager [10]. It assumes each data point is a potential cluster center and calculates a measure of the potential for each data point based on the density of surrounding data points. The algorithm selects the data point with the highest potential as the first cluster center and then destroys the potential of data points near the first cluster center. This process of acquiring a new cluster center and destroying the potential of surrounding data points is repeated until the potential of all data points falls below a threshold.
2.3Fuzzy C Means
Fuzzy C-means (FCM) or also known as fuzzy ISODATA is a method of clustering which allows one piece of data to belong to two or more clusters [5,11]. This method is frequently used in pattern recognition [12]. It is based on minimization of the following objective function:
∑∑
− −
∞
≤
≤
−
=
Ni C
j
j i m ij
m
x
c
m
J
1 1
2
1
µ
(9)where m is any real number greater than 1, uij is the degree of membership of xi in the cluster j, xi is the ith of d-dimensional measured data, cj is the d-dimension center of the cluster, and ||*|| is any norm expressing the similarity between any measured data and the center. Fuzzy partitioning is carried out through an iterative optimization of the objective function shown above, with the update of membership uij and the cluster centers cj by equation 10 and 11. This iteration will stop when,
ε
is a termination criterion between 0 and 1, whereas k are the iteration steps. Thisprocedure converges to a local minimum or a saddle point of Jm.
∑
−−
−
−
=
c
k
m
k i
j i ij
c
x
c
x
1
1 2
1
µ
(10)(11)
3. The Data
A practical diabetes data were used in this study. These data are collected based on the diagnosis of patients and are contributed from the Faculty of Computer Science and Information Center, University Technology Malaysia. It has a total of 6172 data or 768 patterns with 8 inputs and 1 output. The data is divided into 3 partitions which are training, checking/validation and application. Training data has 484 patterns, 28 patterns as a validation and the rest (256 patterns) is used for application purposes. Training data means that the data is used for ANFIS training and validation on the other hand, is used to validate the model created. Application data is a collection of untrained data to test the accuracy of the model. The partition of data can be summarized in figure 3 below.
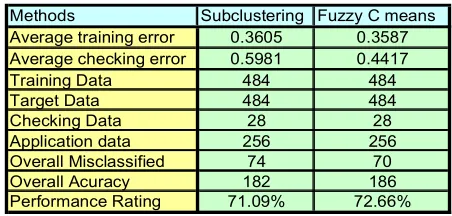
Methods Subclustering Fuzzy C means Average training error 0.3605 0.3587 Average checking error 0.5981 0.4417 Training Data 484 484 Target Data 484 484 Checking Data 28 28 Application data 256 256 Overall Misclassified 74 70 Overall Acuracy 182 186 Performance Rating 71.09% 72.66%
4. WEKA
WEKA is a data mining system developed by the University of Waikato in New Zealand that implements data mining algorithms using the JAVA language. WEKA is a state-of-the-art facility for developing machine learning (ML) techniques and their application to real-world data mining problems. It is a collection of machine learning algorithms for data mining tasks. The algorithms are applied directly to a dataset. WEKA implements algorithms for data preprocessing, classification, regression, clustering, association rules; it also includes a visualization tools. The new machine learning schemes can also be developed with this package. WEKA is open source software issued under General Public License [13].
The data file normally used by Weka is in ARFF file format, which consists of special tags to indicate different things in the data file (foremost: attribute names, attribute types, attribute, values and the data). The main interface in Weka is the Explorer. It has a set of panels, each of which can be used to perform a certain task. Once a dataset has been loaded, one of the other panels in the Explorer can be used to perform further analysis.
5. Methods
There has been quite a number of software developed for the purposes of classification or clustering of bioinformatics data. As for this project, it is intended to apply a new classification technique in Adaptive Neuro Fuzzy Inference System (ANFIS) model. After intensive literature reviews on various classification techniques, conventional or recurrent, fuzzy C means is selected to be used. And this technique will be integrated with ANFIS (Adaptive Neuro Fuzzy System) model by Jang, 1993 [5]. Generally, there are 6 stages involved in the proposed model which are starting from the data input to output and it was developed using MATLAB software. This model requires data management before the classification and neuro fuzzy model phase. Detection phase will follow once the output from the classification technique is done and lastly, performance analysis based on the result will be done at the end of the development phase. A layout of the development phase can be summarized as block diagram below.
Fig. 4 Software Development Phase
Initially, the subclustering classification algorithm is tested with software developed earlier. Next, the most optimum result based on this classification or clustering algorithm was recorded. Then, ANFIS model was integrated with Fuzzy C Means (FCM) technique and simulation was carried out subsequently. Lastly, optimization of the FCM-ANFIS will be done using the machine learning algorithm in WEKA software by University of Waikato New Zealand.
6. Results and Discussion
In order to justify the selection of classification technique, the diabetes data which has total patterns of 768 with 8 inputs and 1 output is used to observe and investigate the rational of selected classification technique using ANFIS model. The first part of the result will be based on conventional method which relies on the sub-clustering method and subsequently on the proposed method which is Fuzzy C Means algorithm. Conventional method is used as the border line or benchmarking for this project in investigating the classification and detection of bioinformatics data especially diabetes data. Meanwhile, in the proposed method, the partition data in figure 3 still being used but instead of applying the sub-clustering technique, the fuzzy C means algorithm will be used together with ANFIS model. Table 1 show the simulation result based on subclustering method and FCM method.
Results Comparision
0.5981 0.4417
71.09%
0.3605
72.66%
0.3587
0.00 0.10 0.20 0.30 0.40 0.50 0.60 0.70 0.80
Average training error
Average checking error
Performance Rating
Va
lu
e
Subclustering Fuzzy C means
182
74
186
70
0 50 100 150 200
Subclustering Fuzzy C means
Classification Results
Overall Acuracy Overall Misclassified
Fig. 5a Comparison between Subclustering and FCM
Fig. 5b Comparison between Subclustering and FCM
Based on the table 1 and figures 5a and 5b, we can slightly see the differences in the result produced by subclustering and fuzzy C means algorithms. Generally, the result based on fuzzy C means is better than sub clustering in most of the aspects. Average training error on Fuzzy C means is slower around 0.002 than sub clustering which yields around 0.3605. For the checking or validation error, fuzzy C means has much better score with value of 0.5981 if compared to subclustering with its score of 0.4417 and the differences around them accounted around 0.1564. The accuracy for fuzzy C means increased around 1.57% with its percentage soaring around 72.66% to 71.09% belongs to subclustering method. From the partition of the data, fuzzy C means accumulated 186 patterns correctly with only 70 patterns misclassified. On the other hand, subclustering only managed to produce around 182 patterns correctly and 74 accounted for misclassified patterns. This shows that fuzzy C means yields better results than sub clustering method in classification purposes using neuro fuzzy model; in this case, Adaptive Neuro Fuzzy Inference
Fuzzy C means clustering algorithms require a large number of computations of distance or similarity measures among data records and cluster centers, which can be very time consuming for very large data bases. Moreover, it generally requires the number of clusters as an input parameter. However, the number of clusters usually is not known a priori, so that the algorithm must be executed many times, each for a different number of clusters and uses a validation index to define the optimal number of clusters. The determination of the clusters’ numbers and centers present on the data is generally referred to as cluster analysis. Many cluster validity criteria have been proposed in the literature in the last years [14, 15 and 16]. Validity indexes aim to answer two important questions in cluster analysis, how many clusters are actually present in the data and how good the partition is. The main idea, present in most of the validity indexes, is based on the geometric structure of the partition, so that samples within the same cluster should be compact and different clusters should be separate. When the cluster analysis assigns fuzzy membership functions to the clusters, “fuzziness” must be taken in account in a way that the less fuzzy the partition is the better.
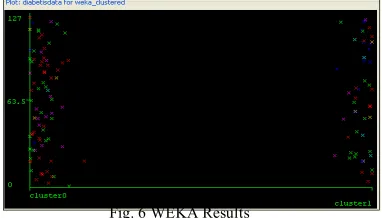
In this paper, instead of using trial and error technique to determine its centers or cluster analysis, it is done via WEKA software. Since FCM in general guarantees the optimality of the resulting classifier in respect to the class selection and data assignment to the C classes, under a given set of features and a given distance metric d, the optimization is done in the cluster validity and analysis or simply finding the initial clusters of the given data. Figure 6 shows the result from the WEKA software. For the cluster mode, percentage clusters are chosen with 75% used for training and the rest for testing purposes. It can be clearly seen that two clusters are form from figure 5.8. And this provided the Fuzzy C means very crucial parameters in optimizing its performance.
The result based on Fuzzy C means without the use of WEKA is compared with the result from Fuzzy C means with WEKA as in figure 7.
Fig. 7 Optimization Results
From the graph we can clearly see that, the performance for FCM with WEKA tops the performance chart with the accuracy percentage of 76.17%. In terms of pattern recognition, FCM with WEKA fails to recognize around 61 patterns out of 256 patterns tested. The average point of training and checking errors for FCM with WEKA found to be in moderate points. This shows that there is only a small variation in its errors, generated from training and checking processes if compared to other method which has a spike of value in its measurements.
Overall, it can be said that the optimized performance for fuzzy C means clustering technique can be found if we manage to determine correctly initial clusters required. In this case, WEKA software provides a very useful, easy and convenient tool for that purposes
7. Conclusion
As a conclusion, we have met our objective which is to evaluate and investigate the suitability and performance of recurrent classification technique, Fuzzy C Means (FCM) act as a classifier in ANFIS system compared to subclustering method. From this study, we can conclude that Fuzzy C Means technique is better than subclustering technique and ANFIS model is a suitable and feasible method to be used as supportive tools for bioinformatics problems. This project also successfully developed a package of software using MATLAB software particularly for solving the classification or clustering problems in bioinformatics problems or database. Optimization was carried out with WEKA software in order to optimize the performance of Fuzzy C means algorithm and accuracy of the classification and clustering capability.
9 References
[1]. A.B. Smith, Bioinformatics definition by Bioinformatics Definition Committee, National Institute of Mental Health released on July 17, 2000.
[2]. M. Brown (1996). “An Introduction to Fuzzy and Neurofuzzy Systems”. First Edition. Prentice Hall International. England. United Kingdom.
[3]. Martin Brown and Chris Harris (1994). “Neurofuzzy adaptive modeling and control”. First Edition. Prentice Hall International. England. United Kingdom.
[4]. G. W. Irwin, K. Warwick and K.J. Hunt (1995). “Neural Network Applications in Control”. First Edition. The Institution of Electrical Engineers. United Kingdom. [5]. J. S. R. Jang, C. T. Sun and E. Mizutani (1997).
“Neuro-fuzzy and soft computing. A computational approach to learning and machine intelligent”. United States of America. Prentice Hall International.
[6]. Detlef Nauck, Frank Klawonn and Rudolf Kruse (1997). “Foundations of Neuro-Fuzzy Systems”. England. John Wiley & Sons Ltd.
[7]. M. Sugeno & T. Yasukawa, A fuzzy logic based approach to qualitative modeling, IEEE Trans. on Fuzzy Systems, 1, 1993, 7–31.
[8]. T. Takagi & M. Sugeno, Fuzzy identification of systems and its applications to modeling and control, IEEE Trans. on Systems, Man and Cybernetics, 15, 1985, 116–132.
[9]. Slavica Joni´c, Tamara Jankovi´c, Vladimir Gaji´c, and Dejan Popovi´c. “Three Machine Learning Techniques for Automatic Determination of Rules to Control Locomotion”. IEEE transactions on biomedical engineering, vol. 46, no. 3, march 1999.
[10].R. Yager and D. Filev, “Generation of fuzzy rules by mountain clustering,” J. Intell. Fuzzy System, vol. 2, pp. 209–219, 1994.
[11].J. C. Dunn (1973): "A Fuzzy Relative of the ISODATA Process and Its Use in Detecting Compact Well-Separated Clusters", Journal of Cybernetics 3: 32-57 [12].J. C. Bezdek (1981): "Pattern Recognition with Fuzzy
Objective Function Algoritms", Plenum Press, New York
[13].WEKA at http://www.cs.waikato.ac.nz/~ml/weka [14].X. L. Xie and G. A. Beni (1991). Validity measure for
fuzzy clustering. IEEE Transactions on Pattern Analysis and Machine Intelligence, vol. 3 no. 8, pp. 841–846. [15].J. Bezdek and N.R. Pal (1998). Some new indexes of
cluster validity. IEEE Trans. Systems Man and Cybernetics B, vol. 28, pp. 301–315.
[16].M. K. Pakhira, S. Bandyopadhyay and U. Maulik (2004). Validity index for crisp and fuzzy clusters. Pattern Recognition, vol. 37, pp. 487-501.
FCM with WEKA
0,5981
0,3605
71,09%
0,3587 0,4417
72,66%
0,3554 0,3916
76,17%
0,0000 0,1000 0,2000 0,3000 0,4000 0,5000 0,6000 0,7000 0,8000
Va
lu
e
Sub Clustering 0,3605 0,5981 71,09%
FCM 0,3587 0,4417 72,66%
FCM with WEKA 0,3554 0,3916 76,17%