Abstract
Mahadevan, Pradeep. Analysis of Layer Development and Fusing for 3D Laser Printing. (Under the direction of Dr. Denis Cormier and Dr. Ola L. A. Harrysson.)
Analysis of Layer Development and Fusing for 3D Laser Printing
ByPradeep Mahadevan
A thesis submitted to the Graduate Faculty of North Carolina State University
in partial fulfillment of the requirements for the Degree of
Master of Science
INDUSTRIAL ENGINEERING
Raleigh
2003
Approved By:
Chair
Dr. Denis Cormier
Co-Chair Member Member
Dr. Thomas L. Honeycutt
Biography
Pradeep Mahadevan was born in the city of Chennai, in the state of Tamil Nadu in the southern part of India. He was raised in Chennai, where he completed his high school education in 1994. He later joined the University of Madras for a Bachelor of Engineering in Mechanical Engineering and graduated in 1998. Following graduation, he joined Brakes India Ltd., an automotive Brake manufacturing company as a Methods Engineer.
Acknowledgements
TABLE OF CONTENTS
1 List of Figures... vi
2 List of Tables ... viii
3 Introduction... 1
4 Rapid Prototyping Processes ... 3
4.1 Introduction... 3
4.2 Stereolithography... 3
4.3 Fused Deposition Modeling (FDM)... 4
4.4 Selective Laser Sintering (SLS)... 5
4.5 3-D Printing (3DP)... 6
4.6 Laminated Object Manufacturing (LOM) ... 7
4.7 Solid Ground Curing (SGC) ... 7
4.8 3D Laser Printing... 8
4.8.1 Advantages of 3D Laser Printing... 9
4.8.2 Disadvantages of 3D Laser Printing ... 10
4.9 Summary ... 10
5 Electrophotography ... 11
5.1 Introduction... 11
5.2 Photoconductor Charging ... 11
5.3 Image Exposure ... 12
5.4 Image Development ... 13
5.5 Image Transfer From PC to Paper ... 14
5.6 Image Fusing... 15
5.7 Cleaning the Photoconductor... 16
5.8 Toner Transfer in Electrophotography... 16
5.8.1 Two Component Toner Transfer ... 16
5.8.2 Monocomponent Development... 28
5.9 Summary ... 32
6 Polymer Powder Manufacturing and Properties Measurement ... 33
6.1 Introduction... 33
6.2 Polymer Powder Manufacturing... 33
6.3 Powder Polymer Properties and Measurements ... 35
6.4 Triboelectrification ... 36
6.5 Toner Charge Measurement... 39
6.5.1 Charge Measurement of Two component Toner ... 39
6.5.2 Charge Measurement of Monocomponent Toner ... 41
6.6 Flow-ability... 43
6.6.1 Particle Shape and Size... 43
6.6.2 Compaction... 43
6.6.4 Aeration and De-aeration... 44
6.6.5 Moisture Absorption ... 44
6.6.6 Bulk Density Dependence on Attrition... 44
6.7 Toner Flow-ability Measurement ... 44
6.7.1 Hosokawa Micron Powder Characteristics Tester... 45
6.7.2 Flow-ability Angle of Repose (ASTM C1444-00) ... 45
6.8 Monocomponent Toner Resistance Measurement... 46
6.9 Dry Electrostatic Toner Fusion Temperature Measurement... 47
6.10 Caking Temperature of Dry Electrostatic Toner ... 49
6.11 Summary ... 49
7 Experimentation... 50
7.1 Introduction... 50
7.2 Material Testing Station for 3D Laser Printer ... 51
7.3 Tests Conducted Using the Material Testing Station ... 59
7.4 Evaluation of Thermal Deformation... 62
7.4.1 Polymer Powder Material Used for Preparing the Specimen ... 62
7.4.2 Specimen Preparation ... 65
7.4.3 Measurement of Thermal Deformation ... 66
7.5 Shear Strength of the Specimen Prepared in Material Testing Station... 70
7.6 Variation in the Mass of Toner Deposited... 73
7.7 Evaluation of Teflon as Good Receiving Medium of Polymer Powder ... 75
7.8 Summary ... 76
8 Conclusions and Recommendations... 77
9 References... 80
10 Appendix A Equations for Layering Process ... 84
1 List of Figures
Figure 3-1 Sliced Layer Information from a Cad Model... 1
Figure 4-1 3D Laser Printer... 9
Figure 5-1 Photoconductors Used In Electrophotography ... 12
Figure 5-2 Charged Area Development Process ... 13
Figure 5-3 Discharged Area Development Process... 14
Figure 5-4 Hot Roll Pressure Fusing Device... 15
Figure 5-5 Cascade Development... 17
Figure 5-6 Solid Area Development... 18
Figure 5-7 Electric Field for Insulative Magnetic Brush Development ... 22
Figure 5-8 Insulative Magnetic Brush Development... 27
Figure 5-9 Injection Charging ... 29
Figure 5-10 Nakajima’s Model of Injection Charging ... 30
Figure 5-11 Doctor Blade used in Contact Charging ... 31
Figure 6-1 Jet mill... 34
Figure 6-2 Toner Draw Off Charge Measurement ... 40
Figure 6-3 Zetasizer for Particle Size and Charge Measurement ... 41
Figure 6-4 Charge Measurement by the Application of Flying Voltage ... 42
Figure 6-5 Device for measuring Toner Resistance ... 47
Figure 6-6 Microscope and Micro Hot Stage ... 48
Figure 7-1 Toner container ... 52
Figure 7-2 Material Testing Station... 53
Figure 7-3 Viscosity Variation With Temperature for a Toner With 90o C Glass Transition Temperature... 55
Figure 7-4 Variation of Creep Rate With Temperature for a Polymer a With 90oC Glass Transition Temperature... 56
Figure 7-5 Layer Fusing in Material Testing Station ... 58
Figure 7-6 Layering in Material Testing Station ... 58
Figure 7-7 Temperature Distribution Across a Depth of 300 microns for 5 second Fusing Time ... 60
Figure 7-8 Temperature Distribution Across a Depth of 300 microns for 10 second Fusing Time ... 60
Figure 7-9 Temperature Distribution Across a Depth of 300 microns for 15 second Fusing Time ... 61
Figure 7-10 Temperature Distribution Across a Depth of 300 microns for 20 second Fusing Time ... 61
Figure 7-11 Particle Size Measurement by Microscopy... 63
Figure 7-12 Seventy four Layer Specimen Prepared in Material Testing Station... 65
Figure 7-13 Specimen Height Measured by Laser Profilometer - 1... 66
Figure 7-14 Specimen Height Measured by Laser Profilometer - 2... 67
Figure 7-15 Laser Profilometer Scan Lines in a 2 x 4 Inches Specimen... 67
Figure 7-16 Laser Profilometer Scan Over Base Plate and Specimen ... 68
Figure 7-17 False Trigger Caused During Measurement ... 69
2 List of Tables
Table 6.1 Triboelectric Series ... 37
Table 7.1 Form Factor of Toner Particles ... 64
Table 7.2 Equivalent Circle Diameter of Toner Particles... 64
Table 7.3 Thermal Deformation of Specimen made in Material Testing Station... 70
Table 7.4 Results of Shear Test ... 72
Table 7.5 Measurement of Toner Samples to Determine Variation in Regional M/A Ratio... 74
Table 7.6 95% Confidence Interval for Weight Difference... 74
3 Introduction
The purpose of this research is to develop materials and to investigate the layering process for a low cost alternative rapid prototyping system called 3D laser printing. This process is being developed by researchers in the Industrial Engineering Department of North Carolina State University.
Rapid Prototyping (RP) systems are used to quickly develop parts from concepts. The parts developed by RP systems provide a physical model for analyses, testing and to construct molds for cast parts. Some prominent RP systems in commercial use are Stereolithography (SLA), Fused Deposition Modeling (FDM), 3-D Printing and Selective Laser Sintering (SLS). All the Rapid Prototyping systems develop parts by depositing material in layers. The CAD information of the part to be built is used in the slicing software to get information on every layer to be deposited in the rapid prototyping systems for constructing the part.
Figure 3-1 Sliced Layer Information from a Cad Model
There are certain limitations to the existing RP systems which limit their commercial exploitation. These systems are technology intensive and are very expensive to buy. The most costly RP systems can cost up to $ 800,000 and are relatively expensive to operate. RP systems such as stereolithography and solid ground curing use a photopolymer material for building parts, which limits the choice of materials. These systems also need post processing to completely cure the parts. Also many RP systems provide relatively poor accuracy and part strength.
The 3D laser printer currently under development is based on existing and perfected laser printing technology. The print engine used for depositing polymer layers is derived from a Hewlett Package laser printer. By using an existing and commercially available technology, the overall development and system costs are lowered. The process of fixing the layers takes place due to thermal diffusion by application of pressure and temperature and does not need laser curing. Also there is no post curing involved as all the layers are solidified during the process.
4 Rapid Prototyping Processes
4.1 Introduction
The following sections provide a basic understanding of the working of different RP systems. This chapter also explains about the working of the 3D laser printing process and its potential advantages.
4.2 Stereolithography
The most widely used RP system is Stereolithography (www.3dsystems.com). In Stereolithography, the CAD information of the part is sliced into two dimensional horizontal cross sections with a slice thickness ranging from 0.0015” to 0.006”. A laser beam is used to selectively solidify the photopolymer resin to form a layer. A wiper spreads a layer of resin to the proper thickness, and the next layer is fused by the laser beam over the previous layer. The process is repeated until the part is completed. In the case of the special QuickcastTM build style, the laser beam cures the layers with an internal honey comb structure. This structure traps the uncured resin. The boundary contours of the part are completely cured by repeated passes made by the laser in a pattern of overlapping lines called skin-fill. The final curing of the part is done in a post curing oven which floods the part with ultra violet light to complete the solidification process.
Advantages of stereolithography
• The parts produced can have very high accuracy in the order of 0.001"
• The process is capable of producing intricate designs with high
• Stereolithography was the first RP process to be introduces in the
market, and it has proven to be a reliable and mature process over the years.
Shortcomings of Stereolithography
• The initial investment on stereolithography machine can be somewhat
high as it uses a costly laser systems to cure the photopolymers.
• The process is limited by the use of photopolymers. Only certain types
of polymers are used in the process.
• Considerable post processing is necessary.
4.3 Fused Deposition Modeling (FDM)
The Fused Deposition Modeling system (www.stratasys.com) uses the sliced horizontal cross section information of the CAD model in the same way as stereo lithography. The system has a fixtureless base, a spool containing filament material and a head that heats and deposits the filament material. The material is extruded through the head and deposited on the fixtureless foundation. The head moves around in a pattern set by the cross sectional CAD data. Material is deposited in layers where it adheres to the previous layer by thermal diffusion.
Advantages of Fused Deposition Modeling
• Fused Deposition Modeling does not require post curing.
• The operating temperatures are low at around 180-220 degrees Farenheit,
providing a relatively safe operation. There is no worry of exposure to toxic chemicals, lasers or liquid polymers.
• The process uses no powder, and there is no messy clean up.
Shortcomings of Fused Deposition Modeling
• Accuracy of the part can be relatively low.
• The process is sensitive to variations in temperature and humidity.
• The process is relatively slow for building large parts.
4.4 Selective Laser Sintering (SLS)
Selective Laser Sintering (www.3dsystems.com) uses CAD data to get the slice information for forming layers. SLS uses polymers, metal and ceramic powders to form layers instead of liquids or sheet materials used in other processes. SLS system has infrared heat panels, which act to heat the powdered material just below the material melting point. A powder cartridge supplies powder material used to produce the part, and a roller to distribute the material evenly across the workspace. A thin layer of material is spread across the workspace platform, and a laser traces the pattern of the slice. The material is heated and fused by the laser beam. The laser beam is carefully modulated to assure that the surrounding material remains unaffected. The platform is then lowered and the process is repeated to construct successive layers.
Advantages of Selective Laser Sintering
• Selective Laser Sintering has the ability to work with a variety of materials
• There is no need for post-curing.
• The unsintered material surrounding the part acts as a support structure for the
part thereby eliminating the need for external support
Shortcomings of Selective Laser Sintering
• The process is fairly expensive.
• The parts produced have a textured surface finish
• The mechanical properties of the sintered materials are generally lower than
those of fully dense material.
4.5 3-D Printing (3DP)
The 3DP process (www.zcorp.com) uses the horizontal cross sectional sliced data from the CAD models. A uniform layer of powder material is spread across the bed by mechanical means over a build platform. An inkjet head sprays a special binder in a specific region based on the cross sectional details of the layer. The binder binds the particles in the layer together. The same process is repeated for every layer. Layer thicknesses of 0.003"-0.010" are achieved using the Z-Corp 3-D printer. The same powder material is used as a support material for developing layers.
Advantages of Z-Corp 3-D printer
• The printing system is less expensive compared to most other RP systems.
Shortcomings of Z-Corp 3-D printer
• The parts produced have poor strength
• The process is less accurate compared with other RP processes such as
stereolithography and solid ground curing.
4.6 Laminated Object Manufacturing (LOM)
Although LOM is no longer commercially offered, it is a well-known RP process. The process uses the horizontal cross sectional sliced data from the CAD model. A laser is used to cut the slice out a layer of material being used to produce the model. Once the layer is cut and deposited, another layer is cut to a suitable profile based on the slice information and deposited over the previously deposited layer. LOM uses thin sheets including paper, plastic and composite. The sheets are coated with heat sensitive adhesive, which enables the sheet to be bonded layer by layer by hot compression to form a part.
4.7 Solid Ground Curing (SGC)
work piece, all the non-solidified material is wiped off and collected for reuse. The mask plate is then cleaned of the pattern and a new image is charged on the plate. Melted wax is then used to fill the cavities of the model after the photopolymer is removed. A cooled plate is lowered on the work piece to instantly solidify the wax forming a support structure for the model. The work piece is passed under a milling cutter, which produces the layer to precise thickness and forming a flat surface to deposit the next layer of photopolymer. The process is repeated layer by layer to construct a complete model.
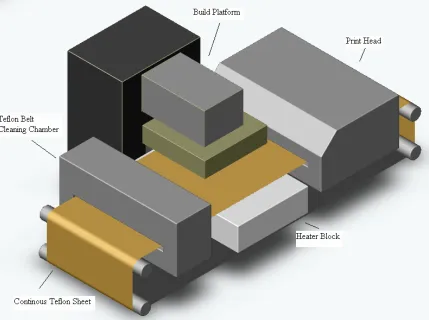
4.8 3D Laser Printing
Figure 4-1 3D Laser Printer
4.8.1 Advantages of 3D Laser Printing
• The 3D laser printer is being developed using existing laser printing
technology. Hence, the print engine used in the 3D laser printer will be comparable to the cost of a laser printer.
• The polymer powder materials used in a 3D laser printer are very similar to
• The layer transfer from the print engine to the fixing area is done using a
Teflon belt and the fixing process itself is done using a simple contact type heater block. The simplicity of the fixing process considerably reduces the cost of the RP system.
• Superior mass to area ratios are achieved by the laser print engines in every
layer deposited.
4.8.2 Disadvantages of 3D Laser Printing
• The layer is fixed over the previous layers by heating the deposited layers near
to polymer powder glass transition. The parts therefore undergo thermal deformation.
• Additional print engines have to be provided to provide support layers.
4.9 Summary
5 Electrophotography
5.1 Introduction
As mentioned previously, the 3D laser printer is based on principles of laser printing, and an understanding of electro-photographic principles is essential to appreciate the suitability of the laser printing process for layered manufacturing. There are different types of mechanisms available for polymer powder transfer in electro photography. The material composition and properties are based on the type of transfer mechanism. The different transfer mechanisms are discussed in detail in the following sections along with the illustration of the electric fields present during toner transfer. Multilayer toner transfer feature is illustrated in the analysis of the electric field, which can be applied to attain a wide range of mass to area ratio of toner in a given layer.
There are six processes involved in producing an image using electrophotography. They are photoconductor (PC) charging, image exposure, image development, image transfer from PC to paper, fusing or fixing the paper and cleaning the photoconductor (Schein, 1992). These six steps are explained in detail in the following sections.
5.2 Photoconductor Charging
The first step in the electrophotographic process is the deposition of a uniform charge on the photoreceptor surface. This is accomplished by the corona discharge device. The corona discharge devices are comprised of a series of stainless steel or tungsten wires. The corona wires are maintained at a potential of 5 to 15 KV. The field at the vicinity of the corona wire is sufficiently high and the electrons in the region of the wires will be accelerated to velocities such that ionization of the gas molecules will occur. The positive coronas are hydrated protons of the generalized formula (H20) n H+, where n=4-8 and the
this, auxiliary electrodes are provided in close proximity to the corona, which uniformly charges the photoconductor (Borsenberger, and Weiss, 1998).
5.3 Image Exposure
The latent image formation in a laser printer is done with an infrared laser. Latent image formation typically requires an exposure between 5 - 20 ergs/cm2. The latent image
exposure with the laser creates an electron hole pair in the photo generation layer of the photoreceptor. The pair separates and is displaced to the free surface and the substrate electrode (in the photo conductor). The hole moves through the transport layer above the photo generation to the free surface and the electron moves to the substrate electrode at the bottom of the photo generation layer. The surface charge is thus dissipated to the exposed region by the hole and an electrostatic charge pattern is created.
Figure 5-1 Photoconductors Used In Electrophotography
5.4 Image Development
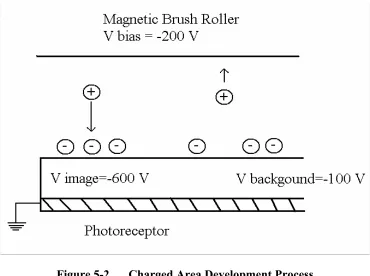
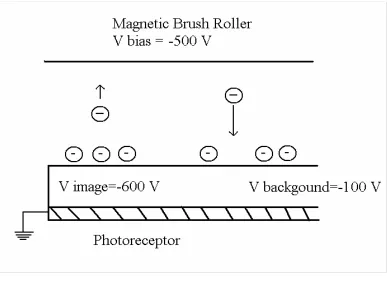
In the development stage, charged toner particles are deposited on the photoreceptor. The toner particles are polymer based particles having carbon black as a colorant and for controlling the conductive properties. Magnetic properties in the toner particles are obtained by adding magnetite to the polymer during the toner manufacturing process. The toner particles are charged by triboelectrification or by corona charging to the right polarity. There are two types of image development processes. They are Charged Area Development (CAD) and discharge area development (DAD). In CAD, the toner particles are attracted to the charged area of the PC. This requires that the polarity of the toner particles be opposite to the latent image polarity of the PC. In DAD, the toner polarity is same as the photoreceptor surface and the toner particles are repelled from the charged region and deposit in the discharged regions. There are various mechanisms for toner charging and transfer. These will be explained in latter sections.
Figure 5-2 Charged Area Development Process
Figure 5-3 Discharged Area Development Process
Source: Electrophotography and Development Physics by L.B. Schein (1992), Springer-Verlag Berlin Heidelberg New york publication
5.5 Image Transfer From PC to Paper
5.6 Image Fusing
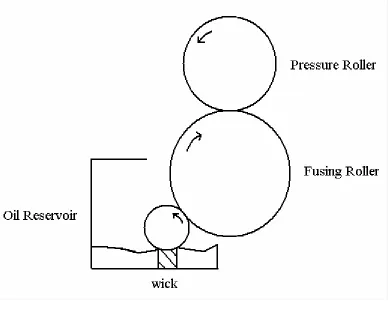
After the toner particles are transferred to the paper, the toner is fused to form a permanent image. This can be accomplished by pressure, heat and radiation. A cold pressure process is used for low volume applications and produces a lower image quality than the hot-pressure process in which a combination of pressure and temperature is used. In radiant fusing, heat generated from a quartz lamp or heated coil is used to melt the toner into the paper. The basic limitation of radiant fusing is the time required to fuse the toner. In the hot pressure process, a hot-roll pressure device is widely used. A hot-roll pressure device has a hollow roller heated internally by a quartz lamp. Oil wicks are used on the surface of the roller to prevent offset of toner on the paper.
Figure 5-4 Hot Roll Pressure Fusing Device
5.7 Cleaning the Photoconductor
After the image transfer from PC to paper, all the residual charge in the PC must be removed along with the residual toner. Light to discharge the photoconductor or AC coronas are generally used for removing the residual charge. A brush cleaner with a vacuum system and filter is usually used to wipe the excessive toner.
5.8 Toner Transfer in Electrophotography
The various processes involved in electrophotography were explained in detail in the above section. There are different mechanisms for transferring toner to the electrostatic latent image in the photoconductor. The properties of the toner are based on the type of toner transfer mechanisms. The different toner types and their transfer mechanisms are explained in detail in the following sections.
5.8.1 Two Component Toner Transfer
Two component toner development systems have two powders, the toner and carrier mixed together. The toner particles are approximately 10 micrometers in diameter and are blends of polymer and carbon black particles. The carrier particles are approximately 200 micrometers in diameter and are composed of magnetically soft cores that are coated with a thin polymer coating. The toner and the carrier particles are charged by triboelectrification when mixed together. Depending on the materials selected for toner and carrier, the resultant charge obtained may be positive or negative. The magnitude of the charge on toner particles depends on their size and shape of the particles.
There are different mechanisms available for two component development. The development mechanisms are cascade development, insulative magnetic brush development and conductive magnetic brush development. The development methods are explained in detail in the following sections.
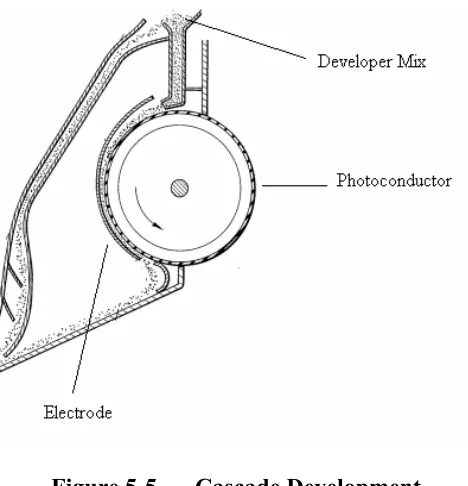
5.8.1.1 Cascade Development
The cascade development was invented by Battelle –Haloid development system (Schein 1992). In this development, the carrier beads and the toner are literally cascaded down the photoreceptor under the influence of gravity. The interaction of the toner with the latent image literally depends on the cascading bead velocity and bounce rate
(
Genthe, 1975). The development also depends on developer flow rate, developer zone angles (the angle of photoreceptor with respect to gravity), carrier properties (type, diameter, coating), toner properties (type, size, charge and concentration) and the bias electrode spacing across the photoreceptor. Based on the bias electrode across the photoconductor, the cascade development can be classified into three types as open cascade method with no electrode, conventional cascade with an electrode above the photoconductor and inverted cascade with an electrode beneath the photoconductor.Figure 5-5 Cascade Development
The electrode is used for solid area development, which is a uniformly charged latent image. Without a counter electrode, the only electric field available above the photoreceptor is associated with the fringe field at the edges of the solid. Inside the latent image, there is no electric field and the toner is not attracted in these areas.
Figure 5-6 Solid Area Development
The theory of two component development can be further classified into airborne development and contact development. It is envisioned in airborne development (Sullivan and Thourson, 1967) that the toner is stripped from the carrier at a remote location from the image by impact of a carrier bead with another carrier bead, photoreceptor or the electrode. There are significant approximations made to the mass per unit area of the toner deposited by this model, and significant parameters are missing from this model. In contact development, the source of toner to the photoconductor is from the contact of toner and carrier with the photoconductor. The importance of the impact of the carrier bead in the presence of an electric field was clearly demonstrated by Donald and Watson (1970) in a measurement of efficiency of the toner release from carrier dropped at a fixed height. With no electric field, the efficiency was low and increased with drop height. The release efficiency is increased by a factor of 5 for a field as low as 0.1 V/micrometer.
5.8.1.2 Insulative Magnetic Brush Development
5.8.1.3 Field Stripping Theory
In the field stripping theory, the Coulomb force Qt Eair (Qt – toner charge, Eair – Electric
field) overcomes the electrostatic image forces and Vader walls forces on the toner that attracts the toner to the carrier beads (Williams 1984). All the particles whose adhesion force is less than Qt Eair is developed from the carrier bead on to the latent image.
According to this theory, toner particles with lower charge develop first, so the developed charge to mass ratio of the toner must increase with applied voltage. The developed mass per unit area must be linear with the toner concentration and roller velocity for a constant toner charge to mass ratio (Williams 1984) because development should increase as the amount of available toner increases. According to this theory, the developed mass per unit are is given by
) 48 1 1 ( 3 2 2 0 air t C t E r Q Rp C A M πε ν ρ − = t
C - Ratio of toner mass to carrier mass
C
ρ - Density of the carrier
R - Carrier radius
p - Carrier surface packing
ν - Ratio of roller velocity to photoreceptor velocity
0
ε - Permittivity of free space
r - Toner radius
t
Q - Toner Charge
A M
- Developed toner mass per unit area
5.8.1.4 Powder Cloud Theory
to this theory, the developed toner mass per unit area depends on the product of the carrier flow and the function of inertial forces on the carrier beads (Schein, 1992). The flow of the carrier particles is proportional to the roller velocity, and the inertial forces on the carrier beads increase with roller velocity. As a result, the development mass per unit area shows a linear dependence on roller velocity. If development of toner depends on the voltage applied, the developed mass per unit area must show a linear dependence to voltage. If the amount of toner is freed from the inertial forces alone, then the charge to mass ratio should be independent of the electric field. If the release of the toner depends on the inertial forces as well as toner charge, then a more complicated behavior is expected. There are two observations that confirm the existence of this theory. First, as the distance between the photoreceptor and the roller is increased, development decreases and becomes constant at a gap above 6mm, where contact between the carrier and the photoreceptor never occurs. Second, in this region of large gap, the observed current to the photoreceptor ground plane exhibits an exponential dependence, as one would expect for a dynamic process like powder cloud or field stripping.
5.8.1.5 Equilibrium Theory
Equilibrium theory (Schein, 1975) assumes that toner continues to come out of the carrier beads until the coulombs forces of the latent image balances the forces of attraction of the toner to the carrier beads. In this theory, the usual forces of attraction of the toner to the carrier beads are ignored because it is assumed that development only occurs in three body contact events between carrier, toner and photoreceptor. In this case, the forces are cancelled to first order by similar forces between the toner and the photoreceptor (Schein, 1992). The predominant force of attraction between the toner and the carrier is due to the toner particles building up a net charge as a result of toner particles developing. If n particles develop from a carrier bead, a net charge of nQt builds up in the carrier. Based
that the development of toner is independent of the amount of toner available for a constant charge because development continues until equilibrium of forces is reached. The evidence for this theory results from the experiments on controlled magnetic brush development systems. Microscopic experiments support the assumption of toner-carrier adhesion force to be cancelled by toner-photoreception adhesion force. It can be perceived intuitively that field stripping requires a basic threshold behavior for development, and no such behavior was observed for low electric fields. The development of toner was observed to be linear over a wide range of values. One would expect that the development to be proportional to the integral of toner adhesion distribution to a value determined by the applied electric field
5.8.1.6 Electric Field for Insulative Magnetic Brush Development
It is clear from all the theories, that the electric fields drive the development of all the theories (L.B. Schein, 1992). During development, the latent image of the photoconductor has a uniform charge with a charge per unit areaσp.
Figure 5-7 Electric Field for Insulative Magnetic Brush Development
The photoreceptor and the roller are assumed to be in parallel planes to determine the electric field due toσp. If the ground planes in the photoreceptor and the roller with a
charge per unit are σ1 andσ2, thenσpis
2 1 σ
σ σp = +
The electric field in the photoreceptor Ep is calculated as o s K ε
σ1
. Ksis the dielectric
constant of the photoconductor, and εo is the permittivity of free space. The electric field
in the developer,ED, is o E K ε
σ2
, KE is the effective developer dielectric constant. The
electric field in the air gap in which the toner is trying to develop is
0 2 ε σ = air E
Since there is no voltage applied across the system, the sum of the voltage drop must be zero. 0 2 2 1 0 0 0 = + + − L K K d
K s air E
s s ε σ δ ε σ ε σ
where dsis the photoreceptor thickness, L is the developer thickness, and δairis the small
air gap in which the toner resides. The electric field in the air above the photoreceptor is
) ( 0 air E s s s s p air K L K d K d E δ ε σ + + =
0 ε σ s s p K d V =
The electric field in the air gap is expressed in terms of V as
) ( air E s s air K L K d V
E = + +δ
During development, charged toner moves to the photoreceptor surface. The charge per unit area on the photoconductor is reduced by the presence of toner charge per unit area
t σ . A M M Q t = σ where M Q
is the charge to mass ratio and
A M
is the mass per unit area of the developed
toner.
The new electrostatic field is obtained by replacing σp withσp −σt. The first order
approximation (without assuming L=∞) of the toner voltage Vt is defined as
0 0 1 ε ε σ s s s s t t K d A M M Q K d
V = =
Using the above approximation, the effect of toner development on Eair is given as
) ( ) ( air E s s t air K L K d V V
The second order effects are obtained by considering the toner resting on the
photoconductor to have a constant volume charge densityρtv, thickness dt and dielectric
constantkt. Using gauss law, the charged toner creates an electrostatic potential Vtof
) 2 ( 0 t t s s t tv t K d K d d
V = +
ε ρ
The above value of Vt is whenL=∞. The measurable parameters ρtv and dtare
expressed as
t t tv Q M ρ p ρ =( / ) t t t p A M d ρ =
where ρtthe toner is mass density and pt is the toner volume packing. Using the above
two equations, Vt can be expressed as
) 2 ( 1 1 0 t t s s t K d K d M Q A M
V = +
ε
The value dt1is the thickness of the first monolayer developed. The value Vt is a spatial
voltage, since
A M
is not continuous, being finite where the toner has developed and zero
in other areas. Above the first layer of toner
2 1 0 1 ) 2 ( 1 | V K d K d M Q A M V t t s s
t = ε + +
) 2 ( 1 ) | ( 2 0 1 2 t t s s K d K d A M A M M Q
V = − +
Where dt2is average position of the toner in the second layer and |1
A M
is the mass per
unit area of the toner developed in the first layer.
The above equations relate the voltage due to developed toner to the mass per unit area.
The values dt1and dt2 can be obtained by discharging the photoconductor by exposure to
light and then measuring the remaining potential (Schein, 1992). It can be appreciated from the above discussion that it is possible to obtain a wide range of layer thickness for a given toner particle size.
0 1 1 2 ) /( ε t t t k d A M M Q V = A M
< one monolayer
0 2 1
1 ( | ) 1
) / ( ) | ( ε t t t t K d A M A M M Q V
V − − =
A M
> one monolayer ds =0
Where Vt |1 is the toner voltage at the first monolayer. Experiments were conducted by
L.B. Schein in 1974 to verify the above results, and distinct observations were made on the first and second monolayer. It was observed that the electrostatic potential of the photoreceptor changes before and after development. The change was observed to be due to Vt and also due to the additional charging of the photoreceptor due to the interaction of
carrier and toner with the photoreceptor. These results and experiments prove that it is possible to develop multiple layers of toner in a single development cycle and a wide
range of
A M
Figure 5-8 Insulative Magnetic Brush Development
Source: Electrophotography and Development Physics by L.B. Schein (1992), Springer-Verlag Berlin Heidelberg New york publication
5.8.1.7 Conductive Magnetic Brush Development
development because of the build up of charge on the carrier beads adjacent to the photoreceptor. The conductive path short circuits the stored charge on the carrier to the ground thereby increasing the development of toner.
5.8.2 Monocomponent Development
5.8.2.1 Induction Charging for Conductive toner
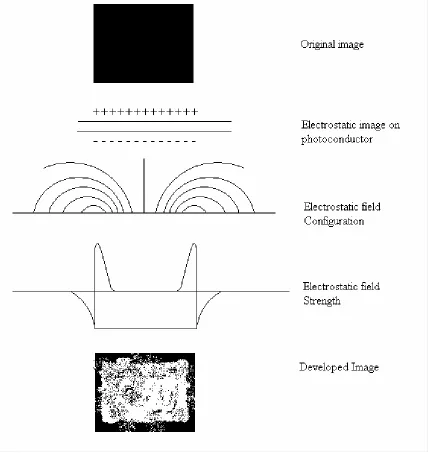
The conductive toner particles can be charged by contacting them with a metal and imposing an electric charge. The charge will flow from the metal to the particle and charge the particle. A conductive toner particle sitting on a positive electrode plate might acquire a positive charge and will be attracted by a negatively charged photoreceptor. The toner particle after migrating to the photoreceptor will lose the negative charge and acquire a positive charge and will be repelled back to the electrode plate. To avoid the bouncing of toner, the resistivity of the toner must be given careful consideration (Choi, 1964). The induction charging mechanism assumes a simple RC circuit charging model. When the charging magnetic roller rotates, the toner particles move in the opposite direction and there is a rise and fall of toner chains following the magnetic field lines. In the development zone, the toner is chained by the radial magnetic field between the roller and the photoreceptor surface, forming a conductive path. The time constant for the
charge to move down the chain isρKtε0. ρ is the resistivity of the chain,Kt is the
dielectric constant of the toner and ε0 is the permittivity of free space. Clearly this time
constant must be less than the time the toner in the development zone. Characterization of the resistivity of toner is very difficult because it includes the interface between toner particles. The resistivity of the toner particulate system is often electric field dependent and also varies from chain to chain.
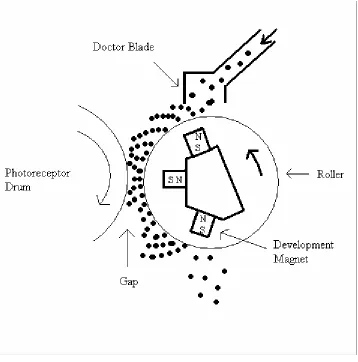
5.8.2.2 Injection Charging
presence of a magnetic field. The critical aspect of the invention is the turbulent mixing of the toner particles around the roller to produce uniform charging.
Figure 5-9 Injection Charging
Source: Electrophotography and Development Physics by L.B. Schein (1992), Springer-Verlag Berlin Heidelberg New york publication
Figure 5-10 Nakajima’s Model of Injection Charging
Source: Electrophotography and Development Physics by L.B. Schein (1992), Springer-Verlag Berlin Heidelberg New york publication
It was observed that different toner charging characteristics can be obtained by varying
dd
R , defined as the ratio of the development gap to the doctor blade gap. At Rdd, less
than 0.9 toner behaved conductively and the development is low. The interparticle conductivity is higher at Rdd values less the 0.9, where higher packing fraction of toner
occurs. Development was observed at higher Rdd values above 0.9 where interparticle
conductivity is low.
5.8.2.3 Contact Charging
reservoir past a magnetic doctor blade. It was proven in experiments that the toner charging is caused only due to the contact charging of toner particles with the roller surface. This was proven by changing the resin coated on the roller. The magnetic doctor blade is used to split the toner chain where the spatial derivative of the magnetic field, which determines toner-toner adhesion. A research group at Ricoh (Schein, 1992) proved that the charge on every toner particle is propotional to the square of the radius of the toner particle for radii less than 6 micrometer. Above 6 micrometer, the charge tends to become independent of radius. Another research group at Toshiba performed experiments with a special metering blade (Doctor Blade) designed to apply pressure to the roller (Schein, 1992). The toner charge and the layer thickness depends on the pressure applied. The charge to mass ratio increases with the pressure applied, and the mass to area ratio decreases with the pressure applied.
Figure 5-11 Doctor Blade used in Contact Charging
Springer-5.8.2.4 Corona Charging
Corona Charging can be achieved on toner by placing a corona device adjacent to the roller housing the permanent magnets (Schein, 1992). The toner is attracted by the roller, and the corona device charges the toner uniformly by ion emission. The problem with corona charging is the contamination to the corona wire by the toner particles which do not permit uniform charging of the toner on the roller surface.
5.9 Summary
6 Polymer Powder Manufacturing and Properties Measurement
6.1 Introduction
The polymer powder manufacturing and classification processes are explained in this chapter. There are polymer properties associated with the flow ability, electrostatic image development and fixing processes. The polymer properties and measurement methods are explained in detail in the following sections.
6.2 Polymer Powder Manufacturing
Toner is prepared by melting and kneading resin, magnetite particles, charge control agent and coloring agent (carbon black). The kneading is done in an extrusion machine or batch mixer. The polymer resin is melted, and the high shear in the extrusion machine causes the components to be evenly dispersed within the matrix.
The fused mixture is then subjected to coarse crushing followed by fine pulverization. The fine pulverization is done by a jet milling process. In the Jet milling process, the toner particles are carried by opposed air jets, and the fine pulverization takes place by the impact of the toner particles in the opposed jets. The particles are then carried into a separation chamber where the smaller particles with lesser mass are separated through an outlet and further collected through a filter. The larger particles are returned by the air jet into the impact chamber and are pulverized into finer particles. There are number of classifiers available with different working principles to classify and separate toner particles of the right size. The toner is then subjected to a process called speriodization (Kumar, 2000) in which the toner particles are passed in a stream of hot air to attain the spherical shape that is vital for toner flow-ability. Fluidizing agents such as hydrophilic silica are then added to the toner to improve its flow properties.
kneading. There may be excessive abrasion of iron oxide used in the mixture and the jet milling process is energy intensive (Cooper, 1992). The particle size distribution produced by jet milling is also large.
Figure 6-1 Jet mill
charge control agent cannot be uniformly dispersed in the polymerized particles as in melt kneading (Kamiyama, 1993).
In the spray drying process, the toner particles are produced by interfacial polycondensation. A first non-aqueous reacting material is emulsified in an aqueous phase containing the second reacting material. The reaction between the first and second reacting materials takes place by agitation to produce microdroplets of non aqueous phase encapsulated with a substantially impervious polymeric compound. This shell produces resistance to abrasion from other particles and protects the toner particles from the effects of the environment. These types of toners are known as encapsulated toners. The substance encapsulated in interfacial polycondesation contains coloring material, magnetite of ferrite, binder for the coloring material such as vegetable oil, aliphatic or aromatic hydrocarbon solvent, antioxidants and a carrier medium comprising a solvent or a plasticizer containing the first reactive substance. The second reactive substance is an amine containing substances such as diethylene triamine with PH stabilizers like sodium carbonate. After agitation, the mixture forms a slurry and the slurry is spray dried to form discrete capsular particles (Matkan, 1980). The toner particles produced by spray drying have the same disadvantage as the particles produced by suspension polymerization.
6.3 Powder Polymer Properties and Measurements
6.4 Triboelectrification
Toner particles get charged by a process known as triboelectrification. When two neutral surfaces comes into contact with each other and then separate, the particles will undergo tribocharging and will be at a non neutral surface charge level. The level and the polarity of this acquired surface charge depends on several factors. The mechanism of triboelectrification is explained in the following sections.
- Surface Contact Effect
Surface contact effects include the surfaces roughness, contact force, and frictional heating (caused by rubbing), all of which influence the amount of surface area that is in contact with the other material during tribocharging (Allen, 2000). The greater the surface contact, the greater the resulting net charge may be when two surfaces are separated after contact.
• The increased surface roughness between the contact surfaces results in
decreased surface contact leading to reduced charging (Moriya, 1994).
• . The uniformity in the size and shape of toner powder results in uniform
charging
• Smaller toner particle size results in increased contact surface area for
triboelectrification.
- Work Function
to appropriate electrons from materials with lower work functions. The triboelectric series has a list of materials based on the tendency give up and acquire electrons. The triboelectric series in the following section has been determined empirically by the charge attained by the material when it comes into contact with a different material.
Table 6.1 Triboelectric Series
Source: Electrophotography and Development Physics by L.B. Schein (1992), Springer-Verlag Berlin Heidelberg New york publication
Positive
Silicone elastomer with silica filler
Borosilicate glass, fire polished
Window glass
Aniline-formol resin, acid catalyzed
Polyformaldehyde
Polymethylmethaacrylate
Ehtylcellulose
Polyaimde 11
Polyamide 6-6
Rock Salt (NaCl)
Melamine formol
Wool, Knitted
Silica, fire polished
Silk, Woven
Polyethylene glycol succinate
Cellulose acetate
Polydiallyl phthalate
Cellulose sponge
Cotton, woven
Polyurethane elastomer
Styrene-acrylonitrile copolymer
Styrene-Butadiene copolymer
Polystyrene
Polyisobutylene
Polyurethane flexible sponge
Borosilicate glass, ground state
Polyethylene glycol terepthalate
Polyvinyl butyral
Formo phenolique, hardened
Epoxide resin
Polychlorobutadiene
Butadiene-acrylonitrile copolymer
Natural rubber
Polyacrylonitrile
Sulphur
Polyethylene
Polydiphenyol propane carbonate
Chlorinated polyether
Polyvinyl chloride with 25% DOP
Polyvinyl chloride without plasticizer
Polytriflurochloroethylene
Polytetrafluroethylene
Polytetrafluroethylene
Charge Back Flow
Charge backflow occurs when two materials have been charged possibly from the above mechanisms and are then separated from intimate contact. The backflow of some of this charge imbalance may flow back to the original material reducing to some degree the net charge (charge imbalance) on either surface from tribocharging.
Gas Breakdown
Gas breakdown can occur between two surfaces during separation. The microscopic surface topology of a surface has many peaks and valleys. It is one of these peaks that may have substantial charge that yields a large electric field in a very small area causing corona discharge or the breaking down of the air molecules which were acting as a dielectric (insulator between the two separating surfaces). During this breakdown, charge can be transferred from one surface to the other via the path of the electrified air (plasma). The amount of charge transferred is dependent on the distance of separation and the gas pressure. This is one of the reasons for the toner particles to have shape factor (section 4.17.1) close to one.
6.5 Toner Charge Measurement
The electrostatic properties of the powder polymer can be quantified by determining the charge to mass ratio of the powder polymer. The powder polymer is charged by triboelectrification and must exhibit uniform charging properties to avoid unwanted effects like background development, where lower charge to mass ratio particles adhere to the non latent image areas. The different charge to mass measuring method are explained in the following sections.
6.5.1 Charge Measurement of Two component Toner
6.5.1.1 Toner Draw Off Charge Measurement System
has an insulative block with a fine mesh. A mesh size is selected that retains the carrier particles and, which allows the toner particles to pass through. The sample to be measured in the Faraday's cage is prepared by mixing a suitable quantity of toner and carrier particles.
Figure 6-2 Toner Draw Off Charge Measurement
Source: Trek Inc, Medina, New York,
http://www.trekinc.com/app_note_1001/210HS_Application_note.htm
6.5.2 Charge Measurement of Monocomponent Toner
6.5.2.1 Electric Field Migration Method - Zeta Sizer
In this method, the toner migration rate or particle velocity in the electric field is measured and the amount of electric charge on the toner particles is calculated. The Zeta sizer measures the light scattered from the laser beam as it passes through the suspension. In the absence of the electric field, the scattered light provides information about the particle size. If a slowly varying electric field is applied, the particle charge can be obtained from the fluctuating light signal (O'Brien, 1989) by determining the speed of the particle to the applies electric field. The shortcoming with this method is the difficulty in separating the toner particles into individual particles for measurement.
Figure 6-3 Zetasizer for Particle Size and Charge Measurement
Source: Malvern Instruments (UK)
www.colloidalsciencelab.com/ Equipment/zetadv.html
6.5.2.2 Developing Current Method
disadvantage with this method is that the measurement is affected by noise and loses stability (O'Brien, 1989).
6.5.2.3 Surface Potential Method
In the surface potential method, the toner is allowed to develop in a photoreceptor plate. After development, the charge on the photoreceptor is neutralized and the residual charge on the toner is measured for a given area using coulomb meters and accessories used for measuring surface potential. The main disadvantage with this method is determining the effective surface thickness of the developed toner for determining charge to mass ratio (O'Brien, 1989).
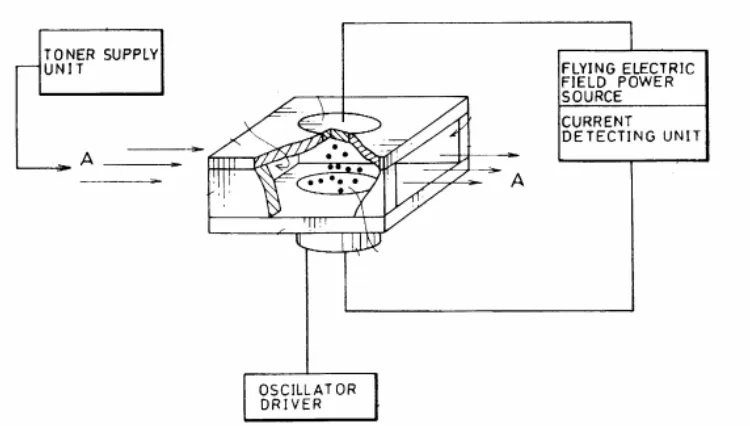
6.5.2.4 Charge Measurement by Applying a Flying Voltage
This measurement device has a lower and upper electrode provided in parallel to face each other. A flying electric field application unit is used to apply a flying electric field voltage between the electrodes, which allows the developer to fly from the lower electrode to the upper electrode. The current flowing in the upper electrode is measured to determine the charge of the developer (Wada, 1996).
Figure 6-4 Charge Measurement by the Application of Flying Voltage
6.6 Flow-ability
Toner flow properties play an important role in the development process. The triboelectric charging of toner depends on the friction between carrier particles and toner particles in a two component toner and friction between development roller and toner particles in contact charging of monocomponent toner. The toner particles must have good flow properties for uniform charging during the development process.
The height of the toner above the development roller in the development zone is limited by the doctor blade, and the toner particles must form a uniform layer without any surface distortion to present itself to the uniformly charged latent image in the photoreceptor. The toner must also exhibit good flow properties in spite of compaction by self weight in a toner cartridge. There are many factors that affect toner flow-ability, and they are explained in the following sections in detail.
6.6.1 Particle Shape and Size
Particle size and shape influence primarily the flow properties of the toner. In terms of shape, the main characteristic that affects its performance is the circularity of the powder. Circularity is defined as the ratio between the perimeter of a circle of equivalent area to the particle and the perimeter of the particle itself. Circularity can be viewed as an index of the degree of irregularities on the surface of a toner particle. So if the circularity were ‘1’ then the shape would be perfectly spherical. As this value decreases, the surface shape becomes increasingly complicated. If the average circularity of a toner is less than 0.950, the toner particles tend to become coarse. Lower circularity reduces the flowability of the particles and produces trailing phenomena in the resulting fixed image. It also generates a wide variation in electrostatic charge from particle to particle, which impacts on the quality of that image.
6.6.2 Compaction
6.6.3 Attrition
The flow properties of toner powder are altered by attrition - the wear process that occurs when particles rub against each other or against containing surfaces. Particles may change in size and shape, become more rounded or more angular. Surface coating may be lost and the bulk density may be changed.
6.6.4 Aeration and De-aeration
Air is almost always present when powders flow, and not surprisingly, the amount of air can have a dramatic affect on the flow properties. An abundance of air may be present when toner particles are conveyed and at the other extreme, a stored powder may become consolidated with time as the entrained air is gradually excluded, or at least minimized.
6.6.5 Moisture Absorption
Exposure of a toner powder to atmosphere, particularly when the relative humidity is high, may result in moisture absorption and that will change the powder flow properties.
6.6.6 Bulk Density Dependence on Attrition
As mentioned earlier, the attrition of the toner particles may result in a change in bulk density due to the change in shape of the particles. The increase in bulk density may increase toner compaction.
6.7 Toner Flow-ability Measurement
6.7.1 Hosokawa Micron Powder Characteristics Tester
In this test, the toner is left in the ambient condition of 23° C and 60% RH for 12 hours, and 5 grams of the toner is accurately measured.
Sieve of 100 mesh (150 micron), 200 mesh (75 micron) and 400 mesh (38 micron) are overlaid in this order from top to bottom, and set on a shaking table. The accurately measured 5 g of toner is gently placed on the 100 mesh sieve, and gently actuated for 15 sec with an amplitude of 1mm.The weights of the toner powder remaining in the respective sieves are measured accurately.
The flow-ability index is calculated as
Flow-ability index (%) = A+B+C
A= (toner weight remaining in the 100 mesh sieve)/5
B= (toner weight remaining in the 200 mesh sieve)/5
C= (toner weight remaining in the 400 mesh sieve)/5
The application of the Hosokawa Micron powder characteristics Tester for measuring powder flow-ability measurement is cited by Kobayashi (1993).
.
6.7.2 Flow-ability Angle of Repose (ASTM C1444-00)
spout opening of the funnel. A reference height block of 1.5 inches is placed over the base plate and the tip of the spout is set to contact the reference block to set the right height between the base plate and the spout tip of the funnel. A stop is provided to cover the opening of the sprout. The internal diameter of the spout is measured to the nearest 0.01 inches. The stopper is inserted in the funnel and the funnel is filled with toner powder till it is nearly full. The stopper is removed, and the powder is allowed to fall freely on the base plate. The powder is fed into the funnel at the same rate as the powder is discharged from the sprout opening. The powder is fed to the funnel until the apex of heap cone formed by the powder reaches the tip of the sprout. The angle of repose is calculated as
Angle of repose = tan 1[2H/(D d)] A −
−
where DA is the base diameter of the cone, d is the diameter of the sprout and His the
height of the cone.
6.8 Monocomponent Toner Resistance Measurement
The resistivity of monocomponent toner is relatively low compared with the two component developers. The monocomponent toner electroconductivity and resistivity plays an important role, since the induced charge depends on the toner resistivity. Hence, it is important to control the toner resistivity within a desired range.
A small circular test cell with electrodes is used for measuring the toner resistivity. The toner is placed in a test cell between two brass electrodes of circular cross section, each with a cross sectional area of 0.073 cm2. An insulating cylindrical sleeve made of
cell such that the final spacing between the electrodes is 0.05 to 0.1 cm and preferably as close as 0.05 cm. The final spacing is measured using a cathetometer. A voltage is applied in a series circuit arrangement consisting of the toner sample, an electric current meter and the voltage source. The toner conductivity is calculated from the voltage that appears across the electrodes and the current which flows through the closed circuit. The voltage is varied and the resulting conductivity is calculated for various fields from about 10 volts/cm to about 1000 to 4000 volts/cm. This measurement procedure is cited by Tabaru (1981).
Figure 6-5 Device for measuring Toner Resistance
Source: Tabaru, (1981), Hitachi Metals, Ltd. (Tokyo, JP)
6.9 Dry Electrostatic Toner Fusion Temperature Measurement
microscope and micro hot stage device. The microscope has a 40 to 50 X magnification. The stage of the microscope is replaced with a micro hot stage that has a heater along with devices for precise temperature control and measurement.
Figure 6-6 Microscope and Micro Hot Stage
Source: Aurther H Thomas: Manufacturer of Kofler Micro Hot Stage
Several grains of toner are transferred to a microscope slide using a spatula. The grains are accumulated in one spot to form a pile in the microscope slide. The toner is cover on top with a glass slide and is then placed over the micro hot stage. The microscope is then got into focus to reveal the sharp details of the particles in the slide. The micro hot stage is turned on and is set to heat at a rate of 3oC till 10oC below the expected fusion temperature. The rate is then adjusted to 2oC. The sample is observed through the
6.10 Caking Temperature of Dry Electrostatic Toner
Dry toners used in laser printers are normally free flowing powders at room temperatures. They are often formulated to fuse at elevated temperatures as part of the electrostatic printing process. The specific temperature at which fusing takes place has implications of premature change in the physical properties of a given toner, defined as caking or blocking. This is undesirable, but can result when the dry toner is subjected to temperatures in the range of its fusing point during conditions of transport, storage and local handling.
The caking temperature is determined using a circulating air oven with a temperature measurement device. Five grams of accurately weighed toner is spread in a round aluminum disc and placed in the circulating air oven. The circulating air oven is set at 40oC for 24 hours. The discs are then removed from the oven and allowed to cool to room temperature. The toner in the disc is then stirred with a spatula to determine any evidence of caking. If there is any clumping then the blocking temperature is recorded as below 40oC. The same test is repeated in increments of 5oC to determine any evidence of caking. If the sample does not cake at or below 80oC then the blocking temperature is recorded as above 80oC. The standard practice of determining the caking temperature of dry electrostatic toner is provided in ASTM standard F 470 - 89.
6.11 Summary
7 Experimentation
7.1 Introduction
The 3D laser printer uses a laser print engine for layer development. It is proposed to use a Teflon-coated fiberglass sheet as the receiving medium for the developed toner image from the photoreceptor of the print engine. The layer fixing in a laser printer is done by pressure temperature fusing. The same layer fixing concept is proposed to be extended for the 3D laser printer.
The proposed Teflon-coated fiberglass receiving medium and the pressure temperature fusing methods are to be evaluated for their suitability. The ability of Teflon-coated fiberglass as a receiving medium compared to paper used in the laser printer is to be evaluated by determining the weight gained by Teflon-coated fiberglass in comparison to paper after development. The 3D laser printer is under development in the Industrial Engineering department of NC state university. Researchers working on the development of the 3D laser printer are in the process of modifying the laser print engine for 3D laser printing. Since there is considerable work involved in the development of the print engine, alternative layer development techniques are considered to evaluate the effectiveness of the temperature-pressure fusing process.
The surface properties of the specimens can be evaluated to determine the suitability of depositing further layers for fixing. The strength of the specimen can be evaluated to determine the uniformity of the specimen.
The following sections provide details about the observations and experimentations done to analyze the effectiveness of layer development and fixing using a 3D laser printer.
7.2 Material Testing Station for 3D Laser Printer
The material testing station is used to test the feasibility of depositing polymer powders in a 3D laser printer. The polymer powders to be used in a laser printer must have good flow properties, consistent size and shape, proper electrostatic properties, and suitable thermal deformation properties. The development cost of a laser print engine is very high as it involves extensive experimentation to develop the right hardware and polymer powder material combination.
For this research, a material testing station was developed to identify the suitable material properties and to determine the feasibility of creating parts by layered manufacturing using a 3D laser printing. The material testing station was designed to simulate the layer development and fixing process required by a 3-D laser printer. The layer development is achieved by mechanical means and is not by electrostatic means as in laser printer. Hence, the electrostatic properties cannot be evaluated using the material testing station.
Figure 7-1 Toner container
Figure 7-2 Material Testing Station
The force applied by the pneumatic cylinder used for the heater determines the heater-polymer layer contact pressure during the fusing process. The force applied by the pneumatic cylinder is precisely controlled using a load cell. The force of the pneumatic cylinder is changed by varying the excitation voltage of the SMC electronic pressure regulator.
The toner is deposited on a base plate which has ground parallel faces. The base plate has a layer of paper on the top to provide adequate adhesion to the deposited polymer layers. A layer of water-based adhesive is used before depositing the first layer to avoid peeling of the paper layer during the deposition and fusing of subsequent layers.
engine, and the layers are fused to the previous layers by the application of pressure and temperature. The application of pressure and temperature compresses the deposited layer, hence the final fused layer thickness is less than the deposited layer thickness. In the material testing station the exact process is replicated by depositing a toner layer of constant thickness with the container. The deposited layer is fused by the application of pressure and temperature, and subsequent layers are deposited over previously fused layers.
The fusing process for every layer is done by the application of pressure and temperature. The fusing process depends on the thermal deformation behavior of the toner, which is characterized by its glass transition temperature (Tg). The glass transition temperature
divides the hard brittle regime from the soft, liquid or the flowing regime. The deposited toner particles in every layer are softened by the application of heat and are sintered together by the application of pressure. The contact geometry of two spheres in a sintering process (Frenkel, 1975) without application of pressure is given by.
t a
x
) )( 2 3 ( 2
η γ
=
Where γ is the surface energy in ergs/cm2 and η is the viscosity in poise. From the
above equation it is clear that the sintering process proceeds rapidly with low viscosity and high surface energy. The sintering process is enhanced by the application of pressure during fixing in the material testing station.
near to 90o C. The glass transition temperature was approximated from the trial conducted for fusing the toner. The change in viscosity with temperature for a polymer powder with a glass transition temperature of 90o C is given by William Landel Ferry equation (Neilsen, 1977) as
where η is the viscosity in poise, Ti is the temperature in degrees Celsius or in Kelvin
and Tg is the glass transistion temperature in degrees Celsius or in Kelvin.
The contact pressure applied for producing polystyrene-based HP4 toner specimens in the material testing station is 5.4 psi compared to the 130 psi contact pressure applied by the rollers in laser printing process. The temperature of the heater was set to 95o C for the layer fixing process. The deposited layer is therefore softened due to heating and is fused with the previously deposited layer.
Based on the viscosity variation with temperature the creep rates during fusing are given by Maxwell's theory on creep of viscoelastic materials (Riande, 2000) as
Creep rate = Stress / Dynamic Viscosity