Comparative Analysis on Structural Integrity Assessment Using Fracture
Toughness Parameters Obtained by Different Methodologies
Eduardo P. Asta 1), Francisco A. Cambiasso 1), Juan J. Balderrama 1)
1) Fracture Mechanics Research Group, Universidad Tecnologica Nacional, Facultad Regional Haedo, Argentina.
ABSTRACT
The structural integrity assessment approach enables the significance of flaws on pressure vessels, pipe lines and associate systems of nuclear power plants (NPP). The widely used documents such as CEGB R6, BSI 6493, BS 7910, SINTAP, etc. as well as life management codes such as ASME Section XI and API 579 are based on fracture analysis so that fracture toughness parameter is an essential input data. When specimen size requirements corresponding to component material to be characterized can not be fulfilled, due to actual thickness of the component or archive material is not available, it is possible to obtain the fracture parameter in terms of J, CTOD or Kc values such from small specimens fracture mechanics techniques as well as by indirect methods using correlations with Charpy-V impact energy values or transition temperatures from standard or sub- sized V notch specimens.
According to the diversity of fracture toughness parameters, this paper presents a comparative analysis applying a structural integrity assessment on primary piping component using several fracture parameters in order to evaluate the results for a engineering realistic significance, related with NPP safety analysis and life management tasks.
INTRODUCTION
The structural integrity assessment or engineering critical assessment (ECA) of nuclear reactor pressure vessels, conventional pressure vessels, pipe lines and associate systems might be evaluated according to fracture mechanics methods such as CEGB R6, BSI 6493, BS 7910 and management codes as ASME Section XI and API 579[1,2]. These methods are based on deterministic approach where the fracture toughness parameter is an essential input value to structural integrity or fitness for purpose flaw evaluation.
The fracture toughness parameters are obtained by means of standard test methods using specimens with a recommended or valid geometry. Frequently, specimen size requirements can not be obtained from the material to be characterized due to the actual thickness of the pressure retaining component is thinner than the minimum required one by the standard fracture toughness test methods. Examples of these cases can be pointed out when archive material is not available or small samples corresponding to reactor pressure vessels surveillance programs should be tested. Furthermore, the modern TM and HSLA steels, applied to pressure components, allow selecting thin plates less than 10 mm in thickness, which are under standard specimen size criteria.
Therefore it is possible to obtain the fracture toughness parameters, in terms of J, CTOD, or Kc values, such from small specimens fracture mechanics techniques as it may be using indirect methods from Charpy-V impact energy. The last one may be carried out by means either standard or subsize V notch specimens.
This paper presents a comparative analysis applying a structural integrity assessment on pressure retaining component using several fracture parameters in order to evaluate the results for a engineering realistic significance related with NPP safety analysis and life management tasks.
MATERIAL AND METHOD
In order to make a comparative evaluation an ECA´s case study on primary component of pressurized water reactor (PWR) NPP type has been evaluated. The material of component corresponds to well known nuclear quality steel ASTM A533B Cl 1, widely applied on pressure retaining components, which chemical and mechanical properties are showed in Tables 1 and 2.
Charpy-V impact tests to several temperatures have been made according to standard specification ASTM E23 in order to obtain the ductile to brittle transition curve. Charpy –V tests were made with three size of specimen thickness: standard B=10mm (B=1T), B=5mm (B=1/2T) and B=7.5mm (B=3/4T).
The fracture toughness values, in terms of KIC or KC, have been determined by indirect methods from the results of Charpy-V impact tests using Eq. (1), BSI PD6493 [3,4,5].
KIC=1.333 exp(0.0261(T- T(40J) + 88.9)) + 29.18 [MPa√m] (1)
Where:
T(40J)= transition temperature in °C at 40J Charpy-V impact energy.
For subsized Charpy-V (B=1/2T and 3/4T) no side grooved, a transition temperature correction suggested by Wallin [6] was used and which is expressed as Eq. (2).
∆T=51.4 ln(2 (B/10)0.25 –1) [°C] (2)
Where:
B=thickness in mm.
Furthermore, a correction making 10 % side grooved (SG 10%) on B= 1/2T Charpy-V specimens has been proposed. On the other hand, these fracture values have been compared against the fracture toughness results, in terms of KJc, calculated from cleavage values, Jc [KJ/m2], obtained by J integral test method according to ASTM standard E1820. The KJc values have been converted from Jc using the relationship:
KJc = (E Jc / (1- ν2)) 0.5 [MPa√m] (3)
Where: E =Young modulus [MPa], ν = Poisson´s coefficient (0.3).
All J tests have been made using SE (B) specimens with thickness B = 12.7mm (B=1/2T) and the KJc values on specimen thickness B= 25.4 mm (1T) following the statistical model on the transition region [7] and the master curve criterion, according to ASTM E1921[8,9], have been calculated.
The fracture mechanics defect assessment has been evaluated taken into consideration a surface flaw circumferentially oriented, which could be able to detected and measured on primary pipe of PWR of NPP. This pipeline has a internal diameter of 750 mm and the thickness (t) is 52 mm. The analysis considers a maximum design internal pressure of 136 bar, flaw size: 5,1 mm height (a) or 0,1t and half length(c) 10 mm
For ECA or defect assessment a FAD (Failure Assessment Diagram) evaluation were applied using BSI 6493 Level 2
Table 1. ASTM A 533B Cl.1 chemical composition %
C
S
Si
P
Mn
Mo
Ni
Cr
V
Cu
0,183 0,0035
0,24
0,019
1,47
0,50
0,66
0,12
0,007 0,15
Table 2. ASTM A 533B Cl. 1 basic mechanical properties
Tensile
Strenght
[Mpa]
Yield Strenght
[Mpa]
Elongation
[%]
Red. Area
[%]
Hardness
[HV]
617
490
23
65
200
RESULTS
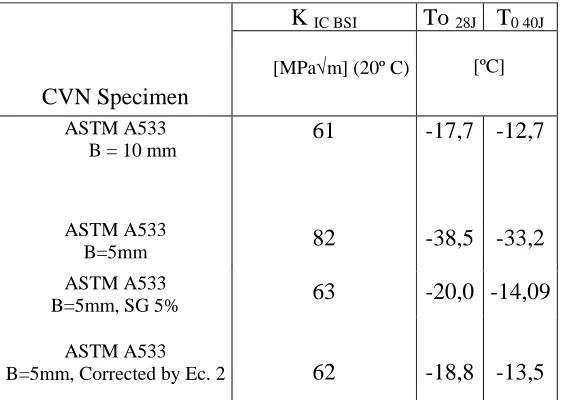
The Figure 1 shows the complete behavior, in terms of CVN/ unit of area (J/cm2) in function of the temperature, that correspond to the group of Charpy – V values for each one thickness and kind of specimen used. The Table 3 shows the fracture toughness values of A533B Cl 1 steel obtained by indirect method of BSI 6493 and the corresponding To temperatures. Both of them have been obtained on full size Charpy – V specimens, and sub-sized ones with and without corrections. Whereas Table 4 shows the fracture toughness values, in terms of KJc, from the J tests performed at room temperature with 1/2T SE (B) specimens and the ones calculated to 1T according to statistical model and master curve procedure. Finally, the Figure 2 shows ECA analysis using FAD diagram where different fracture parameters are compared in the primary piping evaluated case.
DISCUSSION AND CONCLUSIONS
The analysis is focusing on the transition region of the steel, it shows according to Table 3 that the temperature shift at transition temperatures To28J and To40J obtained with Charpy specimens, B= 10 mm and B= 5 mm, is around 20 °C. Although the agreement of CVN values obtained with SG5% sub-sized Charpy specimens is reasonably close to the values of energy given by full- size specimens (B =10 mm), such is showed in Fig. 1. On the other side, the mean difference in the values of the transition temperatures between SG5% sub- sized and full- size Charpy- V specimens has been calculated in the interval from 11 to 13% (1.4 to 2.3 °C), see Table 3. Therefore this correction is reasonably consistent, for specially engineering purpose. On the other hand the corrections made on both temperature shifts at the transition temperatures To28J and To40J using Ec. 3 show an acceptable agreement with ∆T measured between full- size and sub-sized Charpy- V specimens. Furthermore, To28J and To40J corrected by application of Ec. 2 would present a close coincidence, considering the results of this work, with those transition temperatures values obtained by alternative test method using SG5% on sub-sized specimens. A possible explanation about this agreement is related to the behavior of the steel, which exhibit a low scatter of the CVN values on the transition region, consequently size effect due to constraint reaches main significance respect to statistical fracture model.
From the point of view of fracture toughness is possible to observe that the critical fracture toughness parameter in terms of Kc, obtained by BSI 6493 indirect method using Ec.1, has shown the same behavior exhibited to transition temperature. It is the Kc values calculated by Ec. 1 corresponding to To40J temperature obtained from SG5% sub-sized Charpy-V specimens (B=5mm) results with respect to the corresponding equivalent temperature for full size standard specimens (B= 10 mm) they show a reasonability coincidence. Nevertheless is possible to appreciate an excessive conservatism of the Kc values when the ones are compared with KJc results obtained from fracture toughness test methods in terms of Jc and converted by Ec.4 as well as by application of master curve technique. However considering fracture toughness behavior in the transition region for structural steels explained according to statistical model the threshold value is significantly important. On this way the A533 Gr B material belongs to the same group of structural steels where the fracture threshold parameter has been assumed as KJc = 20 MPa√m (ASTM 1921-02) therefore the Kc value obtained by correlation with To40J temperature (Ec. 1) would trend to threshold one. In this case the reserve margin in terms of fracture toughness is less conservative and the Kc values, calculated according to Ec. 1, are more significant for ECA analysis or engineering assessment. Although should be observe that Ec.2 only takes into account thickness effect, without considers statistical fracture behavior the transition zone. Therefore the methodology of Charpy-V test with sub- sized specimens using the proposed side- grooving is a conceptual valid technique because it considers both thickness effect and statistical model.
On the other hand Figure 2 shows a highly conservative ECA evaluation using indirect fracture toughness parameters from CVN test using standard or sub- sized specimens, with or without corrections. This conclusion is easily observed in FAD format of Figure 2 when dots, corresponding to size flaw assessment postulated in this study case, they are calculated using direct fracture toughness parameters. It could be indicate that different kind of corrections on Charpy- V values from sub- sized specimen could be irrelevant if they are compared with the very important grade of conservatism on fracture toughness parameters from Charpy –V indirect methodology when, specially, the steel presents a very low scatter band in the ductile to brittle transition region.
Table 3. Fracture Toughness Values from Indirect
Method and Transition Temperature Values o ASTM A 533B Cl 1 Steel
K
IC BSITo
28JT
0 40JCVN Specimen
[MPa√m] (20º C) [ºC]
ASTM A533 B = 10 mm
ASTM A533 B=5mm ASTM A533 B=5mm, SG 5%
ASTM A533 B=5mm, Corrected by Ec. 2
61
82
63
62
-17,7
-38,5
-20,0
-18,8
-12,7
-33,2
-14,09
-13,5
Table 4. KJC fracture toughness values from testing, steel A533B Cl.1
Fracture toughness, K
Jcto 20 °C
K
Jc(1/2 T)
[Mpa
√
m]
K
Jc(1 T)
[Mpa
√
m]
K
Jcm(1 T) master curve
[Mpa
√
m]
300
247
498
Figure 1: Charpy –V impact values corresponding to material ASTM A 533B Cl 1 for several thickness specimens.
Figure 2. Validation of the defect assessment using FAD diagram. 0,00
50,00 100,00 150,00 200,00 250,00 300,00
-300 -200 -100 0 100 200 300
Temperature [ºC]
[J
/c
m
2
] 1T1/2T
1/2T SG10% 1/2T SG5% 3/4T SG6,7%
Kr
CVN10
Kr
CVN5
KrCVNSG
Kr
Jc
Kr
JcM
0
0,5
1
1,5
2
2,5
3
3,5
0
0,5
1
1,5
Sr
K
r
REFERENCES
1. Asta, E.P., Cambiasso, F.A., Balderrama, J.J., "Sistema de Evaluación de Integridad Estructural para tubos de G.N.C.",
Proc. of Jornadas SAM'97, pp.381-384, Tandil, Argentina, 1997.
2. Milne, R.A., Ainsworth, W., Dowling, A.R. and Stewart, A.T., "Assessment of Integrity of Structures Containing Defects", Rep. CEGB R/H/R6., Rev. 3, 1986.
3. Phaal, K, et al, "Correlations between Fracture Toughness and Charpy Impact Energy", TWI Report 504/1994, Dec. 1994.
4. ASME Boiler and Pressure Vessel Code, Section III and XI, Div. 1, 1995.
5. Document BSI PD 6493:1991.“ Guide on Methods for Assessing th Acceptability of Flows in Metallic Structures
6. Wallin, K., "New Improved Methodology for Selecting Charpy Toughness Criteria for Thin High Strength Steels", 11W
DOC.No X-1290-94, 1994.
7. Pérez Ipiña, J.E., Centurión, S.M., Asta, E.P, “ Mimimum Number of Specimens to Characterize Fracture Toughness in Ductile-to-Brittle Transition Region" Engn.Fracture Mech., Vol. 47, 1994, pp.457-463
8. Wallin, K., Proc. Conf. ASME PVP 1989, D. L. Mariott, T. R. Mager, W. H. Bamford(Eds.),ASME, 1989, 93-99. 9. Pisrarski, H, Wallin, K., “The SINTAP fracture toughness estimation procedure”, Engn. Fracture Mech., Vol 67, 2000