Dust evolution in pre-stellar cores
CharlèneLefèvre1,2,∗,LaurentPagani2,BilalLadjelate3,MichielMin4,HiroyukiHirashita5, andRobertZylka1
1Institut de Radioastronomie Millimétrique (IRAM), 300 rue de la Piscine, 38400 Saint-Martin d’Hères, France
2LERMA & UMR8112 du CNRS, Observatoire de Paris, PSL Research University, CNRS, Sorbonne Universités, UPMC Univ. Paris 06, F- 75014 Paris, France
3Instituto de Radioastronomía Milimétrica, IRAM, Avenida Divina Pastora 7, Local 20, E-18012, Granada, Spain
4Sterrenkundig Instituut Anton Pannekoek, University of Amsterdam, Science Park 904, 1098 XH Am-sterdam, The Netherlands
5Institute of Astronomy and Astrophysics, Academia Sinica, Astronomy–Mathematics Building, AS/NTU, No.1, Sec. 4, Roosevelt Road, Taipei 10617, Taiwan
Abstract.Dust grains are the building blocks of future planets. They evolve in size, shape and composition during the life cycle of the interstellar medium. We seek to understand the process which leads from diffuse medium grains to dust grains in the vicinity of protostars inside disks. As a first step, we pro-pose to characterize the dust evolution inside pre-stellar cores thanks to multi-wavelength observations. We will present how NIKA2 maps are crucial to bet-ter constrain dust properties and we will introduce SIGMA: a new flexible dust model in open access.
1 Introduction
Dust evolution starts at the earliest stage of star formation, during the formation of cores that slowly contract to form pre-stellar cores (PSC), to the collapse of these PSCs into protostars and protoplanetary disks (PPD). The contraction time of PSCs is still a debated question and ranges from less than 1 My [1, 2] to 10 My lifetime [3]. PSCs are dense (>105H . cm−3),
compact (<104AU) and cold (5–12 K) objects, making their study difficult. They are very opaque and most gaseous species are depleted onto grains preventing the study of the inner parts. Dust is the only tracer that is present from cloud edge to the densest part, allowing to characterize cloud density structure. Nevertheless, dust itself is a poor tracer in visible and near-infrared (NIR) since its absorption is too high to detect the reddening of the stars above AV∼50 mag. Recent observations of PSCs with Spitzer [4–6] and PPDs with SPHERE [7] in scattered light has brought hope to put more constraints on dust properties. Indeed, all parameters involved in the dust emission (dust temperature, density, grain size, emissivity and spectral index) are varying across the cloud leading to degenerate solutions when dust emission is used alone [8]. Studies combining dust scattering and emission reproduced suc-cessfully PPD observations, allowing to constrain the geometry and density structure in PPDs
∗e-mail: [email protected]
[e.g. 9]. On the other hand, a consistent multi-wavelength modeling of PSCs remains an un-achieved goal. Grain emissivity in the far–infrared (FIR) has been linked consistently to its absorption efficiency in the near–infrared (NIR) at short wavelengths only [10] or at low resolution with 5Planck data [11], and thus never reproducing observations of the densest
part. With our on-going NIKA2 open time Program, we aim at building a consistent multi-wavelength picture of two neighbor molecular clouds, L183 and L134 (116±6 pc [C. Zucker priv. comm.] and 107±5 pc [12] respectively) hosting 4 PSCs.
2 Method
2.1 Constraints obtained from other wavelengths
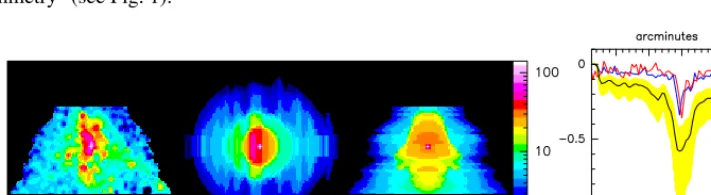
The first step of our approach is to build a 3D density model of the cloud independently from scattered light or degenerated emission process. Our density model relies on dust extinction as measured by reddening in the NIR, and the PSC densities are deduced from molecular observations of N2H+and N2D+[6, 13], assuming thermalized gas and dust and rotational symmetry1(see Fig. 1).
Figure 1. AVmaps of L183 with color scale in magnitudes. The 3D density model is based on NIR extinction of background stars and N2H+and N2D+observations for the PSC [6]. From left to right: facing the cloud, from above, from the side. Right panel: 8µm cut profile through the PSC with observations in red, modeling in blue, and modeling without the scattering contribution in black with uncertainties from background estimation in yellow.
Regarding dust properties, we rely on mid-infrared (MIR) scattering to constrain dust ge-ometries (shape and sizes). In particular, to reproduce MIR observations of L183 we demon-strate that an important fraction of large aggregates with an equivalent size of 4µm [14] is requested, in particular to explain the scattering contribution remaining at 8µm [6, and Fig. 1 right]. Though the grain model we proposed has the suitable geometry to explain MIR obser-vations, its emissivity is too high in the FIR/mm (see Fig. 2). While the dust size and porosity are well constrained by MIR scattering (called coreshine), the dust emissivity strongly varies depending on their composition. Recent laboratory measurements show the impact of the iron fraction inside silicates on dust emissivity [15, 16]. Here, the silicates included in the dust mixture are pure enstatite (MgSiO3, 75%) mixed with iron sulfides (FeS, 10%) and car-bonaceous (15%). We developed a code to test the impact of dust composition, in particular silicates and ice mantles, on dust emissivities. SIGMA is an open access code2 to compute the dust properties of icy aggregates from NIR to mm wavelengths based on laboratory mea-surements (see Sect. 2.2). While we have already found a reasonable solution to model L183 1Though simplistic hypothesis, some limits on the clumpiness of the PSC can also be obtained from self-absorbed
scattering, as observed for L183.
[e.g. 9]. On the other hand, a consistent multi-wavelength modeling of PSCs remains an un-achieved goal. Grain emissivity in the far–infrared (FIR) has been linked consistently to its absorption efficiency in the near–infrared (NIR) at short wavelengths only [10] or at low
resolution with 5Planck data [11], and thus never reproducing observations of the densest
part. With our on-going NIKA2 open time Program, we aim at building a consistent multi-wavelength picture of two neighbor molecular clouds, L183 and L134 (116±6 pc [C. Zucker priv. comm.] and 107±5 pc [12] respectively) hosting 4 PSCs.
2 Method
2.1 Constraints obtained from other wavelengths
The first step of our approach is to build a 3D density model of the cloud independently from scattered light or degenerated emission process. Our density model relies on dust extinction as measured by reddening in the NIR, and the PSC densities are deduced from molecular observations of N2H+and N2D+[6, 13], assuming thermalized gas and dust and rotational
symmetry1(see Fig. 1).
Figure 1. AVmaps of L183 with color scale in magnitudes. The 3D density model is based on NIR
extinction of background stars and N2H+and N2D+observations for the PSC [6]. From left to right:
facing the cloud, from above, from the side. Right panel: 8µm cut profile through the PSC with
observations in red, modeling in blue, and modeling without the scattering contribution in black with uncertainties from background estimation in yellow.
Regarding dust properties, we rely on mid-infrared (MIR) scattering to constrain dust ge-ometries (shape and sizes). In particular, to reproduce MIR observations of L183 we demon-strate that an important fraction of large aggregates with an equivalent size of 4µm [14] is requested, in particular to explain the scattering contribution remaining at 8µm [6, and Fig. 1 right]. Though the grain model we proposed has the suitable geometry to explain MIR obser-vations, its emissivity is too high in the FIR/mm (see Fig. 2). While the dust size and porosity
are well constrained by MIR scattering (called coreshine), the dust emissivity strongly varies depending on their composition. Recent laboratory measurements show the impact of the iron fraction inside silicates on dust emissivity [15, 16]. Here, the silicates included in the dust mixture are pure enstatite (MgSiO3, 75%) mixed with iron sulfides (FeS, 10%) and car-bonaceous (15%). We developed a code to test the impact of dust composition, in particular silicates and ice mantles, on dust emissivities. SIGMA is an open access code2 to compute
the dust properties of icy aggregates from NIR to mm wavelengths based on laboratory mea-surements (see Sect. 2.2). While we have already found a reasonable solution to model L183
1Though simplistic hypothesis, some limits on the clumpiness of the PSC can also be obtained from self-absorbed scattering, as observed for L183.
2https://github.com/charlenelefevre/SIGMA
in the NIR and MIR [6], the NIKA2 data will help to derive the best grain composition thanks to SIGMA and 3D radiative transfer modeling.
Figure 2. Herschel observations on left column at 250µm, 350µm, and 500µm and corresponding modeled maps on right side using the dust model and density profile built from MIR scattering [6].
Color scale is in MJy/sr, box size is 40. The 500µm modeled map shows a clear excess of emission
towards the PSC suggesting that the dust population suitable to explain scattering observations is too emissive.
2.2 SIGMA: a new tool to compute dust properties
Dust grains evolve from bare simple elongated shape in the diffuse medium to large icy
aggregates with irregular shapes inside dense cores. While dust properties in the diffuse
be able to relax free parameters like dust composition to better reproduce multi-wavelength observations.
SIGMA (Simple Icy Grain Model for Aggregates) relies on effective medium theory to compute refractive indexes from laboratory measurements and Mie theory applied to a distri-bution of hollow spheres (DHS) to mimic non–spherical dust shapes. An important charac-teristic of the DHS method is to reproduce the increased absorption opacity in the Rayleigh regime with respect to pure spherical shape. This emissivity enhancement is at least a fac-tor of 2–3 compared to spherical shape (see Fig. 3, left). Also, the DHS method has been shown to be very effective in reproducing the properties of natural samples of complex parti-cle shapes, including the correct positions of features related to solid-state resonances [17–19, and Fig. 3]. Attached to SIGMA, we also computed a set of dust size distributions representa-tive of dynamical coagulation (see Fig. 3, right). Our goal is to characterize the dust evolution of the size distribution with temperature and density based on coagulation computation as a function of turbulence [20, 21]. SIGMA is able to deal with such size distributions including variable porosity as a function of size.
Figure 3. Left:Dust emissivities for three dust models obtained with SIGMA: the first one made of a mixture of dust grains suitable to explain coreshine observations of L183 [6, 14] in black, the same model with spherical shape instead of aggregates to show the enhancement of the emissivity in orange, and the last one including thin ice mantles (24% in volume) in blue. Right: Dust size distribution evolution (solid lines) representative of a cloud contraction to reach 106H.cm−3. We start from standard diffuse medium size distribution (in black). Red solid line describes the dust size distribution after 0.5 My of evolution at constant porosity of 90% [21], while brown curve takes into account that we start from non porous grains. Finally, blue and magenta curves are the evolution at non constant porosity after 2 My and 5 My, respectively. Porosity as a function of size for the different dust distributions are represented with dashed lines, 90% corresponding to the compaction limit [20].
3 NIKA2 observations
L183 is about the Moon size while L134 is slightly smaller (see Fig. 5). We mapped L183 on∼450 arcmin2 divided in two strips to keep the total integration time relatively short for each strip. We divided each strip in 3 on the fly (OTF) maps of∼1000 s each with a mapping speed of 60 s−1. One OTF map is along the main direction of the strip and the two others with scanning direction±30◦ from the main direction to avoid artifacts (see Fig. 5). The
be able to relax free parameters like dust composition to better reproduce multi-wavelength observations.
SIGMA (Simple Icy Grain Model for Aggregates) relies on effective medium theory to compute refractive indexes from laboratory measurements and Mie theory applied to a distri-bution of hollow spheres (DHS) to mimic non–spherical dust shapes. An important charac-teristic of the DHS method is to reproduce the increased absorption opacity in the Rayleigh regime with respect to pure spherical shape. This emissivity enhancement is at least a fac-tor of 2–3 compared to spherical shape (see Fig. 3, left). Also, the DHS method has been shown to be very effective in reproducing the properties of natural samples of complex parti-cle shapes, including the correct positions of features related to solid-state resonances [17–19, and Fig. 3]. Attached to SIGMA, we also computed a set of dust size distributions representa-tive of dynamical coagulation (see Fig. 3, right). Our goal is to characterize the dust evolution of the size distribution with temperature and density based on coagulation computation as a function of turbulence [20, 21]. SIGMA is able to deal with such size distributions including variable porosity as a function of size.
Figure 3. Left:Dust emissivities for three dust models obtained with SIGMA: the first one made of a mixture of dust grains suitable to explain coreshine observations of L183 [6, 14] in black, the same model with spherical shape instead of aggregates to show the enhancement of the emissivity in orange, and the last one including thin ice mantles (24% in volume) in blue. Right: Dust size distribution evolution (solid lines) representative of a cloud contraction to reach 106H.cm−3. We start from standard diffuse medium size distribution (in black). Red solid line describes the dust size distribution after 0.5 My of evolution at constant porosity of 90% [21], while brown curve takes into account that we start from non porous grains. Finally, blue and magenta curves are the evolution at non constant porosity after 2 My and 5 My, respectively. Porosity as a function of size for the different dust distributions are represented with dashed lines, 90% corresponding to the compaction limit [20].
3 NIKA2 observations
L183 is about the Moon size while L134 is slightly smaller (see Fig. 5). We mapped L183 on∼450 arcmin2divided in two strips to keep the total integration time relatively short for each strip. We divided each strip in 3 on the fly (OTF) maps of∼1000 s each with a mapping speed of 60 s−1. One OTF map is along the main direction of the strip and the two others with scanning direction±30◦ from the main direction to avoid artifacts (see Fig. 5). The
average conditions during the observations wereτ225∼0.14 corresponding to a precipitable
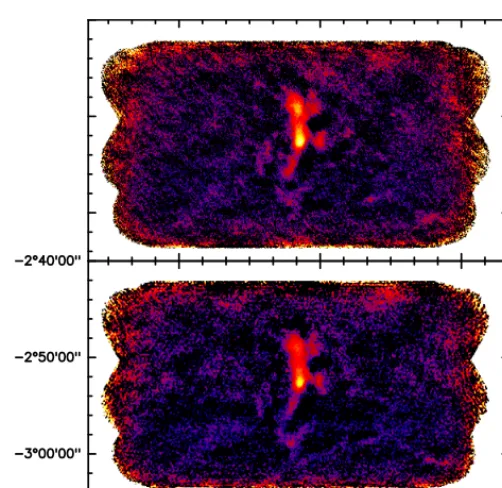
Figure 4.NIKA2 maps of L183 at 1.15 mm (upper panel) and 2 mm (bottom panel) obtained with∼8 hours on source. Data reduction was done with PIIC, color scale is in mJy/beam.
water vapor (PWV)∼3 mm. While the degradation of the integration time going from 2 to 4 mm of PWV is only 50 %, the sky noise can become a real problem with high PWV for very extended maps of weak emission. L183 observations were completed in 2019 (see Fig. 4), but L134 observations are still on-going. We observed last missing data of L134 in N2H+with EMIR on early July 2018, and started to build a consistent cloud model of L134. Three over four of the PSCs are detected with our current NIKA2 observations but one is interestingly still not yet detected (L134N) despite its coreshine brightness comparable to others (see Fig. 5).
First, we will revisit the dust content of L183 thanks to NIKA2 data. In particular, we aim at: • better constraining dust composition (silicates and ice mantles)
• find a suitable solution to match MIR and mm observations
• revisit dust size distributions made of aggregates mixing not only 2 components but making use of our coagulated dust size distributions.
Strip 1 Strip 2
Strip 3 L134N
L134S
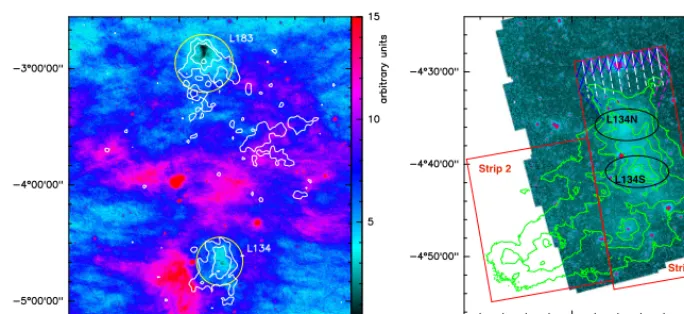
Figure 5. Left:WISE extinction image of L183 and L134 at 12µm. The yellow circles represent the external limits inside which the NIKA2 maps will be performed (30for L183,∼25for L134). Right: Spitzer IRAC 1 (3.6µm) image of L134 with Herschel SPIRE 250µm contours superimposed. The diffuse emission in cyan is the coreshine effect. The black ellipses indicate the position of the depleted core (L134N, no C18O, strong NH
3 and N2H+emission) and of the undepleted core (L134S, C18O emission). The three red boxes trace the regions to be mapped with NIKA2 (∼465 arcmin2in total). When the box is elongated we will use three sweeping methods: along the main axis (white) or with 30◦angles (blue and magenta) to limit artifacts.
References
[1] L. Pagani, P. Lesaffre, M. Jorfi, et al., A&A 551, A38 (2013)
[2] B. Körtgen, S. Bovino, D. R. G. Schleicher, et al., MNRAS, 469, 2602 (2017) [3] T. Mouschovias, K. Tassis, M. Kunz, ApJ 646, 1043 (2006)
[4] L. Pagani, J. Steinacker, A. Bacmann, et al., Science, 329, 1622 (2010) [5] C. Lefèvre, L. Pagani, M. Juvela, et al., A&A, 572, A20 (2014) [6] C. Lefèvre, L. Pagani, M. Min, et al, A&A, 585, L4 (2016)
[7] A. Garufi, M. Benisty, T. Stolker, et al., The Messenger, 169, p. 32-37 (2017) [8] L. Pagani, C. Lefèvre, M. Juvela, et al., A&A, 574, L5 (2015)
[9] M. Villenave, M. Benisty, W. R. F. Dent, et al., A&A, 624, A7 (2019) [10] M. Juvela, I. Ristorcelli, D. J. Marshall, et al., A&A, 584, A93, (2015a) [11] M. Juvela, K. Demyk, Y. Doi, et al., A&A, 584, A94, (2015b)
[12] C. Zucker, J. Speagle, E. F. Schlafly, ApJ, 879, 125 (2019)
[13] L. Pagani, A. Bacmann, S. Cabrit & C. Vastel, A&A, 467, 179, (2007) [14] M. Min, C. Rab, P. Woitke, C. Dominik & F. Menard, A&A, 585, A13 (2016) [15] K. Demyk, C. Meny, X. H. Lu, et al., A&A, 600, A123, (2017a)
![Figure 2. Herschel observations on left column at 250modeled maps on right side using the dust model and density profile built from MIR scattering [6].Color scale is in MJy µm, 350 µm, and 500 µm and corresponding/sr, box size is 40′](https://thumb-us.123doks.com/thumbv2/123dok_us/8118012.1352890/3.512.122.359.109.488/figure-herschel-observations-modeled-density-prole-scattering-corresponding.webp)
![Figure 3. Left: Dust emissivities for three dust models obtained with SIGMA: the first one made ofevolution (solid lines) representative of a cloud contraction to reach 10a mixture of dust grains suitable to explain coreshine observations of L183 [6, 14] in](https://thumb-us.123doks.com/thumbv2/123dok_us/8118012.1352890/4.512.75.449.285.416/emissivities-obtained-ofevolution-representative-contraction-suitable-coreshine-observations.webp)