Detection and Avoidance of Sensor Data Origin Falsification in Wireless
Sensor Network
Prof. Vani B1, Mr. Mahesh B2
1 Associate Professor, Department of C.S.E, Sambhram Institute of Technology, Bengaluru, Karnataka, India 2
M.Tech student, Department of C.S.E, Sambhram Institute of Technology, Bengaluru, Karnataka, India
Abstract
Very large sensor networks are used in number of application fields, and the information they collect are used in judgment making for important infrastructures. information are collected from many sources from intermediate processing nodes that collect data. A fake adversary may introduce extra nodes in the network. So, promise of high information reliability is important for correct decision-making. It is a scheme to safely pass on provenance for sensor data. The source node generates the secure provenance data. Intermediate nodes encode the provenance with their vertex.id. Provenance collection and verification are done at the base station. The scheme is enhanced to include a secret session key is generated in the source to avoid provenance forgery and packet drop attacks. The enhanced method is evaluated both systematically and empirically, and the results show the effectiveness of the enhanced scheme.
Keywords: Adversary, Network, Provenance, Forgery, Bandwidth.
1. Introduction
Wireless Sensor Networks are geographically arranged individual sensors to detect physical or environmental data, like heat, noise, pressure, etc. and jointly send data along network to base station. The recent network has two way data transmission, which includes controlling the input sensor data. Improvements in wireless sensor network are influenced with military works like war ground supervision. Nowadays sensor is used in many industrial as well as consumer field, like monitoring and controlling industrial process, verifying the health of machines etc.
Wireless sensor networks are built of few nodes to very large no of nodes. In which each nodes sends sensor data to the base station. Each nodes will be having various components: radio transceiver which might have a internal or an external antenna. It can also include a micro controller it its components. For interaction with the sensor an electronic circuits will be present. And finally an important part is the energy source should be present. Sometimes the energy can embedded inside the sensor or a some energy harvesting technique have to be used. The sensor nodes come in various sizes ranges from very small size like grain of dust to a some moderate size like of a shoebox. The sensor nodes are of microscopic size are yet to be created.
Some sensor nodes may cost vey less such as few dollars, where as some sensor nodes may cost several hundred dollars. The cost of sensor nodes depends on the complexity of the sensor nodes. The cost and size constraints will result in same kind of constraints on resources like computational speed, energy consumption and size of bandwidth used for communication. There are also various types of design like a star topology which is a simple to a very complex design like multiple node design. The routing method is the communication technique used in nodes.
Recent study [1] showed the important role of data origin in network in which the application of unreliable information will result in major damages. Even though provenance design, collection, and query is studied widely for execution as well as curate data [2], [3], data origin in network is not properly studied.
Finding issue of safe, reliable data origin computation in sensor networks, and use data origin to know whether a data path falsification has occurred or not. Conventional provenance safety methods adopt more encryption [5]. in contrary, adoption of message authentication code schemes and use of provenance data, is efficient to represent provenance.
1.1 Problem Statement
1.2 Existing System.
In the existing system we consider a source node, intermediate nodes and a base station. Initially the source node generates the provenance data and sends to intermediate nodes, intermediate nodes upon receiving provenance data from the source node adds its own provenance data such as a vertex.id and transmits to the base node. Then base node collects data path and store it for further verification.
The base station decodes the provenance data and knows the data path followed by the packets. If any malicious nodes send the data to base station, base station identifies the difference in the origin of data. Then the base station indicates a data origin falsification has occurred in the network.
1.3 Disadvantages of Existing System
1) The use of unreliable information will lead to major failures.
2) This scheme is difficult to implement where there are more number of malicious nodes.
3) If a adversary comes to know the secret session key by any means then the system cannot avoid the data origin falsification.
2. Literature Survey
H. Lim et al have proposed “Provenance-Based Trustworthiness Assessment in Sensor Networks,” [1]. They show a method checking the reliability of sensor data. Their method use the origin of data which use their values to calculate trust scores, which is quantity of reliability. The value principle comes from “the more similar values for the same event, the higher the trust score”. The similarity of the origin of data is based on the fact that “the more different data provenance with similar values, the higher the trust scores.
K. Muniswamy-Reddy, et al have proposed “Provenance-Aware Storage systems,” [3].This survey states that many node network by using the data origin scheme the Base station know data packet path.
R. Hasan et al have proposed “The Case of the FakePicasso: Preventing History Forgery with Secure Provenance,” [5]. They indicate the data origin information can be assured with high confidentiality and integrity. It includes tracking of data path by observing data writes in the application layer.
S.Roy et al have proposed “Secure Data Aggregation in Wireless Sensor Networks,”[15]. This work of forgery against packet broadcast. This aggregation work shows data origin checking at the Base Station.
A. Ramachandran et al have proposed “Packets with Provenance” [26]. This scheme identifies data path in sensor nodes based on per packet tags. The identified information stores data path and tasks performed on data packets as well as modifications done on those data packets.
W. Zhou et al have proposed “Querying and Maintenance of Network Provenance at Internet Scale” [27]. It identifies the sub part of the state of the network as well as the history of the network. The distribution in network instruction resulted in this scheme. The disadvantage of this scheme is that it will not include safety issues and it can be applied to only some network cases.
W. Zhou et al have proposed “Secure Network Provenance” [28]. This approach include calculation of data path origin in an environment where many adversaries are present. The disadvantage is even after these systems are designed for securing origin of data path, they not suited for networks where there are limited no of resources.
A. Syalim et al have proposed “Preserving Integrity and Confidentiality of a Directed Acyclic Graph Model of Provenance” [29]. They propose a chain method to ensure data path origin integrity (no one can see the data other than original user) by using encryption, mechanism.
N. Vijayakumar et al have proposed “Towards Low Overhead Provenance Tracking in Near Real-Time Stream Filtering” [30]. This system is an task system for collection of data origin. The disadvantage here is the system computes the path of data after the data transmission.
S. Chong et al have proposed “Self-Identifying Sensor Data” [31]. This scheme tell that the origin of the data in present inside the original data. it shows the problems related to the Integrity and efficiency but never considered like a safety method.
2.2 Proposed System
so the fake node cannot do the provenance forgery. Since the new fake node does not have the secret session key it cannot have access to data packets and it cannot drop the packets either.
2.3 Advantages of Proposed System
1) Allows the Base Station to identify if a data path falsification is caused by a fake node or not.
2) Use of fast message authentication code schemes and provenance makes this scheme efficient, secure and reliable.
3) Creation of the secret session key avoids the malicious nodes from provenance forgery and packet drop attacks.
3. SYSTEM DESIGN
System design is a task of converting requirements to illustrate the software. Here user requirements are converted into final software package as per the requirement. SDLC is a norm to develop the software. Software development life cycle has various phases such as Requirement collection, Feasibility study, design, coding and Testing.
3.1 System Architecture
Fig 1: system architecture
The system architecture shows in block diagrams the basic working of the application, initially the source node basic packets consists of sequence numbers, data values, and the in packet blue filter.
The intermediate nodes performs provenance encoding which is data and provenance aggregation. Base station decodes and checks the data path followed. Finally the
source node generates a session key, which is present only with the nodes recognized by the base station.
Any new adversary node trying to send data to base station is denied since it does not know the session key. And hence we can avoid the provenance forgery which is efficient in many topologies.
3.2 Data Flow Diagram
DFD is representation of how the data flows along a data processing system. It also shows how data is transferred from one component of a node to another component in the sensor network. The data model describes the flow of data in the project.
Initially the data traffic is generated at the nodes. Then the data goes along the network deployment. The data is also stored along with the node information in the table during the network discovery stage. In data transmission stage, data is transferred to all nodes.
Fig 2: data flow diagram
During the provenance encoding at the nodes, the data is also appended into the in-packet bloom filter. In base station when the data path is decoded, data will be extracted and stored in the base station.
The data that is transferred in the network is used for performance analysis using the throughput. Finally results of the performance are displayed in graphs.
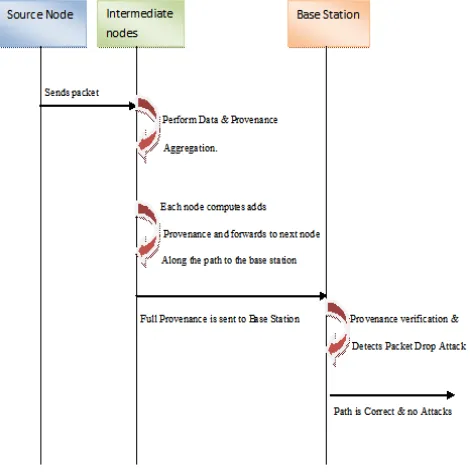
3.3 Sequence Diagram
Sequence diagram shows the sequence of process carried out during the working of the application. It shows the relationship or interaction between the communicating entities.
It is a task of building communication progression chart. It shows how the sequences are interacted with respect to time interval.
Fig 3: sequence diagram
It shows the source node sends a data to the intermediate nodes. The intermediate nodes perform various operations. First process is data and provenance aggregation. Then each node computes new provenance from children produces partial aggregated provenance.
Finally the full aggregated provenance is generated which will be transmitted to base station. Then Base station performs the process of provenance verification and detection of packet drop attacks. Finally base station checks whether all paths are correct and checks whether there are attacks are not in the network.
-
4. IMPLEMENTATION
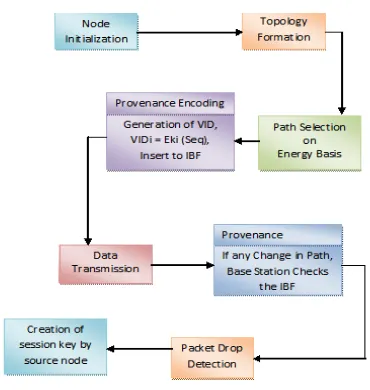
4.1 Flow chart
Fig 4: flow chart
4.2 Algorithms
Algorithms are the list of step by step process of operations carried out in a particular sequence. Algorithms are used to achieve a particular task using various functions.
4.2.1 Algorithm for Detection of Provenance Forgery
Step 1: Node Initialization Step 2: Topology Formation.
Step 3: Source and Destination Selection.
Step 4: Selecting path from Source to Destination Step 5: Provenance Encoding.
a) Generation of Vertex.id,
b) Insert Vertex.id to Provenance, for each Intermediate nodes.
Step 6: Provenance Decoding. a) Data Transmission.
b) If any Change in Data Path, Provenance Decoding takes place.
Step 7: Detection of Provenance forgery and packet drop attack.
Step 8: Creation of secret session key by the source node to avoid provenance forgery.
4.2.2 Provenance Collection
Input: received packet sequence, provenance data, set of nodes N,
Step 1: initialize Set of possible nodes to zero. Provenance is assigned to zero.
Step 2: determine set of possible nodes in the path and build Provenance.
For each node that belongs to set of nodes do Vertex.id = Generate Vertex.id (node, sequence);
If Vertex.id is in provenance then
add node to set of possible nodes. Insert Vertex.id into Provenance. End if
End for
Step 3: Verify Provenance with the Received Provenance
If (Provenance = Received Provenance) then return set of possible nodes
Else
return NULL End if
5.
Results and AnalysisThis section describes results of methods outlined in the previous sections. The speed of simulation is randomly chosen to be between 20-30m/s. Here source node generates packets with a size of 256 bytes. The antenna
used is Omni Antenna. The traffic used is CBR.. The no of nodes can be changed in the TCL file.
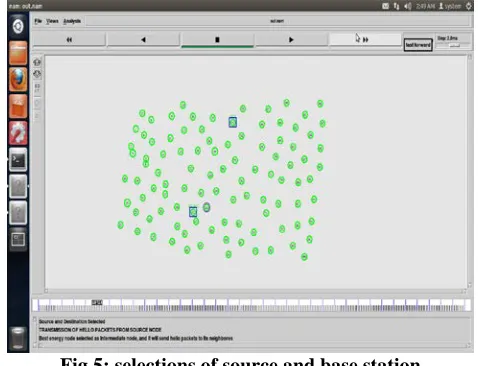
Fig 5: selections of source and base station
Fig 5 shows snapshot for 100 nodes. It shows selection of source and base station. Then transmission of hell packets from source node to the highest energy intermediate node takes place. Finally intermediate node will send hello packets to its neighbors.
Fig 6: broadcasting the RREQ from source to neighboring nodes
Fig 7: fake node is trying to get RREQ
Fig 7: show that a malicious node is trying to get RREQ. But, it is dropping because RREQ is secured by a secret session key.
Fig 8: graph of Packet delivery ratio for 100 nodes Fig 8 shows that the enhanced method have higher packet delivery ratio than when compared to existing method.
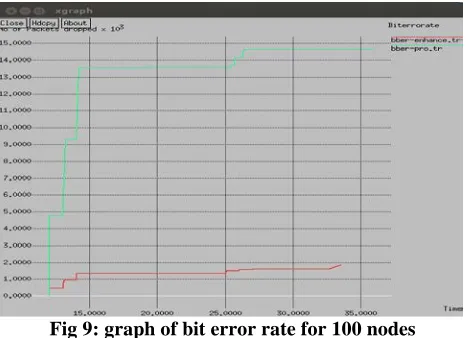
Fig 9: graph of bit error rate for 100 nodes
Fig 9 shows the graph of no of packets dropped with respect to time which is compared between existing and the enhanced method. We observe that bit error rate is of enhanced method is significantly very low when compared to existing method.
Fig 10: Comparison graph of control overhead packets for 100 nodes
In Fig 10 the no of control overhead packets is compared over time. We can observe that the existing system have 15 overhead packets where as the enhanced method have only 3 control overhead packets at time = 20 seconds.
Fig 11: graph of throughput for 100 nodes In Fig 11 we compare the throughput of existing system and the enhanced system. By observing the graph we can easily say that the when compared to existing system, the throughput in the enhanced system has been increased.
Fig 12: Comparison graph of end to end packet latency for 100 nodes
6. Conclusion
This scheme ensures privacy and reliability of origin of data. Included the data and data path aggregation, also include packet sequence no which will allow detection of data origin falsification. Further enhancement of the existing scheme include, avoidance of data origin falsification, using a secret session key. Finally experimental and investigative research indicates that enhanced scheme is effective. In future the prototype can be built which includes the safe data origin method which can be made to work in real time. The accuracy of detection of data path falsification can also be increased.
References
[1] H. Lim, Y. Moon, and E. Bertino, “Provenance-Based Trustworthiness Assessment in Sensor Networks,” Proc. Seventh Int’l Workshop Data Management for Sensor Networks, pp. 2-7, 2010.
[2] I. Foster, J. Vockler, M. Wilde, and Y. Zhao, “Chimera: A Virtual Data System for Representing, Querying, and Automating Data Derivation,” Proc. Conf. Scientific and Statistical Database Management, pp. 37-46, 2002.
[3] K. Muniswamy-Reddy, D. Holland, U. Braun, and M. Seltzer, “Provenance-Aware Storage systems,” Proc. USENIX Ann. Technical Conf., pp. 4-4, 2006.
[4] Y. Simmhan, B. Plale, and D. Gannon, “A Survey of Data Provenance in E-Science,” ACMSIGMOD Record, vol. 34, pp. 31-36, 2005.
[5] R. Hasan, R. Sion, and M. Winslett, “The Case of the Fake Picasso: Preventing History Forgery with Secure Provenance,” Proc. Seventh Conf. File and Storage Technologies (FAST), pp. 1-14, 2009.
[6] C. Rothenberg, C.Macapuna, M.Magalhaes, F. Verdi, and A. Wiesmaier, “In-Packet Bloom Filters: Design and Networking Applications,” Computer Networks, vol. 55, no. 6, pp. 1364-1378, 2011.
[7] M. Garofalakis, J. Hellerstein, and P. Maniatis, “Proof Sketches: Verifiable In-Netwok Aggregation,” Proc. IEEE 23rd Int’l Conf. Data Eng. (ICDE), pp. 84-89, 2007.
[8] T. Wolf, “Data Path Credentials for High-Performance Capabilities- Based Networks,” Proc. ACM/IEEE Symp. Architectures for Networking and Comm. Systems, pp. 129-130, 2008.
[9] H. Chan, A. Perrig, and D. Song, “Secure Hierarchical In-Network Aggregation in Sensor In-Networks,” Proc. Conf. Computer and Comm. Security (CCS), pp. 278-287, 2006. [10]S. Roy, M. Conti, S. Setia, and S. Jajodia, “Secure Data
Aggregation in Wireless Sensor Networks,” IEEE Trans. Information Forensics and Security, vol. 7, no. 3, pp. 1040-1052, June 2012.
[11] C. Rothenberg, C.Macapuna,M.Magalhaes, F. Verdi, and A. Wiesmaier, “In-Packet Bloom Filters: Design and Networking Applications,” Computer Networks, vol. 55, no. 6, pp. 1364-1378, 2011.
[12]M. Garofalakis, J. Hellerstein, and P. Maniatis, “Proof Sketches: Verifiable In-Netwok Aggregation,” Proc. IEEE 23rd Int’l Conf. Data Eng. (ICDE), pp. 84-89, 2007.
[13]T. Wolf, “Data Path Credentials for High-Performance Capabilities- Based Networks,” Proc. ACM/IEEE Symp. Architectures for Networking and Comm. Systems, pp. 129-130, 2008.
[14]H. Chan, A. Perrig, and D. Song, “Secure Hierarchical In-Network Aggregation in Sensor In-Networks,” Proc. Conf. Computer and Comm. Security (CCS), pp. 278-287, 2006. [15]S. Roy, M. Conti, S. Setia, and S. Jajodia, “Secure Data
Aggregation in Wireless Sensor Networks,” IEEE Trans. Information Forensics and Security, vol. 7, no. 3, pp. 1040-1052, June 2012.
Websites:
[16] TCL tutorial www.tcl.tk/man/tcl8.5/tutorial/tcltutorial.html