WORK AND ABSENCE FROM WORK
Fiona Mary North
A thesis submitted for the degree of Doctor of Philosophy
at University College London
ABSTRACT
This study assesses risk factors for sickness absence in the British civil service. As one component of a large study of psychosocial factors and health, 10,314 civil servants between the age of 35 and 55 completed questionnaires about their work environment, social circumstances outside work, health and health-related behaviours. To obtain a more objective measure of the work environment, personnel managers provided external assessments of participants' jobs. The baseline variables were related to rates of short spells (7 days or less) and long spells (more than 7 days) of sickness absence for 85% of participants, over a mean period of 20 months (6-26 months).
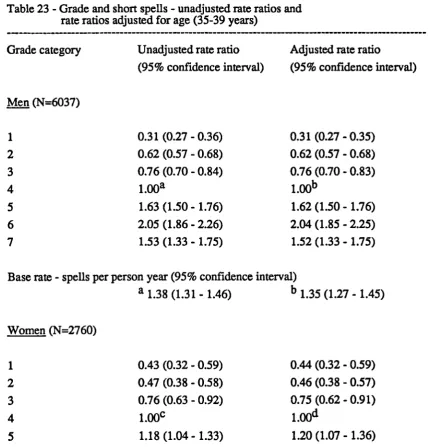
There were striking grade differences in sickness absence, with a stepwise increase in rates of both short and long spells from top administrators to clerical and office support staff. Other identified risk factors explained only a third of these grade differences in sickness absence.
Further analyses were adjusted for age and grade. Self-reported health was strongly related to rates of long spells and, to a lesser extent, short spells. Adequacy of support and difficulty paying bills were the two factors outside work which related to rates of both short and long spells.
Job satisfaction was the only measure of the work environment which related to rates of both short and long spells. Other aspects of the work environment which were associated with increased rates of short spells were low variety and skill use and low support at work for both sexes, and low control, slow work pace and few conflicting demands for men. Self-reports and external assessments of the work environment related to sickness absence
in a similar way, suggesting that the work environment itself was important.
Factors which did not relate to either short or long spells of sickness absence were marital status, dependent children, the frequency of social contacts and physical activity.
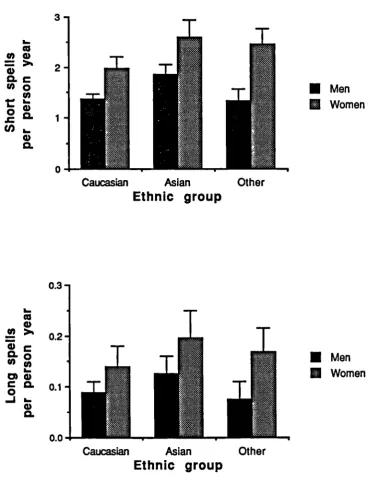
Women had higher rates of sickness absence than men and Asians had higher rates than Caucasians.
ACKNOWLEDGEMENTS
This study was one component of a large research programme which depended on the cooperation and assistance of a number of people. I particularly want to thank my supervisor, Michael Marmot, for his guidance and encouragement. I also want to thank Len Syme who worked with me on the external assessments, for his stimulating
discussions; Mandy Feeney who managed the data, for her help in so many ways; Jenny Head for statistical advice and help with computing; Stephen Stansfeld who developed the social support indices and other members of the 'Stress and Health' team who kept this study going. I also want to thank Michael Hill for his discussions on a number of
statistical issues, Graham Dunn for practical advice on principal component analyses and Peter Hayes for his help organising the tables.
This study was undertaken in collaboration with the Civil Service Occupational Health Service. I particularly want to thank Adrian Semmence, George Sorrie and Frank
O'Hara for their support for this study, and Tony Phillips and Norma Norgate-Bennett for their time and advice in the pilot phase of the external assessments.
This work was completed with the support of a Grant-in-Aid from the National Heart Foundation of New Zealand in the first year, and an Overseas Research Fellowship from the Medical Research Council of New Zealand in the second and third years. In addition, an Overseas Research Students Award from the Committee of Vice-Chancellors and Principals of the Universities of the United Kingdom made enrolment for this degree possible.
I want to thank everyone in the Department of Community Medicine at University College London who made this work and my time in London so enjoyable, and in
particular Fiona Blyth for her support and friendship. I also want to thank members of the Department of Preventive and Social Medicine at the University of Otago who gave me the time and encouragement needed to fmish writing this thesis.
STATEMENT OF PERSONAL CONTRIBUTION
I worked on the Whitehall II Study for three and a half years between July 1986 and December 1989. During this time I collected the baseline and follow-up data presented in this thesis. The baseline data consisted of questionnaires obtained at the screening clinics and external assessments of participants' jobs.
I contributed to the organisation of the screening clinics at different work sites. This involved liaising with personnel staff and arranging the necessary clinic facilities, recruiting and training field staff, visiting the clinics regularly, retraining field staff, monitoring the screening results and setting up quality control procedures. I also
developed a computer programme to notify participants and their general practitioners of the screening results. With others in the research team, I supervised the coding, entry and verification of the data collected at the screening clinics.
I developed external assessments to provide a more objective measure of the work environment. After a pilot phase, I held briefing sessions in each department to recruit the personnel managers who undertook the external assessments. I then liaised with them as they rated participants' jobs. Finally I checked and edited the external assessments before linking them to other baseline data.
I established the on-going sickness absence follow-up by negotiating with the civil service for the annual supply of computerised sickness absence records. I then linked the
sickness absence records to the baseline data.
As part of the long-term follow-up study, I set up morbidity follow-up by obtaining diagnostic information from general practitioners for all prolonged spells of sickness absence and mortality follow-up by flagging participants at the National Registry for notification of deaths. These data will be analysed in the future.
TABLE OF CONTENTS
Chapter 1
Page
1.1
Introduction...26
1.2
Costs of sickness absence...27
1.3
Trends in sickness absence...27
1.4
Sickness absence as a general measures of health...27
1.5
Measurement of sickness absence...28
1.6
Patterns of sickness absence
1.6.1 Socioeconomic and regional differences in sickness absence
28
1.6.2 Sex differences in sickness absence...30
1.6.3 Ethnic differences in sickness absence...30
1.7
Risk factors for sickness absence
1.7.1
The work environment...31
i)
Job satisfaction...31
ii)
Organisational components of work...31
1.7.2 Social circumstances outside work...32
1.7.3 Health...33
ii)
Alcohol conspon
.
35iii)
Physical activity.
36
1.8
Conclusion...36
Chapter 2
2.1
Methods of measuring the work environment...38
2.2
Occupational classifications of the work environment...40
2.3
The job strain concept...40
2.3.1 Analyses based on individuals...43
2.3.2 Analyses based on occupational classifications ...46
2.4
Conclusion...48
Chapter 3
3.1
Introduction...49
3.2
Study population...49
3.3
Grade classification...50
3.4
Participation rates...52
3.5
Baseline survey...53
3.5.1
Personal characteristics...54
3.5.2
Social circumstances outside work...
553.5.3
Health...56
3.6
Assessment of the work environment.
.
583.6.1 Self-reports of the work environment...
58i)
Control...
59ii)
Variety and skill use...
59iii)
Work pace...
59iv)
Conflicting demands...60
v)
Support at work...60
vi)
Perceived job importance...60
vii)
Job satisfaction...60
3.6.2 External assessments of the work environment...61
1)
The external assessors...61
ii)
Description of jobs...61
iii)
The rating procedure...63
iv)
Agreement between external assessments...63
3.7
Sickness absence follow-up
3.7.1 Sick leave policy in the civil service...65
3.7.2 Sickness absence records...65
3.7.3 Reasons for sickness absence...65
3.7.5 Consent for follow-up and linkage of sickness absence records... 66
3.7.6 Follow-up period...66
3.7.7 Loss to follow-up...67
3.8
The outcome measures...67
3.9
Statistical methods
3.9.1 Poisson regression...67
3.9.2 Overdispersion...68
3.9.3 Missing values...69
3.9.4 Multiple comparisons...69
3.10
Computing...69
3.11
Presentation of results...69
Chapter 4
Personal characteristics
4.1
Sex...72
4.2
Grade of employment...72
4.3
Age...73
4.4
Length of service...73
4.5
Grade of employment on entry into the civil service...73
4.6
Ethnic group...73
4.8
Socioeconomic indicators
4.8.1 Education...
754
.8.2 Housing tenure...75
4.8.3 Car ownership...
754.9
Partners' employment and socioeconomic status...77
4.10
Father's socioeconomic status...77
4.11
Discussion...91
CHAPTER 5 Personal characteristics and sickness absence I. Short spells of sickness absence 5.1
Grade and short spells...94
5.2
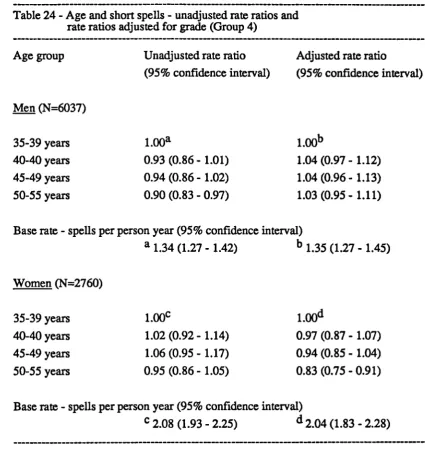
Age and short spells...94
5.3
Ethnic group and short spells...94
5.4
Marital status and short spells...96
5.5
Departmental differences in short spells...96
II. Long spells of sickness absence
5.6
Grade and long spells...96
5.7
Age and long spells...96
5.8
Ethnic group and long spells...96
5.10 Departmental differences in long spe. 98
5.11
Discussion...109
CHAPTER 6
The work environment
6.1
Self-reports of the work environment...110
6.2
External assessments of the work environment...110
6.3
Attitudes towards work...113
6.4
Discussion...125
CHAPTER 7
Social circumstances outside work
7.1
Dependent children...127
7.2
Solo parents...127
7.3
Parents in the household...127
7.4
Social contact with relatives or friends...128
7.5
Attendance at religious services...128
7.6
Emotional and practical support...128
7.7
Adequacy of support...128
7.8
Satisfaction with personal relationships...128
7.10 Discussion
.
142
CHAPTER 8
Health
8.1
Overall health status...144
8.2
Recurring health problems...144
8.3
Longstanding illness...144
8.4
Psychiatric symptoms...145
8.5
Relationship between overall health status and other measures of health. 145
8.6
Discussion...153
CHAPTER 9
Health related-behaviours
9.1
Smoking habits...155
9.2
Alcohol consumption
9.2.1 Frequency of alcohol consumption ...155
9.2.2 Amount of alcohol consumed...157
9.3
Relationship between smoking and alcohol consumption...157
9.4
Physical activity...157
9.5
Relationship between smoking and physical activity...157
CHAPTER 10
The work environment and sickness absence I. Short spells of sickness absence
10.1 Self-reports of the work environment and short spells... 165
10.2 External assessments of the work environment and short spells...167
10.3 Attitudes towards work and short spells...167
10.4 Combined effects of self-reported work pace, control and variety andskill use on short spells...168
II. Long spells of sickness absence 10.5 Self-reports and external assessments of the work environment and longspells...168
10.6 Attitudes towards work and long spells...169
10.7 Discussion...185
CHAPTER 11 Social circumstances outside work and sickness absence I. Short spells of sickness absence 11.1 Dependent children and short spells...187
11.2 Social contact with relatives or friends and short spells...187
11.3 Attendance at religious services and short spells...187
11.4 Emotional and practical support and short spells...187
11.6 Satisfaction with personal relationships and short spells . 188
11.7 Difficulty paying bills and short spells...188
IL Long spells of sickness absence 11.8 Dependent children and long spells...188
11.9 Social contact with relatives or friends and long spells...188
11.10 Attendance at religious services and long spells...188
11.11 Emotional and practical support and long spells...188
11.12 Adequacy of support and long spells...189
11.13 Satisfaction with personal relationships and long spells...189
11.14 Difficulty paying bills and long spells...189
11.15 Discussion...208
CHAPTER 12 Health and sickness absence I. Short spells of sickness absence 12.1 Overall health status and short spells...209
12.2 Recurring health problems and short spells...209
12.3 Longstanding illness and short spells...209
II.
Long spells of sickness absence
12.5
Overall health status and long spells...211
12.6
Recurring health problems and long spells...211
12.7
Longstanding illness and long spells...211
12.8
Psychiatric symptoms and long spells...211
Ill.
Certified reasons for sickness absence...211
12.9
Discussion...222
CHAPTER 13
Health-related behaviours and sickness absence
I.
Short spells of sickness absence
13.1
Smoking habits and short spells...223
13.2
Alcohol consumption and short spells...223
13.3
Physical activity and short spells...223
II.
Long spells of sickness absence
13.4
Smoking habits and long spells...223
13.5
Alcohol consumption and long spells...224
13.6
Physical activity and long spells...224
CHAPTER 14
Grade differences in sickness absence after adjusting for other factors
I.
Short spells of sickness absence...234
II.
Long spells of sickness absence...234
14.1
Discussion...239
CHAPTER 15
Discussion
15.1
Summary of results...240
15.2
Grade and sickness absence...241
15.3 Self-reports and external assessments of the work environment...243
15.4
The job strain concept and sickness absence...244
15.5
Attitudes towards work and sickness absence...245
15.6
Social circumstances outside work and sickness absence...246
15.7
Health and sickness absence...247
15.8
Smoking, alcohol consumption and sickness absence...247
15.9 Sex differences in psychosocial factors and sickness absence...248
15.10 Ethnic differences in sickness absence...248
15.12 Internal validity
15.12.lSelection bias
.
249
15.12.2lnformation bias...250
15.12.3Confounding effects...
25015.13 Implications...
251APPENDIX
1Baselinequestionnaire...
253APPENDIX 2
Missing values of questions used in the analyses
A2.1 Missing values for questions on the work environment...254
A2.2 Missing values for other questions...258
APPENDIX
3
Development of the self-reported work indices
A3.1 Introduction...259
A3.2 Principal component analysis...259
A3.2.1 Selection of the variables...260
A3.2.2 The sample...260
A3.2.3 The correlation matrix...260
A3.2.4 The component loadings...261
A3.2.6 The components
. 266
A3.3 Work indices
A3.3.1 Comparison between a priori groups and components...267
A3.3.2 Calculation of the work indices...267
A3.3.3 Internal consistency...267
A3.4 Computing...268
APPENDIX 4
Externalassessment form...270
APPENDIX
5Crude rates of short and long spells of sickness absence...271
APPENDIX 6
Distributionof spells of sickness absence...294
APPENDIX 7
Correlationbetween work characteristics...296
Page
5051
52 53 5362
63
64
78
78
79
80
81
82
83
84
8586
87
88
89
90
LIST OF TABLES
Table
1.
Distributionof participants, by department...
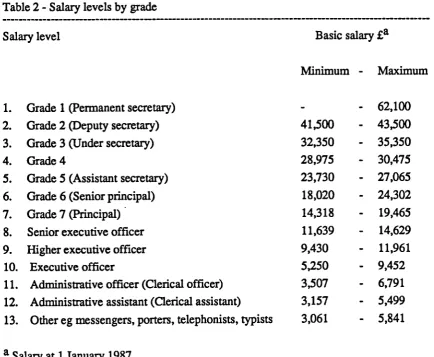
2.
Salarylevels, by grade...
3.
Gradeclassification...
4.
Participation rates by grade in 14 departments...
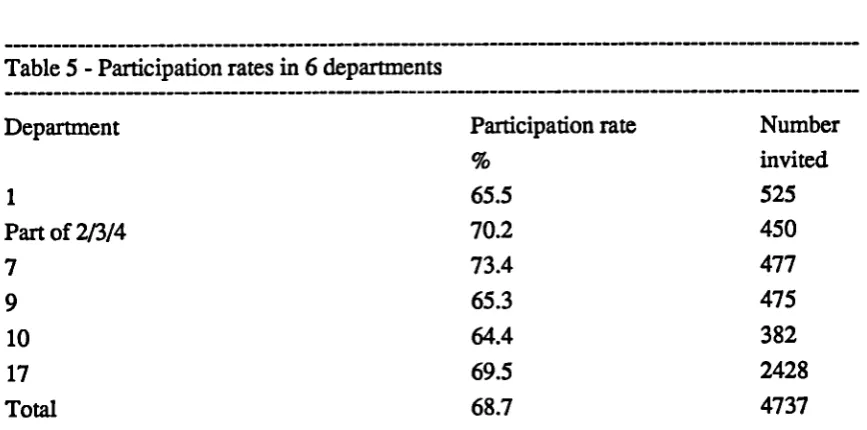
5.
Participation rates by departments in 6 departments...
6.
Number of jobs assessed by personnel managers in each department...
7.
Number of participants in each externally assessed job...
8.
Difference between two external assessments of the same job...
9.
Gradedistribution, by sex...
10.
Age, by grade and sex...
11.
Lengthof service, by grade and sex...
12.
Grade at entry into the civil service, by current grade and sex...
13.
Ethnicgroup, by grade and sex...
14.
Maritalstatus, by grade and sex...
15.
Highest level of full-time education, by grade and sex...
16.
Years of full-time education, by grade and sex...
17.
Years of full-time education, by ethnic group and sex (Groups
5and 6).
18.
Housing tenure, by grade and sex...
19.
Car ownership, by grade and sex...
20.
Partner's employment status, by grade and sex...
21.
Partner's socioeconomic status, by grade and sex...
22.
Father's socioeconomic status, by grade and sex...
23.
Grade and short spells - unadjusted rate ratios and
rateratios adjusted for age...
24
Age and short spells - unadjusted rate ratios and
rateratios adjusted for grade...
25.Ethnic group and short spells - unadjusted rate ratios and
26.
Marital status and short spells - unadjusted rate ratios and
rate ratios adjusted for age and grade...
102
27.
Departmental differences in short spells - rate ratios adjusted for
ageand grade...
103
28.
Grade and long spells - unadjusted rate ratios and
rateratios adjusted for age...
104
29.
Age and long spells - unadjusted rate ratios and
rateratios adjusted for grade...
105
30.
Ethnic group and long spells - unadjusted rate ratios and
rateratios adjusted for age and grade...
106
31.
Marital status and long spells - unadjusted rate ratios and
rateratios adjusted for age and grade...
107
32.
Departmental differences in short spells - rate ratios adjusted for
ageandgrade...
108
33.
Self-reports of control, by grade and sex...114
34.
Self-reports of variety and skill use, by grade and sex...
115
35.
Self-reports of work pace, by grade and sex...
116
36.
Self-reports of conflicting demands, by grade and sex...
117
37.
Self-reports of support at work, by grade and sex...
118
38.
External assessments of control, by grade and sex...
119
39.
External assessments of work pace, by grade and sex...
120
40.
External assessments of conflicting demands, by grade and sex...
121
41.
External assessments of importance of mistakes, by grade and
sex... 122
42.
Perceived job importance, by grade and sex...
123
43.
Job satisfaction, by grade and sex...
124
44.
Dependent children, by grade and sex...
131
45.
Maritalstatus of solo parents...
132
46.
Soloparents, by grade and sex...
132
47.
Parentsin household, by grade and sex...
133
48.
Socialcontact with relatives, by grade and sex...
134
49.
Socialcontact with friends, by grade and sex...
135
50.
Attendance at religious services, by grade and sex...
136
151
152
158
159
160
161
162
163
171
173
175
52.
Amount of practical support, by grade and sex
.
138
53.
Adequacy of support, by grade and sex...
139
54.
Satisfaction with personal relationships, by grade and sex...
140
55.
Difficultypaying bills, by grade and sex...
141
56.
Overallhealth status, by grade and sex...
146
57.
Recurringhealth problems, by grade and sex...
147
58.
Longstandingillness, by grade and sex...
148
59.
Psychiatricsymptoms, by grade and sex...
149
60. Relationship between overall health status and recurring health problems,
bysex...150
61
Relationship between overall health status and longstanding illness,
bysex...
62.
Relationship between overall health status and psychiatric symptoms,
bysex...
63.
Smokinghabits, by grade and sex...
64.
Frequency of alcohol consumption, by grade and sex...
65.
Amountof alcohol consumed, by grade and sex...
66.
Relationship between smoking and frequency of alcohol consumption,
bysex...
67.
Physicalactivity, by grade and sex...
68.
Relationship between smoking and physical activity, by sex...
69.
Self-reports of the work environment and short spells - unadjusted rate
ratiosand rate ratios adjusted for age and grade...
70.
External assessments of the work environment and short spells
-unadjusted rate ratios and rate ratios adjusted for age and grade...
71.
Attitudes towards work and short spells - unadjusted rate ratios and
rateratios adjusted for age and grade...
72.
Combined effects of selfreported control and work pace on short spells
-unadjusted rate ratios and rate ratios adjusted for age and grade...176
73.
Combined effects of self-reported variety/skill use and work pace on
short spells - unadjusted rate ratios and rate ratios adjusted for
ageand grade...178
204
205
206
75. 76. 77.78.
79.80.
81.
82.
83.
84.
85.86.
87.
88.
89.
90.
91.
92.
93.
External assessments of the work environment and long spells
-unadjusted rate ratios and rate ratios adjusted for age and grade...
Attitudes towards work and long spells - unadjusted rate ratios and
rateratios adjusted for age and grade...
Dependent children and short spells - unadjusted rate ratios and
rateratios adjusted for age and grade...
Social contact with relatives and short spells - unadjusted rate ratios and
rateratios adjusted for age and grade...
Social contact with friends and short spells - unadjusted rate ratios and
rateratios adjusted for age and grade...
Attendance at religious services and short spells - unadjusted rate ratios
andrate ratios adjusted for age and grade...
Amount of emotional support and short spells - unadjusted rate ratios and
rateratios adjusted for age and grade...194
Amount of practical support and short spells - unadjusted rate ratios and
rateratios adjusted for age and grade...
Adequacy of support and short spells - unadjusted rate ratios and
rateratios adjusted for age and grade...
Satisfaction with personal relationships and short spells - unadjusted
rate ratios and rate ratios adjusted for age and grade...
Difficulty paying bills and short spells - unadjusted rate ratios and
rateratios adjusted for age and grade...
Dependent children and long spells - unadjusted rate ratios and
rateratios adjusted for age and grade...
Social contact with relatives and long spells - unadjusted rate ratios and
rateratios adjusted for age and grade...
Social contact
withfriends and long spells - unadjusted rate ratios and
rateratios adjusted for age and grade...
Attendance at religious services and long spells - unadjusted rate ratios
andrate ratios adjusted for age and grade...
Amount of emotional support and long spells - unadjusted rate ratios and
rateratios adjusted for age and grade...203
Amount of practical support and long spells - unadjusted rate ratios and
rateratios adjusted for age and grade...
Adequacy of support and long spells - unadjusted rate ratios and
rateratios adjusted for age and grade...
Satisfaction
withpersonal relationships and long spells - unadjusted
rate ratios and rate ratios adjusted for age and grade...
228
229
94.
Difficulty paying bills and long spells - unadjusted rate ratios and
rateratios adjusted for age and grade...
207
95.
Overall health status and short spells - unadjusted rate ratios and
rateratios adjusted for age and grade...
213
96.
Recurring health problems and short spells - unadjusted rate ratios and
rateratios adjusted for age and grade...
214
97.
Longstanding illness and short spells - unadjusted rate ratios and
215
rateratios adjusted for age and grade...
98.
Psychiatric symptoms and short spells - unadjusted rate ratios and
216
rateratios adjusted for age and grade...
99.
Overall health status and long spells - unadjusted rate ratios and
217
rateratios adjusted for age and grade...
100. Recurring health problems and long spells - unadjusted rate ratios and
218
rateratios adjusted for age
andgrade...
101. Longstanding illness and long spells - unadjusted rate ratios and
219
rateratios adjusted for age and grade...
102 Psychiatric symptoms and long spells - unadjusted rate ratios and
220
rateratios adjusted for age and grade...
221
103. Reasonsfor short spells of sickness absence...
221
104. Reasonsfor long spells of sickness absence...
105. Smoking habits and short spells - unadjusted rate ratios and
225
rateratios adjusted for age and grade...
106. Frequency of alcohol consumption and short spells - unadjusted rate ratios
andrate ratios adjusted for age and grade...226
107. Amount of alcohol consumed and short spells - unadjusted rate ratios and
rateratios adjusted for age and grade...227
108. Physical activity and short spells- unadjusted rate ratios and
rateratios adjusted for age and grade...
109. Smoking habits and long spells - unadjusted rate ratios and
rateratios adjusted for age and grade...
110. Frequency of alcohol consumption and long spells - unadjusted rate ratios
andrate ratios adjusted for age and grade...230
111. Amount of alcohol consumed and long spells - unadjusted rate ratios and
rateratios adjusted for age and grade...231
112. Physical activity and long spells- unadjusted rate ratios and
rateratios adjusted for age and grade...232
113. Grade and short spells - age-adjusted rate ratios and rate ratios adjusted
for age, self-reports of the work environment, social circumstances
241 255 258 260 261 262 264 265 268 269 271 271 272 272 272 273 273 273 274 274 114. Grade and short spells - age-adjusted rate ratios and rate ratios adjusted
for age, external assessments of the work environment, social
circumstances outside work, health and health-related behaviours...236 115. Grade and long spells - age-adjusted rate ratios and rate ratios adjusted
for age, self-reports of the work environment, social circumstances
outside work, health and health-related behaviours...237 116. Grade and long spells - age-adjusted rate ratios and rate ratios adjusted
for age, external assessments of the work environment, social
circumstances outside work, health and health-related behaviours...238 117. Grade and the Registrar General's social classes and socioeconomic
groupings... 118. Distribution of responses before and after 'not applicable' (NA)
responsecategory was added... 119. Missing values and inclusion of questions in different versions of the
questionnaires... 120. Proportion of participants with missing values for 40 variables
includedin principal component analysis... 121. Eigenvalues and proportion of total variance explained by first three
principal components before and after orthogonal rotation... 122. Principalcomponent loadings before rotation... 123. Component loadings after orthogonal rotation... 124. Variables making a significant contribution to first three components
137. Self-reports of the work environment and short spells - crude rates... 275
138. External assessments of the work environment and short spells
-cruderates... 276 139. Attitudes towards work and short spells - crude rates... 277 140. Self-reports of the work environment and long spells - crude rates... 278 141. External assessments of the work environment and long spells
LIST OF FIGURES
Figure
Page
1.
The job strain concept...
2.
Relationship between explanatory variables and sickness absence...
3.
Grade distribution, by sex...
42
71
72
Maritalstatus, by grade and sex...74
Yearsof full-time education, by grade and sex...76
Years of full-time education, by ethnic group for men in Groups 5 and 6 76
Grade and short spells, age-adjusted rates by sex...95
Ethnic group and short spells, age-adjusted rates by sex...97
Grade and long spells, age-adjusted rates by sex...95
Ethnic group and long spells, age-adjusted rates by sex...97
Self-reports of variety and skill use, by grade and sex...111
Self-reports of support at work, by grade and sex...111
Self-reports of control, by grade and sex...112
Externalassessments of control, by grade and sex...112
Jobsatisfaction, by grade and sex...113
Socialcontact with relatives, by grade and sex...129
Socialcontact with friends, by grade and sex...129
Satisfaction with personal relationships, by grade and sex...130
Smokinghabits, by grade and sex...156
Amountof alcohol consumed, by grade and sex...156
Self-reports of variety and skill use and short spells,
age- and grade-adjusted rates by sex...166
Self-reports of support at work and short spells,
CHAPTER 1 Sickness absence
1.1 Introduction
This study examines risk factors for sickness absence in the British civil service. Sickness absence is all absence from work attributed to sickness. The risk factors considered include grade of employment, psychosocial aspects of work and social life, health and health-related behaviours. It also examines the extent to which these factors could account for the higher rates of sickness absence in lower grades of employment. A major objective of this study is to assess the importance of psychosocial aspects of the work environment. These include the amount of control employees have over their work, variety, the extent to which skills are used and developed, work pace, conflicting demands and support at work from colleagues and supervisors. Attitudes towards work, such as perceived job importance and job satisfaction, are also examined. Physical aspects of the work environment are not examined.
This study is one component of a large prospective study of psychosocial and other risk factors for cardiovascular disease, the Whitehall II Study. Sickness absence is used as the outcome measure in this study and will be used to identify cardiovascular morbidity in the long term prospective study.
Sickness absence is an important problem for both individuals and organisations. Individuals who are frequently absent are unable to maintain their usual roles at work. This may affect their self-esteem and career prospects. Prolonged sickness absence
probably indicates physical, psychological or social disability. Sickness absence may also cause strain by increasing the workload for other employees. In addition, sickness
absence is a major cause of reduced efficiency in the workplace.
In this chapter the interpretation of sickness absence, its measurement, and earlier studies which have examined the patterns of and risk factors for sickness absence are discussed. In Chapter 2, studies which have examined psychosocial aspects of the work environment in relation to sickness absence and other health outcomes are described.
1.2 Costs of sickness absence
It is difficult to determine the total costs of sickness absence but most estimates are substantial. In Britain, it has been estimated that the total costs of sickness absence are equivalent to the costs of running the National Health Service (8). This includes the direct costs of sickness payments and the indirect costs of payment of additional
employees to cover the work normally done by the absent employee, payment of overtime and lost productivity.
1.3 Trends in sickness absence
Sickness absence has increased in most industrialised countries since the 1950s (9-11). In Britain there was a steep increase in the number of new claims made to the National Insurance Scheme between 1949 and 1964 (9). Alderson extended this analysis showing that there was a steady increase in new claims until 1978 when there was a slight
reduction (12). Changes in the system of claiming benefits since 1980 make it difficult to interpret recent trends. In large organisations such as the Post Office similar trends in the frequency of sickness absence have been observed since the 1950s, but the total duration of sickness absence has remained relatively constant (13). This suggests that there has been an increase in short rather than long periods of sickness absence.
1.4 Sickness absence as a general measure of health
Health is complex, multidimensional and difficult to measure. It can be defined in terms of disease, symptoms, psychological well-being, function and physical fitness (14). Most measures of health are specific to one of these dimensions.
1.5 Measurement of sickness absence
Sickness absence consists of one or more periods of absence which can vary in duration from one day to several months. The term 'spell' is used in this thesis to describe an episode of absence from work lasting one or more days. Certified sickness absence refers to spells which are supported by a certificate from a general practitioner. No single measurement can describe all aspects of sickness absence. Three measurements are frequently used.
1) Frequency of sickness absence measured as the total number of spells per person year.
ii) Total duration of sickness absence measured either as the total number of days per person year or the percentage of working time lost.
iii) Prevalence of sickness absence measured as the proportion of people absent on a particular day. Some studies describe the proportion of people who have at least one spell of sickness absence during a defined period.
Each measurement provides different information. Prevalence gives no information on either the frequency or duration of sickness absence. However it is simple to obtain and can be used to compare groups of employees. Employers often use the percentage of working time lost to plan staffmg levels. Frequency gives more weight to short spells, whereas total duration gives more weight to long spells. A few people who have occasional long spells contribute a disproportionate amount to the total duration. For example, analyses of total duration based on National Insurance figures include a year of absence for people who are permanently sick and, in effect, are not employed. It is important to consider the measurement used when comparing different studies.
1.6 Patterns of sickness absence
A number of studies have described differences in sickness absence by sex, socioeconomic status and ethnic group.
1.6.1 Socioeconomic and regional differences in sickness absence
occupational status are often used interchangeably. In Britain, the Registrar General's social class classification is widely used and allocates occupations to six social classes on the basis of skill and social position (15). However the precise criteria for allocating occupations to different classes are not clear. The Registrar General's socioeconomic groupings is an alternative occupational classification which allocates occupations into 17 groupings on the basis of social and economic status (15).
A number of studies have reported higher rates of sickness absence among employees in less skilled or manual occupations (1-7). In a national sample of insured persons, men in skilled, partly skilled and unskilled occupations (social classes III to V) were twice as likely to have some certified sickness absence as men in professional and intermediate occupations (social classes I and II) (1). Similar differences have been reported within non-manual occupations. In the General Household Survey, employees in intermediate and junior non-manual occupations (socioeconomic groupings 5 and 6) were twice as likely to report sickness absence in the week before the interview as employees in
professional and managerial occupations (socioeconomic groupings 1 to 4 and 13) (2). In a Swedish study of insured persons, similar socioeconomic differences in the frequency and duration of sickness absence were observed for several occupational classifications (3).
Similar socioeconomic differences in sickness absence have been reported within
organisations. In both public and private sectors, clerical staff had two to five times more sickness absence than administrative staff (4-7). These differences were observed for both the frequency and duration of sickness absence.
In the United Kingdom marked regional differences in both frequency and duration of sickness absence have been reported (12,16). Wales, Northern Ireland and the North East had higher rates of sickness absence than the Midlands or the South. Similar regional differences have been reported for mortality (17). Employees on long term sickness benefits would be included in the National Insurance figures. Regional differences in sickness absence therefore partly reflect regional differences in health. There are also marked regional differences in occupations. For example, there is more heavy industry in
1.6.2 Sex differences in sickness absence
A number of studies have reported higher rates of sickness absence among female employees (4-7). However women are more frequently in jobs with lower occupational status than men. This sugggests that it is not possible to interpret sex differences in sickness absence if differences in occupational status are ignored.
Sex differences persist, but are less marked, when men and women in the same
occupations axe compared. Taylor collated the findings from several studies showing sex differences in sickness absence for teachers, clerical and technical staff, nurses and bus conductors (18). In these studies, the female to male ratios for the duration of sickness absence were between 1.2 and 2.0. The female to male ratios were closer to one for single women than for married women. Similar differences between single and married women have been reported for certified and uncertified sickness absence in a study of office employees (6). It is possible that married women, who have often interrupted their careers to have children, have less skilled jobs within an occupation than single women or men.
Sex differences are not necessarily observed in groups with higher occupational status. In the Swedish study discussed above, there were minimal sex differences in the frequency of sickness absence in professional or skilled non-manual occupations, whereas women in less skilled non-manual or manual occupations had more frequent sickness absence than men (3).
1.6.3 Ethnic differences in sickness absence
1.7 Risk factors for sickness absence
Earlier studies of risk factors for sickness absence are discussed in relation to the work environment, social circumstances outside work, health and health-related behaviours. 1.7.1 The work environment
A number of studies have evaluated the importance of the work environment in relation to sickness absence. Only a few studies have assessed psychosocial aspects of the work environment and these studies axe discussed in Chapter 2. Most studies have examined job satisfaction or organisational factors such as working group size and hours of work. These studies are discussed in this section.
i) Job satisfaction
Two approaches have been used to assess the relationship between job satisfaction and sickness absence. The first approach compares levels of job satisfaction between employees with different patterns of sickness absence (21-23). With the exception of female salaried employees in one study (21), all of these studies reported a higher proportion of dissatisfied employees in the groups with frequent sickness absence. The second approach correlates employees' reports of job satisfaction with their rates of sickness absence (24-26). These studies reported few significant associations between job satisfaction and either the frequency or duration of sickness absence.
The studies which used simple measures of job satisfaction provide no information on how job satisfaction relates to specific aspects of work. Other studies have assessed different aspects of job satisfaction including satisfaction with the work, pay, promotions, supervisors and coworkers. These studies have usually shown no association between different aspects of job satisfaction and sickness absence.
ii) Organisational components of work
Several studies have examined the relationship between sickness absence and organisational size, size of working group and hours of work such as shift work and overtime.
absence than those in smaller working groups (21). There were no differences in sickness absence by working group size for salaried employees. This study suggests that working group size may be more important than organisational size. Porter and Steers speculated that large working groups tend to be characterised by less group cohesiveness, higher task specialisation and poorer communications (28).
Most studies suggest that shift workers have less sickness absence than day workers (29,30). In a study which compared 666 shift workers with 717 day workers in an oil refinery, day workers had about twice the rates of sickness absence as shift workers (29). The author suggested that differences in working group size, job satisfaction and social structure may explain the observed differences in sickness absence between shift and day workers. In another study, 965 pairs of shift and day workers from 29 organisations were compared (30). Shift workers generally had lower rates of sickness absence than day workers, although there were unexplained differences between organisations. One explanation for these differences is the selection of shift workers. Workers who are healthier may be more likely to remain on permanent shift work. This is supported by a study of 8,603 male manual workers which reported higher mortality rates among ex-shift workers than either current shift workers or day workers (31).
Few studies have assessed the effects of overtime and sickness absence. In a study of 194 oil refinery workers, overtime hours varied widely among employees with different patterns of sickness absence, although the average overtime worked steadily decreased from the group who were frequently absent to those who were never absent (23).
I am not aware of any studies which have examined the relationship between the length of the working day or week and sickness absence.
1.7.2 Social circumstances outside work
hand, in a small study of 220 female clerical workers, married women were no more likely to have four or more days of sickness absence than single women (32).
In the same study, women with one or more dependents were more likely than those without dependents to have four or more days of sickness absence (32). This comparison is difficult to interpret because it failed to distinguish between dependent adults and children. In a large study of 8,049 employees in different organisations, women with one or more children aged under 15 had an average of 2.9 spells of sickness absence per year compared to 2.1 spells of sickness absence per year for women without children (33). The fmdings were not presented for men. One of the few studies to examine the relationship between dependent children and sickness absence for male employees was the study of 194 refmery workers (23). Men with one dependent (excluding partners and employed children) had an average of 1.5 spells of sickness absence per year compared to 2.7 spells of sickness absence per year for men with no dependents or two or more
dependents.
These studies took no account of the age of dependent children. Findings from the General Household Survey suggest that the age of the youngest child may be important (34). In this survey, women with at least one child under the age of five were more likely to have been absent for personal or other reasons than those with older children (7% compared to 1% for women with older children). For men, no such difference was observed.
Few studies have examined the relationship between other social circumstances outside work and sickness absence. In a study of 139 employees of whom 70% were women, control, variety, task identity, feedback and social interactions at and outside work were related to sickness absence (35). These factors both at and outside work were negatively correlated with the frequency of sickness absence (r=-0.20 and r=-O.26 respectively). However they did not relate to time lost.
1.7.3 Health
A number of cross-sectional studies have reported more frequent sickness absence for younger employees and more prolonged sickness absence for older employees (5,38-41). The latter would be consistent with age differences in morbidity. However several prospective studies have reported no increase in the frequency of sickness absence with age (39,40). The differences between cross-sectional and prospective studies may reflect differences in the populations studied. Long follow-up in a stable population is required to assess age-related changes in sickness absence in a prospective study.
In a cross-sectional study of 400,000 Post Office employees, rates of certified sickness absence, premature retirements for medical reasons and deaths were higher in the lower grades of employment (4). The similar grade differences in certified sickness absence, medical retirements and deaths may indicate a relationship between them. However in this study, prospective information was not available and employees' sickness absence was not related to their risk of medical retirement or death.
Two Swedish studies have examined the relationship between specific medical conditions and sickness absence. In a population study, men with lower back pain had almost twice the frequency and duration of sickness absence as men without lower back pain (42). These differences persisted after adjusting for education and occupational status. In another study, men with dyspepsia had more frequent and more prolonged sickness absence than men in the general population (43). These studies took no account of
occupational status. Although they suggest that low back pain or dyspepsia relate to rates of sickness absence, they provide little information on the importance of these medical conditions relative to other factors.
The study of 194 refinery workers discussed earlier is interesting because it assessed the relationship between more general measures of morbidity and different patterns of
Few studies have assessed the relationship between psychiatric morbidity and sickness absence. In a study of 2,352 employees, men with high scores on the Middlesex Hospital Questionnaire which measures psychoneurotic and personality traits had more frequent certified sickness absence than men with low scores (44). In a more detailed study of 321 executive officers in the British civil service, minor psychiatric morbidity was assessed using the General Health Questionnaire and the Clinical Interview Schedule (45). Both men and women with minor psychiatric morbidity had higher rates of certified and uncertified sickness absence compared to those with no minor psychiatric morbidity.
1.7.4 Health-related behaviours i) Smoking habits
Although a major report on smoking and health concluded that smokers have more sickness absence than non-smokers, this conclusion was based on limited evidence (46). Two small studies have reported slightly more hours of sickness absence per month for smokers compared to non-smokers (47,48). However, these studies did not take account of occupational status. An association between smoking and sickness absence was observed in two studies of 200 student nurses (49,50). Nurses who smoked had an average of 3.5 uncertified spells of sickness absence in a six month period, compared to 2.0 spells for non-smokers. A higher proportion of smokers had at least one certified spell in the six month period. On the other hand, a large study of 1,313 salaried employees and wage workers, reported minimal differences in the duration of sickness absence between smokers and non-smokers (51).
The reasons for an association between smoking and sickness absence are likely to be complex. Respiratory infections are a common cause of sickness absence. In a study of men entering the army, smokers had a higher incidence of upper respiratory tract
infections than non-smokers (52). Smoking may also be associated with other differences in personality, psychological well-being and lifestyle. For example in the two studies of nurses, smokers with psychiatric symptoms had more frequent sickness absence than either non-smokers or smokers without psychiatric symptoms (49,50).
ii) Alcohol consumption
previous three months (54). In a large population screening survey in Sweden, men with liver enzyme levels (gamma glutamyl transferase) above the 90th percentile had an average of 60 days of sickness absence in the previous year, compared to 12 days for those with liver enzyme levels below the median (55). Within a large organisation, 764 problem drinkers detected in a screening programme were compared with 863 controls matched for age, sex, occupational class and location (56). Problem drinkers had an average of 1.3 spells per year and 13.0 days per year of sickness absence compared to 0.7 spells per year and 5.8 days per year for controls. These differences were observed for men and women in different age and occupational groups.
iii) Physical activity
Little information is available on how physical activity relates to sickness absence. In a study of salaried employees and wage workers, the relationship between physical activity during leisure time and sickness absence was assessed (51). Salaried employees who took little physical activity had higher rates of sickness absence. Wage workers, who as a group had more physically active jobs, took less physical activity during their leisure time. For these workers, there was no relationship between physical activity and sickness absence. This suggests that the importance of physical activity during leisure time may relate to other differences in lifestyle, rather than physical fitness.
1.8 Conclusion
There have been numerous studies of sickness absence in different groups of employees. Considered together, these studies suggest that a large number of factors relate to sickness absence. However, most studies have focussed on a limited number of risk factors. Consequently, it is not clear to what extent the associations have been confounded by factors which were not measured and remarkably little is known about the relative importance of different factors.
A consistent fmding in most studies of sickness absence has been the higher rates of sickness absence among employees with lower occupational status. The reasons for these differences are poorly understood. Possible explanations include differences in health, lifestyle and psychosocial factors at work and outside work.
A limitation of many studies is the use of a single measurement of sickness absence. Different measurements describe different aspects of sickness absence. Frequency tends to represent short spells of sickness absence, whereas total duration and time lost tends to represent long spells of sickness absence. The risk factors for short and long spells of sickness absence may be different.
Most studies have examined sickness absence in less skilled, non-manual or manual occupations. These findings cannot necessarily be extended to other occupational groups. Relatively little is known about sickness absence in more skilled, non-manual
CHAPTER 2
The work environment
A number of studies have examined the relationship between psychosocial factors at work and health. These studies have defined the work environment in different ways, from global measures of employees' responses to their work to specific measures of
psychosocial aspects of the work environment. In addition, these studies have assessed a number of outcomes, including job satisfaction, sickness absence, anxiety and depression, hospitalisations and coronary heart disease.
There is a large literature on occupational stress and health. In this chapter studies which are directly relevant to the concepts and measurements of the work environment used in the present study are discussed.
2.1 Methods of measuring the work environment
Two general methods have been used to measure the work environment, namely employees' reports and assessments by other individuals.
The most widely used method is to ask employees to describe their work, so cafled self-reports. This method is simple and relatively easy to obtain. Employees are likely to have a good knowledge of their work and may also be in the best position to report on certain aspects of the work environment, for example adequacy of support from colleagues and supervisors.
However, self-reports reflect employees' perceptions of the work environment, as well as the work itself. Employees' perceptions are influenced by personality, past experience and expectations. Consequently, different employees may report on the same work environment in different ways. When self-reports of the work environment are related to self-reported outcomes, such as psychological well-being, it is difficult to separate the effect of the work environment from individual differences in perception and reporting. There may also be systematic reporting differences between the groups being compared. For example, retrospective studies which compared self-reports of the work environment for myocardial infarction survivors and healthy controls may have been biased by
An alternative method is to ask individuals who are not in the jobs, for example
supervisors, colleagues or trained observers, to assess the work environment, so called external assessments. This method also depends on the observer's perception of the work environment, and is therefore only 'objective' in the sense that it is external to the
employees studied. Using this method, a more valid assessment of the effect of the work environment on self-reported outcomes can be made.
However, the practical problems of obtaining external assessments in large studies are considerable. Supervisors may have limited contact with the activities and experiences of individuals in specific jobs. It may therefore be difficult to identify individuals with sufficient knowledge of the jobs to make the assessments. Alternatively, a trained observer could make direct assessments of the work environment. However it is difficult to assess jobs which vary greatly from day to day and the presence of an observer may influence the usual work activities. This method is therefore time-consuming and expensive.
A number of studies have compared self-reports with external assessments by supervisors, colleagues or researchers. In a study of 208 employees in 13 jobs, the average of self-reports for each job was correlated with the external assessments by supervisors and the researchers (25). The two methods were moderately to highly correlated for variety, control and task identity (r=0.65 to r=0.94), but were not correlated for feedback (r=-0.22 to r=0.09). Other studies have also reported moderate agreement between self-reports and external assessments by supervisors and colleagues (59-62). However, in a study of 841 manual workers, there was a poor correlation between self-reports and direct assessments of psychological stressors for individual employees (r=0.37) (63). In contrast to the other studies, the latter study correlated the two methods for individual employees rather than for jobs.
2.2 Occupational classifications of the work environment
An alternative to analysing the work environment of individual employees, is to classify occupations according to the average of employees' reports within an occupation. This approach minimises the effect of reporting differences between employees. It has been widely used to re-analyse data from studies in which health outcomes have been
measured, but the work environment has not been measured. Large national surveys of work are used to obtain employees' reports of the work environment in different
occupations. Each occupation is given a score for job strain, as defmed below, which is the average of employees' reports in the occupation. This score can be adjusted for age and other variables which may be associated with differences in the work environment within an occupation. These scores are then linked to individuals in other studies using occupational codes. Consequently, all individuals in the same occupation have the same score.
This approach assumes that the variation in the work environment between occupations is more important than the variation within an occupation. It is therefore a relatively crude measure of the work environment. Certain aspects of the work environment may differ more between occupations than others. For example, in a national survey, 45% of the total variation in control, variety and skill use was observed between occupations, whereas this accounted for only 7% of the total variation in job demands (65).
Simpler occupational classifications are based on external criteria, rather than self-reports. For example, within an organisation it may be possible to compare occupations with high and low levels of control (66). This approach can only be used where the differences between occupations are quite clear and these differences often relate to other differences, such socioeconomic status.
2.3 The job strain concept
Most studies of coronary heart disease have examined the importance of job demands, such as excessive work pressures, role conflicts and changes in responsibilities
(57,67,68). In contrast, most studies of job satisfaction, work performance and sickness
The job strain concept relates different aspects of the work environment to psychological strain and ill-health. The concept suggests that the combination of job demands and variety, skill use and control is important. Job demands refer to the speed and intensity of work, pressures to meet deadlines and conflicting demands to do tasks which may be difficult to combine. Control or decision authority refers to the extent to which
employees are able to influence how their work is done. It does not imply control over or responsibilities for other employees. Skill use or intellectual discretion refers to the level of skill required and the extent to which skills are developed. Jobs with high levels of decision authority usually also have high levels of intellectual discretion. Decision authority and intellectual discretion are therefore often combined into a single measure called decision latitude.
According to the job strain concept, jobs with high demands and low decision latitude are associated with above average strain, fatigue, anxiety, depression and in the long term physical illness ('high strain jobs'). In contrast, jobs with high demands and a great deal of decision latitude are associated with average strain, high levels of job satisfaction and high productivity ('active jobs'). Jobs with few demands and high decision latitude are associated with below average strain ('low strain jobs'), whereas jobs with few demands but low decision latitude are associated with average strain, apathy and low productivity ('passive jobs'). Figure 1 summarises the job strain concept.
Most studies which have evaluated the job strain concept have been exploratory analyses of data collected for other purposes. Consequently, they have been limited by the quality of the information available. Two approaches have been used. First, data from national surveys have been re-analysed to relate self-reports of the work environment to symptoms suggestive of depression or cardiovascular disease. Second, data from large studies with health outcomes have been re-analysed by linking individuals to an occupational
Low
Control or variety and skill use
High
train FIgure 1 -The job strain concept
Job demands
2.3.1 Analyses based on individuals
The job strain concept was first assessed in relation to symptoms of exhaustion and depression, job satisfaction and self-reported sickness absence (70). The analyses were based on two samples -911 men aged between 20 and 65 from the 1972 Quality of Employment Survey (QES) in the United States, a national household sample with a response rate of 76%, and 1,896 men aged between 18 and 66 in the 1968 and 1974 Swedish Surveys of Living Conditions (ULF), which used random samples of the adult population and had response rates above 85%.
There was a stepwise increase in the proportion of men who reported exhaustion from 5% in 'low strain jobs' to 34% in 'high strain jobs' in the QES and from 19% to 53% in the ULF. There was a similar increase in the proportion of men who reported depression from 8% in 'low strain jobs' to 47% in 'high strain jobs' in the QES and 8% to 35% in the IJLF. There was a smaller increase in the proportion of men who reported exhaustion from 'passive' to 'active jobs' in both the QES and ULF. However, there were no
differences in the proportion of men who reported depression in 'passive' or 'active jobs'. In this study, job satisfaction and sickness absence related to decision latitude, but there was little to support for a combined effect of job demands and decision latitude. In the QES, men who reported low decision latitude, irrespective of job demands, were more likely to be dissatisfied with their work. In the ULF, men who reported high decision latitude, irrespective of job demands, were less likely to report five or more days of sickness absence per year.
To summarise, in this study there was a relationship between job strain and the prevalence of exhaustion and depression. However decision latitude alone appeared to be more important than job strain for job satisfaction and sickness absence.
Other studies have focussed on the relationship between job strain and cardiovasular disease. Using a similar approach to the study described above, data for 1,641 employed men from the 1974 Swedish Survey of Living Conditions were analysed (71). Based on the available data, a coronary heart disease (CHD) indicator was developed which combined 'cardiovascular' symptoms (ache in breast, trouble breathing), hypertension and heart weakness. Although this CHD indicator is clearly quite different from the usual clinical or epidemiological measures of coronary heart disease, it did predict subsequent CHD mortality. Men in 'high strain jobs' were more likely to have the CHD indicator than other men (18.5% compared to 5.9% overall). However there was no difference in
These findings were supported by an analysis of a larger sample of 13,779 men and women from the 1976 and 1977 Swedish Surveys of Living Conditions (72). In this study, a higher proportion of employees in 'high strain jobs' reported cardiovascular illnesses than those in 'low strain jobs' (7.5% compared to 4.0%). Again, there was no difference in the proportion of men who reported cardiovascular illnesses in 'passive' or 'active jobs'.
This study is particularly interesting because it was large enough to compare the findings for men and women in white-collar and blue-collar occupations (72). The relationship between job strain and the prevalence of cardiovascular illnesses only applied to male blue-collar workers and was not observed in other groups. This raises uncertainty about the extent to which the job strain concept can be applied to different occupational groups. Another interesting aspect of this study was the hypothesis that lack of social support at work combines with job strain to further increase the prevalence of coronary heart disease (72,73). Overall, the age-adjusted prevalence ratios for coronary heart disease increased as the level of social support decreased. Within each level of social support, 'high strain jobs' were associated with a higher prevalence of coronary heart disease than 'low strain jobs'. The differences persisted after adjusting for age, occupational class, disposable income, smoking and a number of social factors including social support out of worlc In contrast to the demand-control combination, the demand-support combination related to prevalence of coronary heart disease in both white-collar and blue-collar occupations. These analyses were cross-sectional soit is not possible to make causal inferences about the associations. Two further analyses (prospective and case-control) were therefore performed using the 1968 and 1974 Swedish Surveys of Living Conditions (71).
The relationship between job strain in 1968 and the development of the CHD indicator in 1974 was examined in a cohort of men who were asymptomatic in 1968. The findings suggested that men in 'high strain jobs' were no more likely to develop the CHD indicator than men in other jobs (5.0% compared to 5.6% overall). There was also no difference in the proportion of men who developed the CHD indicator in 'passive' or 'active jobs'. It is not clear how the development of the CHD indicator related to documented coronary heart disease.