ISSN 2286-4822
www.euacademic.org DRJI Value: 5.9 (B+)
Quality Evaluation of Dehydrated (Sun and Solar
Drying) Cabbage and Rehydration Properties
TANMOY BASAK Manager (Production) Banga Bakers Ltd., Pran-Rfl Group, Bangladesh Bangladesh Agricultural University Mymensingh, Bangladesh ZAIXIANG LOU MD. RAMIM TANVER RAHMAN1
MD. SHOFIUL AZAM State Key Laboratory of Food Science and Technology
School of Food Science and Technology Jiangnan University, Wuxi P.R. China
Abstract:
the panelists using 1-9 hedonic scale. Double layer low-density polythene bag products were ranked as “like very much”. In Solar and Sun drying there is no temperature control in the system. So, the effect of temperature on the rate of drying cannot be determined.
Key words: Cabbage, sun drying, solar drying, rehydration
INTRODUCTION
slighter environmental pollution than other drying equipments (Li Jin Goh et al., 2011; Ronak et al., 2010). Rehydration is a complex process aimed at the restoration of raw material properties when dried material is contacted with water. Pre-drying treatments, subsequent drying and rehydration process induce many changes in structure and composition of plant tissue (Lewicki, 1998), which result in impaired reconstitution properties. Hence, rehydration can be considered as a measure of the injuries to the material caused by drying and treatments preceding dehydration. There are a large number of research reports in which authors measure the ability of dry material to rehydrate. However, there is no consistency in procedures used, nor in nomenclature. The ratio between the dry material mass and water mass varies from 1:5 to 1:50, temperature of rehydrating water is from room temperature to boiling. Time of rehydration varies from 2 min. to 24 h. Rehydrating water is either still or occasionally stirred. Rehydrated material is either blotted with tissue paper, filtered off on filter paper with a slight vacuum or drained on a sieve. In no case is the initial water content of the dry material taken into account. The objective of this study was to analyze the proximate composition of fresh (edible) & dehydrated cabbage, to study the rehydration of dehydrated cabbage, to study the storage stability & sensory attributes of dehydrated cabbage, to assess the microbial load in the dehydrated cabbage.
Materials and Methods
Materials
The cabbages were collected from local market. The trays and other chemicals required for processing and packaging of products were used from the laboratory stock.
Cabbage selection, sorting, washing, blanching. Processing sample by solar & sun drying. Packaging.
Chemical analysis.
Rehydration behavior studies. Development of product. Sensory evaluation Storage studies
Microbial effect on dehydrated cabbage.
Cabbage selection
Sound, mature and fresh cabbages were selected. Sorting
The breakage and off colored selected cabbages were picked out from raw selected vegetables.
Washing
The well-graded selected cabbages were washed thoroughly using clean and safe water to remove foreign matter and dust. Blanching
Cabbages were first washed, drained, sorted, trimmed & cut as for cooking fresh.
One gallon of water was used per pound of prepared cabbages.
Cabbages were put into blancher (wire basket, coarse mesh bag or perforated metal strainer) and lowered into boiling water for 3 min at 85-90oc.
A lid was placed on the blancher and started counting blanching time immediately.
Cooled immediately in cold water for the same time used in blanching. Stirred cabbage slices several times during cooling.
Cabbage slices were drained thoroughly.
Solar drying and Sun drying
temperature on the rate of drying cannot be determined. Fresh cabbage slices thickness of single layer, were placed in trays and drying commenced in the solar dryer and Sun dryer.
Packaging
To assess the effects of packaging the following packaging materials were used to package the dried cabbage slices.
1. Single layer low-density polyethylene (SLLDP). 2. Double layer low-density polythene (DLLDP). 3. High density polythene (HDP) and
4. Low quality market polythene (LQMP).
Each pack contained 250 gm dried cabbage slices, sealed and stored at room temperature (25- 300C).
Proximate Composition and Statistical Analysis
The raw and dried samples were analyzed for their moisture, ash, fat, protein and Vitamin-C contents. Experiments were performed in triplicate and the results were expressed as mean ± SD. The statistical analysis was carried out by using SPSS 17.0, and Microsoft Excel 2007. A value of P < 0 .05 was considered to indicate statistical significance
Moisture
Moisture content was determined adopting AOAC (1984) method.
Ash
AOAC method 14.006 (1984) was used to determine the total ash content.
Fat
AOAC method 7.045 (1984) was used to determine crude fat content of the samples
Protein
Vitamin-C
Vitamin-C content of fresh and dried cabbage were determined using the method of Ranganna (1992).
Rehydration ratio
The rehydration properties were determined by immersion in distilled water (Planinic et al. 2005). About 5gm dried sample were weighed and placed in a glass with 400ml distilled water at normal temperature, 50oc and 60oc. After 15min, the sample was removed from bath; the surplus water was removed with tissue paper and then weighted. This process was repeated after 30, 60, 120 & 240min. Lewicki (1998) proposes to calculate the ratio of rehydration from the following equation:
Rehydration ratio = mass of rehydrated sample / mass of dried sample
Preparation of fried vegetable (dehydrated cabbage)
Table 1 : Recipe for Preparation of fried vegetable (dehydrated cabbage)
Ingredient Amount
Dehydrated cabbage 50 gm
Salt, turmeric Approximately
Onion (pest) 10 gm
Garlic (pest) 3 gm
Ginger (pest) 3 gm
Green chilli 2 no.
Cumin 2 gm
Flow sheet:
25 gm dried cabbage sample was taken ↓
Rehydrated this sample in 60oc water temperature for 45 min ↓
Putting soybean oil in a pan and placing on fire ↓
Cooking with a little water to make highly soft ↓
Adding salt, onions, turmeric, garlic, ginger and green chili at a desired amount
↓
Mixing properly ↓
Sometime later add cumin for increasing the flavor ↓
Cooking until a desirable color, flavor & texture is not produced ↓
When desirable color, flavor & texture is obtained, put off the pan from fire
↓
Cooling & serve for eating
Sensory Evaluation
Storage Studies
Shelf life of the processed of dried Cabbage slices packaged in single layer low-density polyethylene, double layer low-density polythene, high-density polythene & low quality market polythene, was assessed at room temperature (25-30 0C). Each pack contained 250 gm dried Cabbage slices. Total storage time was 3 months. The different parameters used for assessing the quality of products were colour, flavour, texture & moisture content. The observations were made initially at an interval of 30 days up to 90 days. The vegetables with treatment are as follows:
Sample 510 → solar dried non blanching sample → packed in SLLDP Sample 511 → solar dried blanching sample → packed in DLLDP Sample 512 → sun dried non blanching sample → packed in HDP Sample 513 → sun dried blanching sample → packed in LQMP
Microbiological Study
Counting of yeast and mould
Yeast and mould count of different dehydrated cabbage samples were also determined according to the “Recommended method for the Microbiological Examination of Food”, Published by American Public Health association (APHA, 1967).
Preparation of media:
Table 2: Preparation of PDA media
Ingredients Amounts
Infusion from 200 gm potato Dextrose, Commercial Agar,
Shredded Tartaric Acid, U.S.P., 10% solution sterilized.
1000 ml 20 gm 15 gm 2.5 ml/100ml
Two hundred g of previously peeled and sliced potato was taken in 1000ml of distilled water and boiled for an hour. After boiling, straining was done through double thickness of a clean cloth. Then 20 g of commercial dextrose and 15g of agar were added to the potato infusion solution. Later, for complete dissolution the mixture was heated and dispensed into several 200 ml screw cap bottles and sterilized at 121 0C (6.795 kg pressure /sq. inch) for 20 minutes. The media was then stored at refrigeration temperature. Before pouring into petridishes the media was melted through boiling and around 2.5 ml of 10% tartaric acid was added per 100 ml of media (at 450C) to reduce the pH value to 3.5 ± 0.1.
Preparation of dilution blanks:
Making of dilution and procedures of plating:
Making of dilution and procedures of plating for counting yeast and mould was done per making of dilution and procedures of plating for counting bacteria except for the media Potato Dextrose Agar.
Incubation for colony counting:
After solidification of agar, the plates were inverted and incubated at 250C for 5 days. After incubation, the plates were taken out from the incubator and colonies were counted. Finally, the colony number was multiplied by the dilution and the count per gram of sample was recorded.
Results and Discussion
Proximate Composition of Fresh Cabbage Leaf
The fresh cabbage leaves were analyzed for moisture, protein, fat, ash and vitamin-C content and results are given in Table 3.
Table 3 : Composition of fresh cabbage leaf
Parameter Composition (wb)
Moisture contents (%) 91.2
Protein (%) 1.77
Fat (%) 0.1
Ash (%) 0.6
Vitamin C (mg/ 100g) 46.3
Moisture
Ash
The ash content of fresh cabbage leaf was 0.6% (Table 3), which is higher than those found Ali (1992) who reported 0.5%. The value is lower than those found Ferdous (2004), Afroza (2003) who reported 0.8, 1.0% respectively.
Fat
The fat content of fresh cabbage leaf was 0.1% (Table 3), which is significantly lower than those mentioned by Ferdous (2004), Afroza (2003), Anonymus (1997) who reported 0.2, 0.7 and 0.2% respectively. The value was similar with Swaminathan et al. (1972) & Bose (1985), who reported 0.1%.
Protein
The protein content of fresh cabbage was 1.77% (Table 3). This value is nearly consistent with Ferdous (2004), Swaminathan et al. (1972), Bose (1985), Anonymus (1997) who reported 1.8, 1.8, 1.8 & 1.4% respectively and significantly lower than those mentioned by Afroza (2003) who reported 2.5%.
Vitamine C
The vitamine C content of fresh cabbage was 46.3(mg/100gm) (Table 3), which is significantly higher than those mentioned by Ferdous (2004), who reported 37.7(mg/100mg) & lower than Mazumder (2006), who reported 50.82(mg/100mg).
Proximate Composition of dried Cabbage slices
The dried cabbage samples were analyzed for moisture, protein, fat, ash and vitamin-C content and results are given in Table 4.
Table 4 : Composition of dried Cabbage samples
Parameter Sample 510
(wb)
Sample 511 (wb)
Sample 512 (wb)
Sample 513 (wb)
Moisture contents (%)
8.33 8.84 8.42 8.95
Fat (%) 3.44 2.33 3.2 2.1
Ash (%) 9.43 8.77 8.6 8.1
Vitamin C
(mg/100g)
15 0.45 13 0.34
Sample 510 → solar dried non blanching sample → packed in SLLDP Sample 511 → solar dried blanching sample → packed in DLLDP Sample 512 → sun dried non blanching sample → packed in HDP Sample 513 → sun dried blanching sample → packed in LQMP
The compositions of solar & sun dried cabbage samples are shown in Table 4. During drying most of the water in the samples are vaporized so the moisture content is so less and consequently solid content increased. This increased solid content results the increased protein & ash content. The fat content is also increased in the dried sample which represents no oxidation of fat during drying (Kamruzzaman, 2005). But the vitamin-C content is very low in blanched sample due to heat.
Rehydration
Fig. 1 : Rehydration curves-for different samples at normal water temperature.
Fig. 2 : Rehydration curves- for different samples at 500c water temperature.
Fig. 3: Rehydration curves-for different samples at 600c water temperature.
One of the most important characteristics of a dried product is the rehydration ratio. The results for rehydration ratio are shown in Fig 1, 2, & 3. The dehydrated cabbage samples, which were rehydrated at normal, 500c & 600c water temperature. As seen in Fig. 1, 2, & 3 rehydration ratio was increased with the increase of rehydration time, being faster during the initial period of the first 150 min., and slower afterward. In Fig 1, 2, & 3. rehydration ratio is higher at normal water temperature than 500c & 600c water temperature. Similar findings were reported by Mazza and Lemaguer (1980) for onion,
Kaymak-50oC water temperature
Ertekin(2002) for green and red peppers & Planinic et. al. (2005) for carrot.
Storage Studies
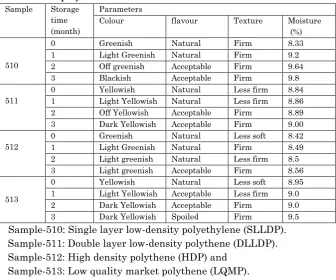
Table 5: Effect of storage on the quality of the dried cabbage packed in different polythene materials.
Sample Storage time (month)
Parameters
Colour flavour Texture Moisture
(%)
510
0 Greenish Natural Firm 8.33
1 Light Greenish Natural Firm 9.2
2 Off greenish Acceptable Firm 9.64
3 Blackish Acceptable Firm 9.8
511
0 Yellowish Natural Less firm 8.84
1 Light Yellowish Natural Less firm 8.86
2 Off Yellowish Acceptable Firm 8.89
3 Dark Yellowish Acceptable Firm 9.00
512
0 Greenish Natural Less soft 8.42
1 Light Greenish Natural Firm 8.49
2 Light greenish Natural Less firm 8.5
3 Light greenish Acceptable Firm 8.56
513
0 Yellowish Natural Less soft 8.95
1 Light Yellowish Acceptable Less firm 9.0
2 Dark Yellowish Acceptable Firm 9.0
3 Dark Yellowish Spoiled Firm 9.5
Sample-510: Single layer low-density polyethylene (SLLDP). Sample-511: Double layer low-density polythene (DLLDP). Sample-512: High density polythene (HDP) and
Sample-513: Low quality market polythene (LQMP).
510 & 513 stored in single layer low density polythene & low quality market polythene respectively, may not be stored for more than 3 months due to higher moisture uptake and sample-511 & 512 are fine during storage period due to lower moisture uptake. Sample-511 packed in double layer low quality polythene was the best product with respect to colour, flavour and texture through out this storage period of 3 months with the test amount of moisture gain or uptake of moisture of any packaged food sample is due to permeability of packaging material, hygroscopicity of food product, temperature etc.
Sensory Evaluation of Dehydrated Cabbage
The single layer solar & sun dried cabbage samples were subjected to sensory evaluation in order to assess degree of acceptability in terms of colour, flavour, texture and overall acceptability. The results are presented in Table 6. A two way analysis of variance (ANOVA) (Appendix-II) was carried out and the results showed that there was significant (p <0.05) differences in colour acceptance among four types of dried cabbage samples as the calculated F-value (8.7892) was greater than the tabulated F-value (2.96).The result showed Table 6. that the colour of sample-511 was the most preferred securing 8.4 out of 9 points and ranked as “like very much”. The colour of sample-512 securing the second highest score of 8.1 out of 9 points and the colour of sample-510 securing the third highest score of 7.9 out of 9 & ranked as “like moderately”. While Sample-513 is comparatively less acceptable securing the lowest score (6.7), though this sample was ranked as “like slightly”.
Table 6. Mean score for colour, flavour, texture and overall acceptability of dehydrated cabbage product.
Samples Sensory attributes
510 7.9a 7.3bc 7.3ab 7.7ab
511 8.4a 8.2a 8.0a 8.4a
512 8.1a 7.8ab 7.6a 8.0a
513 6.7b 6.5c 6.8b 7.1b
LSD(P<0.05) 0.7295 0.8360 0.7505 0.7494
Sample 510 → Single layer low-density polyethylene (SLLDP). Sample 511 → Double layer low-density polythene (DLLDP). Sample 512 → High-density polythene (HDP).
Sample 513 → Low quality market polythene (LQMP).
In case of flavor a two-way analysis of variance (ANOVA) (Appendix II) was carried out and the results showed that there were significant differences in flavor acceptance among the products as the calculated F value (6.4687) was greater than the tabulated F value (2.96). As shown in Table 6. sample-511 was the most acceptable in flavor preference among the samples securing the highest score (8.2) and ranked as “like very much”. This was followed by sample-510, sample-512 and Sample-513 securing 7.3, 7.8 and 6.50 respectively and was equally acceptable and the samples could be ranked as “like moderately”. In case of texture of products there were significant differences among the samples at 5% level of significance (Appendix-II) as calculated F (3.8216) value was higher than tabulated value of F (2.96). As shown in Table 4.4 Sample-511 was the most acceptable in texture preference among the samples securing the highest score (8.0) and ranked as “like very much”. Sample-512 securing the second highest score of 7.6 out of 9 points could be ranked as “like moderately”. While Sample-513 is secured the lowest score (6.68) with a ranking of “like slightly”.
511 is securing the highest score (8.4) could be ranked as “like very much”. Sample-512 secured the second highest score of 8.0, while Sample-510 is secured 7.7& Sample-513 is secured the lowest score (7.1) with a ranking of “like slightly”.
From the above, it is clearly seen that from all considerations, dried cabbage leaves packed in double layer low density polythene and subsequently stored in high density polythene was the most acceptable product with a ranking of “like very much”. It was closely followed by the product packed in single layer low density polythene which secured a “like moderately” ranking. Product packed in a low quality market polythene however, could be ranked as “like slightly”. It may be mentioned here that the products where stored for 3 months at room temperature.
Microbiological Study
Table 7 : Total count of mould of dried cabbage samples at room temperature after 90 days of storage
Sample No. of Colony No. of total Total count (Log. cfu/ ml)
510 2 2×10 1.34
511 0 0×10 1.00
512 1 1×10 0.00
513 3 3×10 1.49
So it had been shown that dried cabbage samples stored in double layer low-density polythene at room temperature (RMT) was susceptible for mould growth after 90 days of storage.
The result of microbiological status of this study corresponds to the study of Rangana and Bajaj (1966). They reported that SO2 is widely used in the preservation of plant origin food like fruit juices, pulps, partially beverages and concentrates etc. This result is also partially in agreement with the findings on Desrosier (1963). He reported that microorganisms could be killed by lifting and irradiation.
The numbers of colony formed in petridishes were shown in figures.
Fig.5 : Colony formed in petridish of sample-512 (1st dilution)
Fig.6 : Colony formed in petridish of sample-513 (1st dilution)
Summary and Conclusion
This research work was carried out to explore the commercial processing of dehydrated cabbages from locally available fresh cabbage. The fresh cabbages were collected from the local market and were analyzed for proximate composition. Dried cabbage samples were stored in four types of polyethylene bag at room temperature (25-300C).
sample contained 8.95 % moisture, 16.3 % protein, 2.1 % fat, 8.1% ash and 0.34% vitamin-C respectively. The studies on the effect of packaging materials during storage showed that moisture content of samples packaged in double layer low density polythene was the lowest and those packaged in low quality market polythene gave the highest moisture content during storage period. Among the packaging systems, double layer low density polythene was the most effective. The colour and flavour of the fresh cabbage leaf were retained in the dried leaf to a remarkable degree when packaged in double layer low density polythene. The reconstitution property in water was excellent for dried leaf.
Four types of dried cabbage leaf product were prepared from fresh cabbage leaf and tested organoleptically by a panel of 10 judges. . Results of test panel showed that sample-511 secured the highest score (8.4) out of 9.0 on the basis of overall acceptability among the samples and was ranked as “like very much”. On the other hand sample-512 secured the second highest score (8.0) ranking of “like very much”. And Sample-510 secured 7.7, ranking of “like moderately”. But sample-513 is not acceptable after 4 month of storage. From the results it is concluded that with Sample-511 was the most preferred product with respect to all the quality attributes. These indicated that dried leaf product is more suitable than fresh leaf.
The study indicates that there is a good prospect of dried cabbages for production of diversified and value added leaf products. Through processing the market value of dried cabbage product may be increased and production can be maximized. Thus farmers would be benefited and encouraged to expand production. Dried cabbage product can be successfully and economically preserved by drying processes.
produce at a very low price. But if farmer can preserve their produce by effective and economic way, they will be able to get proper price and get encouraged to maximize production. Solar and Sun drying systems may be used for large scale in our country and commercial used as foreign country, respectively. Dehydrated and processed products can be sold at high price in off-season in both local and foreign market and the country may earn much needed foreign exchange for industrial and economical development. Furthermore, since farmer would get proper price for their produce, productivity would be increased and sustained. Further research should be carried out for developing ways and means to improve rehydration quality of the dehydrated products.
Acknowledgments
The authors thank Department of Food Technology & Rural Industries, Bangladesh Agricultural University, Mymensingh, Bangladesh and School of Food Science & Technology, Jiangnan University, Wuxi, P.R. China for financial and technical assistance.
REFERENCES
Afroza, S. 2003. Study on the preparation of pickles and chutneys from mixed vegetable. MS Thesis, Dept. of food Technology and Rural Industries, BAU, Mymensingh, pp 58.
Ali, S.M.K 1992. Desio Khaddu Drobber postimane, published by nutrition & food science institute, DU, pp 7, 42. APHA, American Public Health Association. 1967.
AOAC Methods. 1984. Official Method of Analysis 12th edition. Association of Official Agricultural Chemistry, Washington, DC, USA
Bose, T.K. 1985. Fruits of India: Tropical and Subtropical. Nayaprakash, 206 Bidhan Sarani, Calcutate-700000, India. pp. 250
Desrosier, N.W. 1963. The Technology of Food Preservation, Revised Edn. The AVI Publishing Co., Inc., U.S.A. 40-279.
Ferdous, R. 2004. MS Thesis, Dept. of food Technology and Rural Industries, BAU, Mymensingh, Bangladesh
Kamruzzaman, M. 2005. Development of dehydrated arroids
(Colocasiaesculenta) and indirect solar dryer. MS thesis.
Department of Food Technology and Rural Industries. Bangladesh Agricultural University, Mymensigh, Bangladesh. p. 45-46.
Kaymak-Ertekin, F. 2002. Drying and rehydration kinetics of green and red peppers. J. Food. Sci. 67, 168-175.
Lewicki, P. P., Witrowa-Rojchert, D. and Nowak, D. 1998. Effect of pretreatment on kinetics of convection drying of onion. Drying Technology. Poland. 121(1&2): 83-100.
Li Jin Goh, Mohd Yusof Othman, Sohif Mat, Hafidz Ruslan,Kamaruzzaman Sopian, 2011. Review of heat pump systems for drying application. Renew. Sustain. Energy Rev. 15,4788–4796.
Mazumder, A. R. 2006. Effect of refrigeration and freezing on quality of different selected vegetables. A project report, Dept. of food Technology and Rural Industries, BAU, Mymensingh, pp 17.
Mazza, G. & LeMaguer, M. 1980. Dehydration of onions. Some theoretical and practical considerations. Journal of Food Technology,
Rangana, S. and Bajaj, K. 1966. Hand Book of Analysis of quality control for fruit and vegetable products. 2nd. Ed. Tata Me Grow-Hill Co. Ltd., New Delhi.
Ranganna, S. 1992. Hand book of analysis of quality control for fruit and vegetable products. 2nd Ed. TATA McGraw- Hill Pub. Co. Ltd. New Delhi, India.
Ronak, Daghigh, Mohd Hafidz Ruslan, Mohamad Yusof Sulaiman,Kamaruz zaman Sopian, 2010. Review of solar assisted heat pump drying systems for agricultural and marine products. Renew. Sustain. Energy Rev. 14, 2564–2579.
SAS. 1985. SAS user's guide: Statistics, 5th ed.Cary, N.C.: SAS Institute, Inc.
Swaminathan, M and R.K. Bhagavan. 1972. Our Food. 7th edition, Published by Ganesh and Co. Madras, India. pp. 180-182.
APPENDIX I
Table1.1: Different rehydration ratio of dehydrated cabbage leaves against time at normal water temperature.
Time, hour Rehydration ratio solar dried non blanching sample
solar dried blanching sample
sun dried non blanching sample
sun dried blanching sample
15 4.24 3.42 4.6 3.74
30 4.78 3.5 4.84 4.28
60 5.48 4.64 5.84 5.5
90 5.8 5.26 6.24 6.1
150 7.38 8.98 7.8 7.76
Table1.2: Different rehydration ratio of dehydrated cabbage leaves against time at 500c water temperature.
Time, hour Rehydration ratio solar dried non blanching sample
solar dried blanching sample
sun dried non blanching sample
sun dried blanching sample
15 3.82 3.62 3.92 3.66
30 4.06 3.96 4.14 4.04
60 4.16 4.56 4.7 4.38
120 4.42 6.28 5.62 6.42
Table1.3: Different rehydration ratio of dehydrated cabbage leaves against time at 600c water temperature.
Time, hour Rehydration ratio solar dried non blanching sample
solar dried blanching sample
sun dried non blanching sample
sun dried blanching sample
15 3.56 3.02 3.54 3.88
30 4.28 3.74 4.34 4.48
60 4.86 4.42 4.58 5.24
APPENDIX II
Table 2.1: Sensory evaluation data of dehydrated cabbage
Table 2.1.1: Rating score for color of dehydrated cabbage
Judge No.
Sample-510 Sample-511 Sample-512 Sample-512 Total
1 7 8 6 7 28
2 7 9 9 6 31
3 9 8 8 6 31
4 8 9 9 8 34
5 8 9 8 6 31
6 9 8 8 7 32
7 7 7 9 6 29
8 8 9 9 7 33
9 9 9 7 7 32
10 7 8 8 7 30
Total 79 84 81 67 311
Average 7.9 8.4 8.1 6.7
Table 2.1.2: ANOVA (Analysis of variance) of colour
Sources of variance
Degree of freedom
Sum of squares
Mean squares
F- value
Calculated Tabulated (5%)
Products 3 16.675 5.558 8.7892 2.96
Judges 9 7.225 0.803 1.2694
Error 27 17.075 0.632
Total 39 40.975
Table 2.1.3: Duncun’s Multiple Range Test (DRMT) for colour LSD = 0.7295, Sx = 0.2514, p < 0.05
Sample Original order of means Sample Ranking order of means
510 7.9a 511 8.4a
511 8.4a 512 8.1a
512 513 8.1a 6.7b 510 513 7.9a 6.7b
Table 2.1.4: Rating score for flavor of dehydrated cabbage
Judge No.
Sample-510 Sample-511 Sample-512 Sample-513 Total
2 7 7 7 7 28
3 8 8 9 6 31
4 7 9 8 7 31
5 7 8 8 6 29
6 6 7 9 8 30
7 7 8 6 6 27
8 8 9 8 6 31
9 8 9 8 8 33
10 7 8 9 6 30
Total 73 82 78 65 298
Average 7.3 8.2 7.8 6.5
Table2.1.5: ANOVA (Analysis of variance) of flavour
Sources of variance
Degree of freedom
Sum of squares
Mean squares
F- value
Calculated Tabulated (5 %)
Products 3 16.1 5.367 6.4687 2.96
Judges 9 7.4 0.822 0.9911
Error 27 22.4 0.830
Total 39 45.9
Table 2.1.6: Duncun’s Multiple Range Test (DRMT) for flavour LSD = 0.836, Sx = 0.2881, p< 0.05
Sample Original order of means Sample Ranking order of means
510 7.3bc 511 8.2a
511 8.2a 512 7.8ab
512 513 7.8ab 6.5c 510 513 7.3bc 6.5c
Table 2.1.7: Rating score for texture of dehydrated cabbage
Judge No. Sample-510 Sample-511 Sample-512 Sample-513 Total
1 7 8 6 7 28
2 8 6 7 6 27
3 8 8 8 7 31
4 7 9 7 6 29
5 6 8 8 8 30
6 7 7 8 6 28
7 7 9 9 6 31
8 8 8 7 8 31
9 8 9 8 7 32
Average 7.3 8.0 7.6 6.8
Table 2.1.8: ANOVA (Analysis of variance) of texture
Sources of variance
Degree of freedom
Sum of squares
Mean squares
F- value
Calculated Tabulated (5 %)
Products 3 7.675 2.558 3.8216 2.96
Judges 9 6.025 0.669 1.0
Error 27 18.075 0.669
Total 39 31.775
Table 2.1.9: Duncun’s Multiple Range Test (DRMT) for texture LSD=0.7505, Sx = 0.2587, p< 0.05
Sample Original order of means Sample Ranking order of means
510 7.3ab 511 8.0a
511 8.0a 512 7.6a
512 513 7.6a 6.8b 510 513 7.3ab 6.8b
Table 2.2.1: Rating score for overall acceptability of dehydrated cabbage
Judge No. Sample-510 Sample-511 Sample-511 Sample-513 Total
1 8 8 7 6 29
2 8 9 7 8 32
3 8 8 9 7 32
4 7 9 8 8 32
5 9 8 8 6 31
6 7 8 9 8 32
7 8 9 9 7 33
8 8 7 8 7 30
9 7 9 7 8 31
10 7 9 8 6 30
Total 77 84 80 71 312
Average 7.7 8.4 8.0 7.1
Table 2.2.2: ANOVA (Analysis of variance) of overall acceptability
Sources of variance
Degree of freedom
Sum of squares
Mean squares
F- value
Calculated Tabulated (5 %)
Products 3 9.0 3.0 4.50 2.96
Error 27 18.0 0.667
Total 39 30.4
Table 2.2.3: Duncun’s Multiple Range Test (DRMT) for overall acceptability
LSD=0.7494 , Sx =0.2583, p< 0.05
Sample Original order of means Sample Ranking order of means
510 7.7ab 511 8.4a
511 8.4a 512 8.0a
512 513
8.0a 7.1b
510 513
APPENDIX III
Name of tester --- Date --- Product ---
HEDONIC RATING TEST OF --- (1-9).
Please test the sample and give numerical score ranging from 1 to 9 in the appropriate space.
Parameters Sample- 1 Sample- 2 Sample- 3
Colour Flavour Texture
Overall acceptability
Hedonic scale used: Like extremely = 9 Like very much = 8 Like moderately = 7 Like slightly = 6
Neither like nor dislike = 5
Dislike slightly = 4 Dislike moderately = 3 Dislike very much = 2 Dislike extremely = 1