Western University Western University
Scholarship@Western
Scholarship@Western
Electronic Thesis and Dissertation Repository
5-7-2015 12:00 AM
A Software Framework For Task Based Performance Evaluation
A Software Framework For Task Based Performance Evaluation
Justin J. Mackenzie
The University of Western Ontario
Supervisor Roy Eagleson
The University of Western Ontario Joint Supervisor Sandrine de Ribaupierre
The University of Western Ontario
Graduate Program in Electrical and Computer Engineering
A thesis submitted in partial fulfillment of the requirements for the degree in Master of Engineering Science
© Justin J. Mackenzie 2015
Follow this and additional works at: https://ir.lib.uwo.ca/etd
Part of the Other Computer Engineering Commons
Recommended Citation Recommended Citation
Mackenzie, Justin J., "A Software Framework For Task Based Performance Evaluation" (2015). Electronic Thesis and Dissertation Repository. 2901.
https://ir.lib.uwo.ca/etd/2901
This Dissertation/Thesis is brought to you for free and open access by Scholarship@Western. It has been accepted for inclusion in Electronic Thesis and Dissertation Repository by an authorized administrator of
(Thesis format: Monograph)
by
Justin Mackenzie
Graduate Program in Electrical and Computer Engineering
A thesis submitted in partial fulfillment
of the requirements for the degree of
Masters of Engineering Science
The School of Graduate and Postdoctoral Studies
The University of Western Ontario
London, Ontario, Canada
Abstract
It is difficult to objectively measure performance of complex tasks such as a surgical op-eration and surgical simulators require the ability to evaluate performance whether to predict surgical outcome, determine competence, provide learning feedback, etc. With no standard software framework for collecting, analyzing and evaluating performance data for complex tasks in simulations, it is investigated whether a solution can be implemented that allows for custom data collection schemes, all while being general enough to be used across many sim-ulation platforms and can be used in a simple simulator. It is also investigated whether the implemented framework can perform its functionality while leaving a small performance foot-print on the simulator.
Hierarchical task analysis is investigated as a means to decompose complex tasks into their simpler sub-tasks, where data can be collected for each task and evaluated. The framework is based on hierarchical task representation to allow robust performance data of a complex task to be collected and evaluated for any type of application. A client application is developed and allows for the generation of custom scenario parameters for the task, robust performance data collection and the ability to playback previous performances for evaluation purposes. It is shown that the implemented framework has a small peformance footprint and does not affect the performance of the simulator that is using the framework for performance data collection and evaluation.
Keywords: Surgical Simulation, Performance, Human Computer Interface, Hierarchical Task Analysis,Software Architecture, Design Patterns
I would like to thank all members of my examination committee: Dr. Jagath Samarabandu, Dr. Luiz Capretz, Dr. Ali Khan and Dr. Serguei Primak for taking time out of their busy schedules to attend the examination and provide me with a great amount of input to improve not only this thesis, but my research in general.
I would like to thank my supervisors: Dr. Roy Eagleson and Dr. Sandrine de Ribaupierre. They have always been there with feedback and support during my two year masters journey. Many times they have supplied ideas and feedback that has pushed me along to this point. I would like to thank Roy for his clarification and excellent ideas that have gotten going when I was stuck. I would like to thank Sandrine for her invaluable clinical experience and expertise.
I would like to all members of Dr. Eagleson’s and Dr. de Ribaupierre’s lab for their feed-back, help and support during my last two years. These people include: Matt Kramers, Jing Jin, Saeed Bakhshmand, Lauren Allen, Oleksiy Zakia, Dayna Noltie, Ngan Nguyen and Ryan Armstrong. I would like to especially thank Shaun Carnegie; we started our masters together and spent a lot of time working together on our research; you helped me greatly during these past two years. I wish you good luck with your thesis defense and congratuations on the birth of your children.
I would like to thank my friends who have always been there for me; Jesse Gaccione, Tyler Desplenter, Drew Redick, Allan McCulloch, Colin Ladanchuk, Brendan Logan and many others who have helped me. Even though our lives become busier and we see each other less than we used to, I know that you guys will always be there for me. I would like to especially thank my best friend and best man Scott Van Heesch who always gives me crazy software and business ideas as well as awesome stories to tell my children one day.
I would like to thank my family for their love and support; especially my mother, Judith, has always believed in me no matter what the circumstances and my sisters, Dawn and Samantha who have always been there for me when I needed them. I would also like to thank Billy, Lorena, Billy Jr. and Pamela for their love and support.
I would like to thank from the bottom of heart my uncle Jimmy, who without there is no way that I could have achieved any of this. You have influenced my life so much for the better and there is no amount of words that could describe the gratitude I have towards you. I know you’re still helping me every day.
I would like to thank the two loves of my life; my beautiful daughter Isabella and my loving fiancee Brenda. Without them none of this would have happened. Bella, you make my life so much brighter and happier; you’re getting so big, I can’t believe how fast the time is flying by. Brenda, without your constant help and support, there is no way that I could accomplish this; you’re an amazing woman and I am very lucky to have you.
Lastly, I would like thank my hero and idol, my father, John. You always gave everything you had to your family and taught me what it meant to be a man. I know that you’re still helping me everyday and witnessing all of my achievements.
I dedicate this thesis to you dad. I will always keep my eyes on the prize.
Contents
Abstract ii
Acknowlegements iii
List of Figures vii
List of Tables ix
1 Introduction 1
1.1 Using Simulators for Surgical Training and Evaluation . . . 1
1.2 Fitts’ Law: Evaluating Human Performance . . . 2
1.3 Hierarchical Task Analysis . . . 4
1.4 Hierarchical Task Analysis for Surgical Procedures . . . 6
1.5 Evaluating Human Performance Using Hierarchical Task Analysis . . . 8
1.6 Software Framework . . . 10
1.7 Research Questions . . . 10
1.8 Surgical Simulation Frameworks . . . 10
1.9 Contributions . . . 11
1.10 Layout of Thesis . . . 12
2 Scenario Simulator Framework 14 2.1 Framework Overview . . . 14
2.2 Framework Architecture . . . 15
2.3 The Core Module . . . 17
2.4 Scenario . . . 18
2.5 Actors . . . 19
2.6 Task Hierarchy . . . 20
2.7 Task Transitions . . . 20
2.8 Entities . . . 21
2.9 Complications . . . 21
2.10 Metrics . . . 23
3 Data Acquisition: The Simulation Module 25 3.1 Requirements . . . 25
3.2 The State Chart Module . . . 26
3.2.1 The State Chart Interface . . . 27
3.3 Simulator Module Interface . . . 32
3.4 Scenario Events . . . 32
3.5 Scenario Simulator . . . 33
3.6 Simulation Components . . . 35
3.6.1 Time Keeper Component . . . 35
3.6.2 Parameter Tracking Component . . . 36
3.6.3 Logging Components . . . 37
3.6.4 Scenario Event Collection Component . . . 38
3.7 The Entity Placement . . . 39
3.8 The Enactor Pattern . . . 39
3.9 Complications . . . 43
3.10 Module Performance . . . 43
3.11 Code Analysis . . . 44
4 Performance Evaluation: The Playback Module and Evaluation Components 45 4.1 Objective . . . 45
4.2 Module Design . . . 46
4.3 Scenario Playback Interface . . . 46
4.4 Scenario Playback . . . 47
4.5 Event Enactor . . . 49
4.6 Code Analysis . . . 50
5 The Ellipsoid Orientation Matching Task: Performance Evaluation 52 5.1 Motivation . . . 52
5.2 Overview . . . 52
5.3 Designing the Scenario . . . 53
5.3.1 Hierarchical Task Analysis . . . 53
5.3.2 Hierarchical Task Paths . . . 55
5.4 Generating a Scenario Set . . . 56
5.4.1 Data Collection . . . 60
5.4.2 Error Tracking Components . . . 63
5.5 Scene Design . . . 64
5.5.1 Trial Scene . . . 64
5.5.2 Playback Scene . . . 65
5.5.3 Ghosting Scene . . . 66
5.5.4 Operating Room Scene . . . 67
6 The Ellipsoid Orientation Matching Task: Implementation in Unity3D 70 6.1 The Trial Manager . . . 70
6.2 The Scenario Manager . . . 71
6.3 The Playback Manager . . . 71
6.4 The Input Manager . . . 72
6.5 The Entity Placer . . . 73
6.6 Event Commands . . . 74
6.6.1 Rotate Object Command . . . 75
6.6.2 Move Object In Command . . . 76
6.7 Submit Event Commands . . . 77
6.7.1 Submit Event Command . . . 77
6.7.2 The Derived Submit Event Classes . . . 78
6.7.3 Translate Tool Command . . . 79
6.8 The Complication Enactors . . . 80
6.9 Enacting Events for Playback . . . 81
6.9.1 The Command Invoker . . . 81
6.9.2 The Event Enactor . . . 83
7 Closing Remarks 86 7.1 Discussion and Conclusion . . . 86
7.2 Future Work . . . 89
Bibliography 91
Curriculum Vitae 94
1.1 An example task hierarchy. . . 5
1.2 An example flow definition of a hierarchical task anaylsis. . . 5
1.3 A state chart representation of a hierarchical task definition. . . 7
2.1 The actors and the domain. . . 15
2.2 The high level architecture of the framework. . . 16
2.3 The interaction between interior modules and exterior applications. . . 17
2.4 The onion architecture of the framework. . . 18
2.5 The scenario class. . . 19
2.6 The actor class. . . 19
2.7 The task and tree node classes. . . 20
2.8 The task transition class. . . 21
2.9 The entity class structure. . . 22
2.10 The complication class hierarchy. . . 23
2.11 The accuracy metric structure. . . 24
2.12 The task result structure. . . 24
3.1 A use case diagram of the scenario simulator module . . . 26
3.2 A typical architecture between high level modules and low level modules be-fore DIP. . . 28
3.3 The architecture after inverting the dependency. . . 29
3.4 A class diagram of the state chart interface. . . 30
3.5 The UML state chart wrapper module. . . 31
3.6 The IScenarioSimulator interface. . . 33
3.7 The IScenarioSimulator interface. . . 34
3.8 The ISimulationComponent interface. . . 35
3.9 The Logging component structure . . . 38
3.10 The file serializer structure . . . 39
3.11 The entity placer interface. . . 40
3.12 The enactor pattern. . . 41
3.13 The complication enactor component structure. . . 43
4.1 The IScenarioPlayback interface . . . 47
4.2 The scenario simulator sequence diagram. . . 48
4.3 The scenario playback sequence diagram. . . 49
4.4 The event enactor abstraction. . . 50
4.5 The scenario playback module. . . 51
5.1 A preliminary task hierarchy for the ellipsoid orientation matching task. . . 53
5.2 A spherical coordinate system representation. [source: Wikipedia Commons] . 54 5.3 The task hierarchy after decomposing the position tool task. . . 55
5.4 The ellipsoid’s longest axis. . . 58
5.5 The first attempt at finding ideal position. . . 59
5.6 The second attempt at finding ideal position. . . 60
5.7 An example position error graph that is produced. . . 62
5.8 An example direction error graph that is produced. . . 62
5.9 An example normalized error graph that is produced. . . 63
5.10 The error tracking components structure. . . 65
5.11 The initial screen. . . 66
5.12 The generated target. . . 66
5.13 The trainee moving the tool. . . 67
5.14 The trainee changing the view. . . 67
5.15 The trainee rotating the tool. . . 68
5.16 The playback screen. . . 68
5.17 The ghosting screen. . . 69
5.18 The operating room scene. . . 69
6.1 The scenario manage relationship with the framework. . . 71
6.2 The scenario manage class. . . 72
6.3 The playback manager relationship. . . 72
6.4 The unity entity placer. . . 74
6.5 The command invokaton from the user input. . . 75
6.6 Command invocation from the play back. . . 75
6.7 The ICommand interface. . . 76
6.8 The submit event command. . . 78
6.9 The bleed complication enactor class. . . 81
6.10 The command invoker process. . . 82
6.11 The command invoker structure. . . 84
3.1 Scenario Simulator Performance . . . 44 3.2 Scenario Simulator Code Metrics . . . 44
4.1 Scenario Playback Code Metrics . . . 50
Chapter 1
Introduction
1.1
Using Simulators for Surgical Training and Evaluation
Surgical simulators can take all shapes and forms; there can be inanimate artificial tissue or organs, fresh tissue or animal models and virtual reality simulation.[41, 40, 18] Inanimate simulators represent simulators that use inanimate objects [22], artificial tissue or organs to represent patients; these simulators can either fall into the low fidelity category or the high fidelity category. Fidelity is a term used to define how realistic a simulator is; a low fidelity simulator [30, 37] may not be as realistic as a high fidelity simulator, but they are usually much less expensive to research and develop. Many studies have been conducted to investigate if there is a correlation between fidelity and overall performance of the simulator and its ability to help transfer, teach and provide safety, but no results show that they do correlate.[10]
Surgical simulation offers many benefits, but simulators are still far from being greatly in-corporated into surgical training. In order for simulators to be recognized as legitimate training and assessment tools that can partially replace or work in conjunction the existing master-apprentice model, simulators must be proven valid. There are a number of validities associated with simulators, these include: construct validity, content validity, concurrent validity and pre-dictive validity. Construct validity represents the extent to which an intended trait is measur-able, content validity represents the appropriateness of measures tested in the simulator to the task being trained, the concurrent validity represents the correlation between the performance in the simulator to the performance in the real operating room and predictive validity repre-sents the correlation between the future surgical performance and the surgical performance in the simulator. [24]
One of the main goals of all simulators is to prove that a given simulator is concurrently valid, which means that if a trainee performs well in the simulator, they should perform well in the operating room. The concurrent validity goes hand-in-hand with task transfer from the surgical simulator to the real environment, in other words, if a trainee learns the skills in the simulator, they should learn those skills for the real operation as well. One of the key goals of simulators is to improve the transfer of skills from the simulator to the operating room; while, studies have not shown any real transfer [4], other more recent studies have begun to show more promising results. [15] Performance on a simulator can be a great assessment tool if it can be proven that performance on a simulator is correlated to the performance in the operating
room. Studies have shown that trainees that have trained in a simulator have skills transferred to the real life operative environment.[15] Simulator-trained trainees have been shown to score significantly higher performance in surgical competency than trainees who did not train on simulators.[13] Laparoscopic simulators have been shown to improve the surgical skills as well as the quality of tasks and speed of the tasks. [21]
An over-arching goal of surgical simulators is to provide a safe and convenient means for surgical residents to train practice surgical techniques. One of the great benefits of surgical simulation is the removal of patients from the training process; this alone is incredible as it will help lower the risk to patients in the operating room. Keeping with the previous point, the use of simulators in training is the reduction in the need for patients for training.[15] The reduction in need for the patients leads to greater patient safety as well as more flexible training for trainees. With more flexibility offered to the trainees, the trainees can train more often and even in their own home on their own time, if the simulator is portable enough. In keeping with the convenience, simulators can provide instant feedback to the trainee and would not require an experienced teacher or any evaluator for that matter to be present during the training session.[4] One of the great benefits for using simulators for surgical training is that it allows the trainee to perform the training and practice at their own convenience.[4] It has been shown that trainees who use portable simulators in conjunction with the surgical training curriculum, perform better than trainees who did not. [21]
Simulators with predictive validity essentially allow for the prediction of real operations based off of the simulation. A goal of simulators is to provide the ability to be used as an assessment tool, where simulators can predict real-life surgical procedure performance. Sur-gical simulator results have been shown to be able to predict the surSur-gical outcome [4], that is where the trainees performed well in the simulator, they also performed well in the real surgical procedure; thus simulators as assessment tools provide great potential.
Surgical perceptual and motor skills, just like any other perceptual and motor skills [16], can be represented through time and accuracy metrics. Examples of accuracy metrics in the surgical domain include position, trajectory, force, or unintended contacts.[24]
One weakness of the current training techniques is the lack of exposure to rare or extreme cases in the operating room. There are complications that a resident may never witness or need to experience in a surgical procedure that the resident may have to deal with after they have finished their training in a real operation. Simulation can provide trainees the abilities to experience and practice rare complications and events in a non-life threatening matter.[41] The ability to practice rare or extreme cases that otherwise the resident would never experience, they will be better equipped to deal with the complications if they arise in a real operation.
1.2
Fitts’ Law: Evaluating Human Performance
1.2. Fitts’ Law: EvaluatingHumanPerformance 3
another. From these results, Fitts was able to formulate a model for determining the difficulty of a task and the performance of a task.
Index of difficulty, IDis value that represents how difficult a particular task is to perform; the units of index of difficulty are bits. The higher the index of difficulty, the higher difficulty the task is to perform. To determine the index of difficulty the following formula was derived:
ID= log2 2D
W (1.1)
Where Dis the distance to the target andW is the width of the target or otherwise known as the error tolerance area.
The index of performance, IP, represents how well a user performed a given task, where index of performance is in bits per second. The higher the index of performance, the better the performance by the user. Next one can calculate the index of performance,IPin the following manner:
IP= ID
MT (1.2)
Where MT is the mean time to complete the task.
There are a few key observations to make here; firstly, the index of difficulty is directly proportional to the width of the target and the distance to the target. As the target becomes further away from the starting point, intuitively, the task becomes harder and this reflects in the index of difficulty. Similarly, when the target’s error tolerance area becomes smaller, the index of difficulty increases. Index of performance is relational to the index of difficulty, where the greater the index of difficulty, the greater the index of performance; this supports such cases where the performance of two tasks are compared with one another, if the tasks are performed in the same time, but one is much more difficult, than that performance is more impressive. Index of performance is also dependent on the time it takes to complete the task, where the longer the time, the lesser the performance. The time versus performance relationship creates the speed versus accuracy trade-off dynamic. The more difficult a task becomes, the more attention the trainee pays to accuracy, the greater the time it takes to perform the task and vice versa; this leads to interesting questions such as; will the user perform the task more quickly and sacrifice accuracy or the other way around?
Another form of Fitts’ law that has been widely used by researchers was proposed by Scott MacKenzie [26]:
MT =a+bID= a+blog2 2D
W (1.3)
Whereaandbare model parameters.
This form is derived from the practice of linear regression. Given a set of performance times and index of difficulty (which can be derived from the distance and error tolerance parameters) for each time, linear regression can be used to derive a formula similar to equation 1.3 Typically researchers will vary the distance or the error tolerance to build a more robust model.
In the study, four experiments are conducted to study difficulty and performance of the tasks: the goal passing task, where the user must navigate through a number of goal posts, second was the increasing constraints task, where the user was required to navigate through a tunnel that widened, third was the narrowing tunnel task, where the user navigated through a tunnel that was narrowing as they progressed, and lastly was the spiral tunnel task, where the user required to navigate through a sprial tunnel. In all of these tasks, the users had to keep in mind both dimensions when navigating the various paths and tunnels, where the tasks in Fitts’ experiments did not contain two dimensions. The following is the general form of the steering law that was found:
T = a+b
Z
C
ds
W(s) (1.4)
Where T is the time it takes to navigate through the path, C that is parameterized with s. For simpler paths, such as a straight tunnel, the steering law can be simplified to the following:
T = a+bA
W (1.5)
The paper also investigated the difficulty and performance of navigating cascading menus that are common to graphical user interfaces. When navigating a cascading menu, the user can go through multiple routes and the time it takes for each position and selection contributes to the overall time. For example, if the user needs to navigate through three menu options, the total time, T will be the sum of all of the sub-tasks (reaching each checkpoint). There has been much research in applying Fitts’ law to more complex tasks such as three dimensional targeting tasks, exploring how to model index of difficulty and index of performance for three dimensional tasks.[12, 33]
Fitts’ law and the following works by other researchers over the past 60 years have estab-lished an empirical and objective method to measure performance of targeting tasks. These methods only allow for the evaluation of performance on simple targeting tasks that involve only position and selection. How can a complex task such as surgery be evaluated using the methods described in this section?
1.3
Hierarchical Task Analysis
1.3. HierarchicalTaskAnalysis 5
of goals, where the goal represents the end means of a task. A complex task such as surgery is represented by a collection of sub-tasks that compose that complex task. A parent or complex task is decomposed into its sub-tasks to promote simplification of tasks and defining their plans and goals. Each task or goal has a plan that indicates how the child goals are carried out; the plans co-ordinate the unit (complex task composed of smaller simpler tasks)[36] Figure 1.1 displays the hierarchical definition and figure 1.2 illustrates the path or flow definition of a simple example hierarchical task analysis.
Figure 1.1: An example task hierarchy.
Figure 1.2: An example flow definition of a hierarchical task anaylsis.
What exactly is a task? Shepherd mentions tasks can be seen from the perspective of a problem that needs to be solved; the problem that needs to be solved will contain an initial state, responses that affect the state and an environment.[36] Hierarchical task analysis is designed to be the starting point of a task analysis and then other techniques can extend the analysis. [39] Viewing a task from this perspective illustrates one key concept; that if the purpose of a task is to complete a specific goal or solve a specific problem, then determining how well a user performed the task can be determined from whether they completed the goal or how close they were to completing the goal. Representing the tasks as a problem to be solved, simplifies both the performance and the evaluation process as both the performer and the evaluator has a clear a goal in mind on what to complete or evaluate.
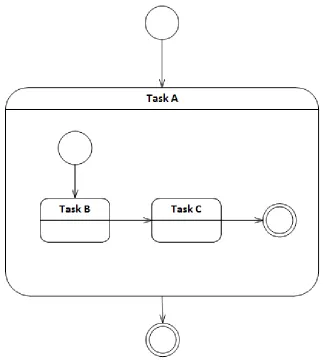
component (for each task), the hierarchical task definition is drawing many similarity to state charts. [20] Introducing hierarchical task analysis to the state chart domain allows for real time use of the definition as the definition will now contain a state or set of states. To make the transition from a hierarchical task definition to a state chart definition requires two main connections; one is the transformation of a task, and thus problem, to a state. It is natural to think that when a performer is performing a task to complete the goal, they are in the act or state of performing that task. For example, if the task is to insert a tool in the patient’s head, before the performer completes that goal, they are in the state of inserting the tool in the patient’s head. The completion of the goal of the task represents the desired input for the state to transition to the next task. Transitions in the state chart representation would be transformed from the path definition; where the source task is the completed task, the input to trigger the transition is the completion of the task and the destination is the next task in the path definition. Since state charts support hierarchy of states, the hierarchical relationships between tasks in the hierarchical task definitions are maintained. The link between hierarchi-cal task analysis and state-space combination with transition matricies has been proposed.[9] Figure reffig:StateChartRepresentation illustrates the state representation of a hierarchical task definition.
Hierarchical task analysis definitions are mainly constructed through research in the do-main and consultation with dodo-main experts and task performers. [34, 23, 35] Software toolkits have been developed to create hierarchical task analysis definitions. [42] These tools typically involve a method in define the hierarchical task tree structure, that will contain the name and information for each node. (or task) The tools will also support the ability to define paths for the definition. The tools also offer the ability to generate the tabular representation as well.[8] Hierarchical task analysis can be used to break down a very complex task into smaller sub tasks.
1.4
Hierarchical Task Analysis for Surgical Procedures
Given the ability to break down complex tasks and goals into their sub-tasks produces many new opportunities to a variety of industries. Surgical procedures are very complex tasks that contain many sub-tasks and phases that must be completed during the surgical procedure and since the field is always looking to improve the analysis and performance of tasks, hierarchical task analysis has been researched as a viable tool to aid in analysis of surgical procedures. Hi-erarchical task analysis can be used to decompose a surgical operation into smaller operation tasks, where these tasks are able to be simply evaluated and provide a link between actions and errors.[14] Various research studies have been conducted around the idea of applying hierar-chical task analysis to the field of surgery.[34, 35, 5] Hierarhierar-chical task analysis has also been applied outside the surgical context in regard to medication application in hospitals.[23]
1.4. HierarchicalTaskAnalysis forSurgicalProcedures 7
Figure 1.3: A state chart representation of a hierarchical task definition.
had content and face validity. An interesting concept was that the hierarchical task analysis provided a definition of the tasks that correlate to the interaction between team members in the operating theatre. A multiple role task analysis allows for the performance of each member of the team to be measured, but also allows for the performance of the interaction between two members to be evaluated as well.
1.5
Evaluating Human Performance Using Hierarchical Task
Analysis
The main issue that was mentioned in evaluating human performance was that methods such as Fitts’ Law are designed for simple targeting tasks. A complex task such as ETV or other surgical procedures cannot be simply measured using a single score, as it is not objective. Hierarchical task analysis has provided a way for task analyzers to break down a complex task into smaller tasks. It has been shown that surgical procedures can be represented as a hierarchy of tasks using the methods of hierarchical task analysis.[35] The first step of the evaluation paradigm is task decomposition, where task at hand must be decomposed into a number of sub-tasks. This decomposition is recursive and creates a tree of tasks where the nodes higher up in the tree are more abstract and complex tasks and the leaf nodes are the basic and simple tasks.
It is a principle of the analysis of human-computer interaction that tasks can be decomposed into basic components, which at their bottom level are one of the following types: Selection, Quantification, Position and Text. The hierarchical task description of user inputs completes when the sub-tasks corresponding to user interactions are iteratively decomposed until they are low-level primitives of positioning and selection. At this point, the prescription for evaluation of performance is based on Fitts’ methodology, which respects the trade-offbetween the users’ criteria of speed versus accuracy. Their sub-task performance for each interaction is the product of their speed and accuracy, averaged over a number of trial conditions, in which the difficulty of the spatial configuration of the task is varied systematically.[38, 26]
Although Fitts’ law focuses on 1-dimensional cases, in an interactive immersive 3-dimensional environment, the same is true when one considers extending quantification and position from 1-dimensional or 2-dimensional cases to 3-dimensional positions, or by extension to 6 degree of freedom systems. Selection can take the form of button presses, but also within interactive virtual environments can be events where objects are made to be touched by the user (such as selecting a region, selecting a menu item from a virtual menu or by expressing a single recognizable gesture.) Text can be input from a keyboard, voice recognition, or sequences of gestures intended as the symbols for an input stream.
1.5. EvaluatingHumanPerformanceUsingHierarchicalTaskAnalysis 9
issue at hand, the performance of the low level tasks can be evaluated, but the evaluation of the higher level tasks still remain in question.
Part of the process of analysis in the construction of a hierarchical task description is that certain low-level aspects of the tasks will invariably include perceptual detection, localiza-tion, and spatial reasoning. In these phases of the task, the evaluation of user performance is formulated using experimental paradigms from psychophysics. For detection tasks, staircase paradigms can be used to establish just-noticeable difference (JNDs) [25, 7] of features that are salient to the task, in the graphical or live stream media.
By extension, aspects of the tasks which require decision-theoretic criteria to be applied, or to perform spatial reasoning in order to assess topological properties within the scene, then receiver operating characteristic models [19, 43] from signal detection theory are utilized to assess user performance in terms of the area under the curve (AUC) of the users’ perceptual receiver operating characteristic (ROC) and the logarithmic transformation from the ROC to the detection error trade off(DET) curve. [27, 3]
In each case, the accuracy of detection or spatial reasoning is also an entropy measure, which is a function of the difficulty of the task in terms of its effective signal to noise ratio; similar to that of Fitts’ Law. Accordingly, the user performance in the perceptual components of the task is the product of speed and accuracy, just as for the perceptual-motor components.
In order to evaluate performance of a complex, overarching task, one needs to aggregate the performance over its sequence of sub-tasks. Following this approach, any complex task in the hierarchy can be evaluated based on its sub tasks. (Which can be complex tasks as well) Given a task A that is composed of two tasks B and C, then the mean time to accomplish A will be the mean time to accomplish both B and C:
MTA = MTB+MTC (1.6)
Now, suppose that task B has two child tasks, D and E; the mean time to complete B would be the sum of the mean times to complete D and E.
MTA = MTB+ MTC = MTD+MTE +MTC (1.7) By extension, any task T that is composed of a number of child tasks can be represented as such:
MTT = N X
i=1
MTi (1.8)
WhereN is the number of leaf nodes in the subtree under taskT. Taking this equation and substituting the formula from equation 1.3, the following is obtained:
MTT = N X
i=1
ai+biIDi (1.9)
MTT = N X
i=1
WhereA=PNi=1ai. Given this definition, it is possible to determine the mean time to com-plete a complex task by using it’s simple position and selection sub-tasks. This representation also demonstrates how any sub-task in the hierarchical task definition affects the time to com-plete the complex task. Using a hierarchical representation allows the ability to investigate the data collected and evaluate the performance of all tasks in the hierarchy and to investigate the affect of various child tasks on the performance of their parent tasks.
1.6
Software Framework
The representation for hierarchical tasks, including software-based aspects that encode the in-teractions with methods that assess interaction task times, to subsequently assess the speed component of performance, and which aggregate each trial’s position, to subsequently assess the accuracy component of performance by comparing inter-subject and intra-subject variabil-ity is the basis by which the developed simulator modules are instrumented in order to assess users’ performance across their training regime.
It is natural to assume that a software-based framework for interleaving the graphics-based and physics-based interactions in the virtual training environment needs to be interleaved with the accompanying objective metrics of performance. It would be ideal that the software frame-work would be able to support a variety of different applications, where it can be a simulator, a simple desktop targeting task or a simulator on a mobile device. The software framework would present the ability to users to input a hierarchical task definition into custom scenarios and performance will be calculated and analyzed by the framework. Trainees and other users would be able to perform the tasks that were defined in the hierarchical task definition and while doing so, the framework will be collecting the data from the performance and calculate metrics such as speed and accuracy, such that Fitts’ Law index of difficulty and index of per-formance values can be calculated over time. The motivation behind each consumer of the framework can vary, a simulation designer and developer will want to collect performance for the purpose of training and evaluation of a surgeon’s ability to perform a real surgery.
1.7
Research Questions
Can a simulation software framework that allows the custom data collection and evaluation of the performance of a complex hierarchical task be implemented?
Can the simulation software framework be proven to robustly collect data without leaving a large performance footprint?
Can the simulation software framework be integrated into a simple surgical simulation scenario to collect meaningful and evaluate performance data for that scenario?
1.8
Surgical Simulation Frameworks
1.9. Contributions 11
of physics and graphics and don’t provide much functionality in the realm of performance evaluation.
SPRING [29] was developed in the early 2000s by a group from Stanford. SPRING is implemented in C++, while using OpenGL for rendering and aimed to provide a general base of functionality that would be required in any simulators such as visual rendering, physics calculations, input, etc. The SPRING framework’s architecture was divided into several main components, these being: visual rendering, the core, which would handle the physics and collision calculations and logic, the object and asset management system and user input, which supported haptics, network and other types of input schemes. There is no mention of any type of data collection or user performance review and evaluation in the SPRING framework.
GiPSi [11] is a simulation framework that came after SPRING and was also developed in the early 2000s. GiPSi is also implemented in C++and provides functionality such as visual rendering, haptic interfacing, collision detection and the majority of attention to object models. The framework provides a great amount of flexibility when defining computational models to represent simulation objects, for example, heart tissue deformation. There is no mention of any type of data collection or user performance review and evaluation in the GiPSi framework.
SOFA [6] is a simulation framework that was developed in the mid-2000s is completely open source and developed in C++. SOFA’s main goal is to provide a very flexible and cus-tomizable surgical simulation framework. The framework offers a very modular architecture where the functionality of the framework can be highly flexible and extendable. The main fo-cus of this modularity is in the modelling of simulation objects, somewhat similar to the goal of the GiPSi framework. SOFA allows the ability to combine multiple modelling components through a mapping component, such that they may work together to provide the overall be-haviour of an object, for example, a bebe-haviour model may contain a collision model, a visual model, a haptic model, etc. SOFA is still open source and is still actively developed to this day and many new features have been contributed by the community that supports SOFA. SOFA did not originally have any mention of performance data collection or evaluation, but upon further review of the current state of the project, it does contain a monitoring component, that provides some monitoring and data collection functionality. The monitoring component allows the ability to visualize positions, trajectories, velocities and forces of particles in the GUI or output them to a file. This monitoring provides the ability to collect property data about ob-jects in the scene. The performance is not calculated and evaluation is not determined by the monitoring module itself, just the ability to log properties of objects.
1.9
Contributions
The main contributions of this thesis are:
• An approach to determine human performance of a complex task using principles of hierarchical task analysis and Fitts’ Law.
• An algorithm for representing a hierarchical task analysis as a state chart.
• A software component that provides flexible, extendable and robust hierarchical task performance data collection to simulator applications with very minimal overhead that is controlled by the scenario definition.
• A software component that provides playback of previous scenario performance in a variety of formats.
• A scenario for a brain tumour removal task is developed and a simulator application is developed in Unity3D for the task.
• The simulator utilizes the software components to provide performance data collection and playback functionality.
1.10
Layout of Thesis
This document will discuss a proposed software framework to conduct scenario simulations, collect data and playback a performance, as well as an example client application in a number of sections. The document contains many illustrations to aid in clarification of ideas that are written in text; types of illustrations include: UML class diagrams, UML sequence diagrams, UML use case diagrams, state charts, basic illustration diagrams, charts and screen shots. The document also contains many source code snippets; these code snippets will aid in understand-ing how the system is able to implement the ideas that are discussed in text. The source code of the framework and client application are written in the C# programming language and thus the code snippets reflect that.
The remaining part of this thesis is broken into four main sections:
• The Framework Overview and Domain
• Data Acquisition
• Performance Playback and Review
• Design of the Ellipsoid Orientation Matching Application
• The Implementation of the Application in Unity
The framework overview and domain will give an overview of the proposed task-based performance evaluation software framework and discuss the core module in detail. The sec-tion includes discussion on the actors of the domain and how they interact with the proposed framework, high level architecture of the system, the various modules and applications in the framework. Lastly, the section concludes with a detailed description and analysis of the core module of the framework.
1.10. Layout ofThesis 13
Performance playback and review will discuss the playback module, which allows the abil-ity to playback a previous performance to a viewer for the purposes of review and evaluating performance. The principles and design behind the playback are presented as well how the module interfaces with other components.
Design of the ellipsoid orientation matching application will discuss the design of an appli-cation that will require the trainee to perform a simple targeting task while using the framework to collect data and provide playback functionality. The section will discuss the hierarchical task analysis of a basic targting task and how to formulate a scenario from the analysis. Scenario set generation is discussed to provide a means for generating many scenarios for a trainee to per-form. The section will also discuss the performance calculations that will be used to evaluate performance of the task.
Scenario Simulator Framework
2.1
Framework Overview
The framework caters to many different roles in the training and performance evaluation do-main. There are a few roles that exist in the domain:
• Trainee
• Experimenter
• Evaluator
• Scenario Author
• Curriculum Designer
The trainee is the actor that performs a scenario and will be a part of evaluation of the performance process. The trainee will interact with the domain through the scenario simu-lator application to perform a scenario and a playback application to review an performance. The experimenter is the actor that conducts the scenario that the trainee will perform. The experimenter interacts through the scenario simulator application to conduct the scenario per-formance sessions with the trainee. The evaluator is the actor that evaluates the perper-formance with the trainee. The evaluator interacts through the playback application to review a perfor-mance with the trainee and they will use a data analysis application to evaluate the perforperfor-mance. The scenario author is the actor that creates the scenarios that are designed by a curriculum de-signer and performed by the trainee. The scenario author will interact with the domain through a scenario creation application, which would enable them to create scenarios with tasks, com-plications, etc. The curriculum designer is the actor that designs the elements to be authored in the scenarios; they interact with the playback and data analysis applications to discover short-term and long-term trends to seek improvements in the curriculum.
2.2. FrameworkArchitecture 15
Figure 2.1: The actors and the domain.
2.2
Framework Architecture
The architecture of the framework is split into three main modules: the simulation, the playback and the core modules. Refer to figure 2.2 for a package diagram of the framework; which displays the three main modules and their dependencies on one another.
Figure 2.2: The high level architecture of the framework.
core module and the simulator module for replaying previous performances.
In section 2.1, it was illustrated and described how a variety of actors interact with different applications. The following applications would interact with the framework like so:
• Scenario Creator Application: The creator application is responsible for authoring the scenarios and thus would rely on the core module of the framework. Since the creator application does not need any simulator or playback functionality, the core is the only module of the framework that it would rely on.
• Scenario Simulator Application: The simulator application can take many forms such from a simulator to a mobile application. These applications will contain the scenarios that the user performs and will collect data through the scenario simulator module.
• Scenario Playback Application: The playback application can be used as an evaluation and learning tool. The playback application will use the playback module to review and replay previous performances.
• Scenario Performance Application: The performance application can be used to analyze and review data results obtained by the simulator module. The performance application will use the playback module to access the ability to review previous performances.
2.3. TheCoreModule 17
Figure 2.3: The interaction between interior modules and exterior applications.
behind this is the Dependency Inversion Principle (DIP), which states that high level policies should not depend on the details.[28] With high level modules such as the core module and even the simulator and playback services not depending on the details of the outside layers of the architecture, the outside layers can simply be swapped out as if they are plugins. The ele-gance of the proposed architecture means that the framework would not care about care about details such as the persistent storage mechanisms; it would be trivial to swap out the support for SQL Server database to MongoDB to XML serialized files. Another benefit of placing implementation details on the outside of the architecture is that it allows custom simulation components, which will be discussed in section 3.6, to be easily implemented and plugged into the framework with no additional development effort.
2.3
The Core Module
Figure 2.4: The onion architecture of the framework.
from the framework to the client application and presented to the user. While the scenario is being performed by the user, the correct flow and hierarchy of the tasks must be presented to the users through the feedback mechanism, which will be the client application.
Please note for the rest of the chapter, terms such as actors and scenarios relate to the domain of task performance analysis and not with software engineering.
2.4
Scenario
A scenario in the contexts of the framework, which is a hierarchical task-based performance evaluation framework, contains a few elements: an actor, a sequence of events and a context. The actor represents the role that submits or responds to events in the scenario, the events are a compilation of the actions performed by the user, as well as complications. The context describes the environment that the scenario takes in. Refer to figure 2.5 for the scenario class structure.
2.5. Actors 19
Figure 2.5: The scenario class.
2.5
Actors
An actor is a role in the scenario that initiates or participates in the flow of events of the scenario. An actor can be controlled by the trainee or by an artificial intelligence-controlled agent. Actors in surgical simulator scenarios for example, are represented most often by 3-dimensional avatars that have the ability to move around in the 3-3-dimensional world and inter-act with the virtual world around them. Actors in other environments can be represented by 2-dimension avatars in a 2-dimensional environment, or not at all where there is no avatar for the user. The trainee’s interactions alone represent an actor in the system. Thus, an actor can simply be abstracted to the role of an entity that can submit or receive events to/from the sys-tem. In the current implementation, each actor will have its own scenario. Figure 2.6 illustrates the actor class.
2.6
Task Hierarchy
To allow the ability to track performance on a task-by-task basis, hierarchical task analysis (HTA) was proposed as a solution in section 1.5. Since, HTA is based around tasks, it is intuitive to create an object to represent tasks and this leads to theTask class. The task class contains a name for the task and a list of accuracy metrics, which coincide with accuracy also discussed in section 1.5. Another key proponent to HTA is the hierarchical structure of the tasks, which follows an N-ary tree structure. A tree node generic data structure, with theTask
class as its given type, where each node is a task, allows for the hierarchical task structure to be represented in the framework; for example:
Task matchOrientationTask = new Task () { Name = " Match Ellipsoid Orientation " }; TreeNode <Task > matchOrientationNode = new TreeNode <Task >( matchOrientationTask );
Given this structure, there a few properties to observe; the root node task will be the task in the scenario; an example task could be "Perform Endoscopic Third Ventriculostomy Pro-cedure". The generic tree structure allows for simple traversal, retrieval of child objects and insertion of child objects; for example:
matchOrientationNode . AppendChild ( positionToolTask );
The decision to create a generic tree node class was made to accommodate any future requirements that would require a tree-like structure. The tree node structure will contain a reference to all of its child nodes and the task node, where the task node will hold the task specific data. The tasks are essentially the goals or items to complete that will contribute to the success of the overall task. [36]
Figure 2.7: The task and tree node classes.
2.7
Task Transitions
2.8. Entities 21
flow from one task to another. HTA proposed a plan, which would organize the tasks into a chronological order, such that a flow can be established from one sub task to another. The
TaskTransition class governs how the tasks flow from one to another. Each task transition contains the source task’s name, the destination task’s name and the identification number of the event or action that triggers the control to flow from one task to another. This structure resembles an entry in a state transition table.
TaskTransition transition = new TaskTransition () { EventId = 2, Source = " Translate Tool", Destination = " Rotate Tool" }
Refer to figure 2.8 for the class diagram of the task transition class.
Figure 2.8: The task transition class.
2.8
Entities
The context of the scenario is the geometrical definition of the scenario, or otherwise known as the scene. The context contains the physical items in the scenario; examples of this would be a patient, the trainee or a tool. In a 3-dimensional virtual environment, 3-dimensional mesh mod-els can represent these items in the geometric context. In a 2-dimensional environment, sprites or event UI elements such as buttons can represent entities. The entity class contains a refer-ence to the Transform structure which contains three 3-dimension vector objects (Vector3f); position, rotation and scale.
Transform tool = new Transform (new Vector3f (0, 0.8f, -90.3f), new Vector3f (270 , 180 , 0) , new
Vector3f (0.25f, 0.25f, 0.25 f));
Entity toolEntity = new Entity () { Id = 2, Name = "Tool ", transform = tool }
The position controls the position of the entity in the context, the rotation controls the euler angles of rotation and the scale controls the scaling of the entity in the three directions. Refer to figure 2.9 for the structure and relationship between these structures.
2.9
Complications
Figure 2.9: The entity class structure.
allow scenario authors to inject custom events into an ideal scenario to introduce new obsta-cles to be faced by the user. Complications are the elements that separate the base or template scenario from the custom and specific scenarios. There are a variety of complications:
1. Task Entry complications: Complications that are triggered when entering the phase of completing a new task. This will be an event that is triggered from another event.
2. Task exit complications: Complications that are triggered when exiting the phase of completing a task This will be an event that is triggered from another event.
3. Timed Task Entry complications: Complications that are triggered after a certain time value after entering a new task.
4. Timed task exit complications: Complications that are triggered after a certain time value after exiting a task.
2.10. Metrics 23
Figure 2.10: The complication class hierarchy.
2.10
Metrics
To be able to calculate accuracy metrics for a task as described in section 1.5, an accuracy met-ric structure was created. TheAccuracyMetricis a abstract base class that follows the template method design pattern, where theCalculateErrormethod is the abstract method implemented by the derived child classes. The accuracy metric is responsible for holding the expected value, the name of the metric, the place to find the actual value of the metric (this is in the form of a event-parameter pair). Currently, there are two sub-classes that follow the template method pattern, these are theDirectionAccuracyMetricand thePositionAccuracyMetric. The template method design pattern is used to abstract common behaviour between the position accuracy metric class and the direction accuracy metric class to a common inherited class, while keep-ing the different behaviour in the sub-classes though theCalculatemethod. These two metrics and their calculation will be discussed in great detail later in section 5.4.1. Refer to figure 2.11 for the accuracy metric class structure.
Figure 2.11: The accuracy metric structure.
Chapter 3
Data Acquisition: The Simulation Module
Recall in chapter 1 it was established through the methods of hierarchical task analysis that a complex task can be broken down into a hierarchical tree of tasks. The flow of the tasks from one to another was defined in the plan of the hierarchical task analysis. In chapter 2, the hierarchical task tree and the task transitions are defined in the scenario inside of the core domain of the framework. The scenario domain definition is great for defining a hierarchical task definition, a task flow definition, the environment of the scenario, the actors participating in the scenario and the events that arise in a scenario.
The next step is to establish the link from the hierarchical task analysis and scenario domain to the evaluation domain. In order to evaluate performance of a scenario by a user, the data of a scenario performance must be collected; the data acquisition functionality of the framework is handled by the simulation module, which will be explained in detail in this chapter. The simulator module allows a hierarchical-task-based-scenario to be played through by a user in a client application, who assumes the role of an actor in the scenario.
3.1
Requirements
The following list is composed of the current requirements of the module; these have grown over time and originally started as only an initial few.
• The complications in the scenario must be sent as feedback to the user at the correct time.
• The correct parameter data must be collected in the correct moments based on what the scenario author specifies.
• The correct metrics and calculations must be performed based on the correct events and tasks.
• To keep track of the performance of tasks, time spent performing each task must be kept. This will help with the evaluation of the speed of each task.
• When analyzing the requirements, it was difficult to envision a hierarchical structure that would essentially interact with the user through a client application.
• The component would operate as follows:
• Accept an input from the user via the client application. • Calculate any metrics based on the current task.
• Determine if the current task was completed. • Start the new task if it was.
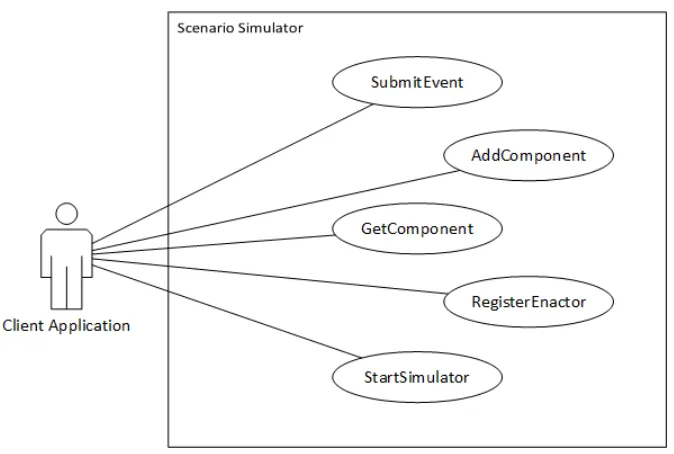
Figure 3.1: A use case diagram of the scenario simulator module
3.2
The State Chart Module
State charts were used to provide a component that would trigger complications and collect data based on the scenario and hierarchical task definition. The benefits of using state charts are the following:
• State charts allow the ability to input events into the state chart and the proper transitions will be taken.
• Intuitively a task and state correspond to one another. When the user is performing a task, they are in the state of performing that task.
• This is very similar to the flow of tasks from one to the other defined in the plan in HTA. • It is easy to tell if a task is being started or has just finished because the corresponding
3.2. TheStateChartModule 27
• It is easy to tell if a task is currently being performed, by checking if that state is currently active.
• It is easy to spawn complications based offof tasks by using the state entry or exit actions. • The hierarchy of tasks is preserved and once again, it is simple to see what tasks are currently being performed (including the parent tasks) because it is easy to see what states are active in a state chart, even the hierarchical states.
• It is simple to produce entry, do and exit actions that are synonymous with state charts to inject complications into the task hierarchy execution.
• It is simple to create events to send into the state chart to trigger state changes. • Parallel tasks can be represented with concurrent states in the state chart.
• Control of the behavior of the application can be based on the current task(s), since all of the active tasks (states) are known.
3.2.1
The State Chart Interface
The state chart implementation follows that of UML state chart notation, a variation of Harel state charts. With modularity and loose coupling in mind, the implementation of the state chart module is hidden behind a series of interfaces that are used by the rest of the scenario simulator module.
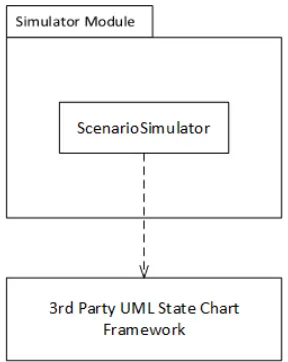
The motivation behind this design decision is the dependency inversion principle (DIP) [28], which states that high level modules such as the scenario simulator module should not depend on low level modules such as the UML state chart module. Both modules should de-pend upon abstractions. Figure 3.2 illustrates a typical architecture where a high level module such as the scenario simulator module will depend on a low level module, such as the third party UML state chart framework.
To conform to the DIP, one simply has to invert the dependency of the low level module on the high level module; this is done by creating an abstraction layer in the high level module, which the high level module’s components will depend on. Next, a wrapper module or middle man module is developed outside of the high level module, which will depend on both the ab-straction layer and the low level module. The wrapper module will implement the abab-stractions from the high level module and use the low level module to implement the abstractions. Refer to figure 3.3 for the architecture after applying these changes.
Keeping this principle in mind, allows the scenario simulator module to switch out state chart implementations or make changes to the state chart implementation with ease. Figure 3.4 illustrates the interfaces between the state chart module and the scenario simulator module.
3.2.2
The UML State Chart Module
Figure 3.2: A typical architecture between high level modules and low level modules before DIP.
state chart behaviour of the third party framework. TheUmlStateChartEventclass implements theIStateChartEventinterface and wraps around theStateChartEventclass from the third party framework. Lastly, theUmlStateChartBuilder class implements theIStateChartBuilder inter-face and is responsible for creating the state chart from the scenario. Refer to figure 3.5 for an illustration of the module.
3.2.3
Hierarchical Task Definition to State Chart
The state chart building algorithm takes in a scenario definition, which contains the following: a task hierarchy, which is in the form of a generic tree structure, with a task as the data type and complications, which is a generic collection of complication objects. The algorithm will produce a state chart based on the task hierarchy and the complications. The algorithm is designed around a depth-first approach, where the algorithm will recursively crawl down the hierarchy until it finds a leaf node, or simple task, and creates it. The steps below outline the algorithm:
1. Create the state chart structure based on the root task node in the hierarchical task defi-nition.
2. Assign the name and other properties of the task to the state chart object.
3. For each child task of the root task, create a new state for that task.
4. Check if the given task has children, if it does, create a hierarchical state to represent the task; if it does not have children skip to step 6.
5. For each child of the task, go to step 4 with that given task.
3.2. TheStateChartModule 29
Figure 3.3: The architecture after inverting the dependency.
7. Assign the properties to the state and add it to the parent hierarchical state.
The following C-Sharp code snippet is from the build method in theUmlStateChartBuilder
class:
public IStateChartEngine Build ( Scenario scenario ) {
string name = scenario . Task . Value . Name ; StateChart stateChart = new StateChart (name );
List < TreeNode <Task >> childrenNodes = scenario . Task. children ;
// Add each child state .
foreach ( TreeNode <Task > taskNode in childrenNodes ) AddState ( taskNode , stateChart );
// Add start state node and history node to state chart .
PseudoState startState = new PseudoState (string. Format ("{0} Start ", stateChart ), stateChart , PseudoStateType . Start );
string startTaskName = childrenNodes . First (). Value . Name;
Transition historyTransition = new Transition ( startState , states [ startTaskName ]); states .Add( scenario . Task . Value .Name , stateChart );
// Add all the transitions to the statechart .
foreach ( TaskTransition transition in scenario . TaskTransitions )
new Transition ( states [ transition . Source ],
states [ transition . Destination ], new StateChartEvent ( transition . EventId ));
// Add complications to the state chart .
Figure 3.4: A class diagram of the state chart interface.
return new UmlStateChartEngine ( stateChart ); }
The next method is the add state method, which will recursively add the tasks as states in the state chart:
private void AddState (TreeNode <Task > taskNode , Context parent ) {
string name = taskNode . Value . Name ;
// If it is a final task , add it as a final state .
if ( taskNode . Value . Final ) {
FinalState state = new FinalState (name , parent ); states .Add(name , state );
return; }
List < TreeNode <Task >> childNodes = taskNode . children ;
// Check if there are children .
if ( childNodes . Count > 0) {
// Create a hierarchical state , since this task has children .
HierarchicalState state = new HierarchicalState (name , parent , null, null);
// Recursively add the child tasks .
foreach ( TreeNode <Task > childNode in childNodes ) AddState ( childNode , state );
// Add the history and start state nodes for the hierarchical task.
PseudoState historyState = new PseudoState ( state .Name + " History ", state , PseudoStateType . History );
3.2. TheStateChartModule 31
Figure 3.5: The UML state chart wrapper module.
string startTaskName = childNodes .First < TreeNode <Task > >(). Value . Name; Transition startTransition = new Transition ( startState , historyState );
Transition historyTransition = new Transition ( historyState , states [ startTaskName ]); states .Add(name , state );
AddActions ( state ); }
else
{
// Add a simple state , since this task did not have children .
State state = new State (name , parent , null, null); states .Add(name , state );
AddActions ( state ); }
}
private void AddComplications ( IEnumerable < Complication > collection ) {
foreach( Complication complication in collection ) AddComplicationActions ( complication );
}
protected virtual void AddComplicationActions ( Complication complication ) {
if (!( complication is TaskDependantComplication ))
return;
TaskDependantComplication c = ( TaskDependantComplication ) complication ;
if (c. Entry )
states [c. TaskName ]. EntryAction = new EnactComplicationAction (repo , c.Id);
else
states [c. TaskName ]. ExitAction = new EnactComplicationAction (repo , c.Id); }
3.3
Simulator Module Interface
The scenario simulator and data acquisition module contains a single boundary interface to client applications, IScenarioSimulator. This interface is responsible for providing a means for client applications to interact with the simulation module. The main functionality that the interface provides is the following:
• Adding a simulator component to customize the moduleâ ˘A ´Zs behavior. • Adding an enactor to provide custom feedback for complication events. • Starting the simulation.
• Submitting a scenario event to the module.
Please refer to figure 3.6 for the definition of theIScenarioSimulator interface. The decision to place all of the functionality of the module into a single interface was made to provide the developers of the third party application with one single and easy-to-use interface. This will result in a developer only needing to become familiar with one main interface, instead of having to learn many interfaces. The interface at this point is still rather slim, so it does not violate the interface segregation principle, the ’I’ in the SOLID software design principles.[28] As the interface continues to grow, it would be in the best interest to find related functionalities to break into separate interfaces.
3.4
Scenario Events
3.5. ScenarioSimulator 33
Figure 3.6: The IScenarioSimulator interface.
• Timestamp: When the event occurred. • Name: The name of the event.
• Id: the unique identifier of the event.
• Description: A more detailed description of the event.
• Parameters: A collection of parameters (their name and value) that represent the data of the event. These would be similar to event arguments.
When the scenario event comes through the boundary interface to the simulator object, it is sent to the state chart component for processing. The event is then sent to all of the simulator components that are registered in the module; these components are mentioned later in section 3.6. These events act as a road map of the scenario. If one would go through each event that is submitted to the module, they would know exactly what the user did each step of the way.
3.5
Scenario Simulator
TheScenarioSimulator is the class that implements theIScenarioSimulator interface; it is the component that orchestrates the logic of the simulator module. It acts as a container for the sim-ulator components, which are described in detail in section 3.6. The scenario simsim-ulator class began as a class contained many responsibilities and only delegated a select few to other com-ponents; it handled much of the functionality of the module. Such responsibilities included:
• Orchestrating all of the module’s logic. • Directly calling the logging of the events. • Directly calling collection of scenario events.
Figure 3.7: The IScenarioSimulator interface.
• Compilation and writing of result files.
The scenario simulator class was refactored over time based on the single responsibility principle [28] to reduce the number of reasons the class had to change. Now delegates all of the previous functionality to simulator components that implement theISimulationComponent
interface. This refactoring was successful by incorporating the strategy design pattern [28, 17]. These components will handle all custom behavior of the simulator such as:
• Collection and saving of scenario events submitted to the simulator. • Tracking the time spent in each task.
• Logging of scenario events to a log file.
The scenario simulator contains a reference to a simulator component repository that is re-sponsible for managing the storage of components. Now with all of the functionality delegated to simulator component concrete implementations through a layer of abstraction, the scenario simulator object is oblivious to the implementation details of itself. To include the function-ality, the simulator simply has to forward a submitted event to all of its components as shown below.
public virtual void SubmitSimulatorEvent ( ScenarioEvent e) {
if (! IsActive )