Contaminants by Magnetic Particles
Stephen W. Bigger1*, Lawrence N. Ngeh2, John D. Orbell21 School of Engineering and Science
Faculty of Health, Engineering and Science
2 Institute for Sustainability and Innovation
Victoria University
PO Box 14428, Melbourne, 8001, Australia.
Synopsis
A mathematical model is developed and implemented to characterize the pick-up of various liquid chemical contaminants by polyethylene-coated magnetic particles. The model and its associated experimental and analytical protocols were applied to a wide range of liquid chemicals in order to gain insights into the physical basis for the pick-up phenomenon. The characteristics of the pick-pick-up isotherms range between "ideal" and "non-ideal" behavior that are reflected in the mathematical model by a single parameter, α0, where α0 = 1 corresponds to ideal behavior and α0 > 1 corresponds to
a departure from idealized behavior that is directly quantified by the magnitude of α0.
The parameter α0 is also related to the efficiency of pick-up and since the vast
majority of isotherms observed in the study deviate from ideality, the high efficiency of pick-up observed in these systems has been attributed in part to this deviation. The proposed model and its associated experimental and analytical protocols demonstrate great potential for the systematic evaluation of the uptake of chemical contaminants using magnetic particle technology.
Key Words
iron powder; chemical contaminants; magnetic particles; oil
Introduction
The application of magnetic particle technology to environmental remediation has attracted much interest in the literature over the years. Examples of this include the “Sirofloc” process for water clarification and decolourisation (Anderson et al. 1983; Priestly 1990; Booker et al. 1991) and functional magnetic particles that are used in the removal of pesticides from water (Lawruk et al. 1993). Magnetic particles have also been used in areas such as the magnetic separation of cancer cells (Wang et al., 1993), in diagnosis (Nakamura and Matsunaga 1993), separation of radioactive materials (Nunez et al. 1996) and as catalyst supports (Wang et al. 2000).
It has also been found that polymer-coated magnetic particles can remove up to 90% of a standard grade of engine oil (Orbell et al. 1997) and that particles of uncoated iron powder are almost 100% effective in the magnetic harvesting of various
contaminants (Orbell et al. 1999). Magnetite and maghemite particles have also been reported to exhibit high removal efficiency for dispersants and oils (Chun and Park 2001).
A sequence of detailed studies on iron powder as an efficient medium for the
magnetic removal of oil contamination in environmental applications has appeared in the literature. These include: its use to remove contamination from oiled feathers (Orbell et al. 2004; Dao et al. 2006a), studies on the acute temperature dependence and thermodynamics of the pick-up process (Orbell et al. 2005; Dao et al. 2006b), the effect of pre-conditioners used in conjunction with iron powder for the removal of tarry and weathered oil (Dao et al. 2006c; Orbell et al. 2007) and its potential use to remove oil contamination from the surface of rock (Orbell et al. 2007).
Rc) whose respective coordinates correspond to the critical values of P and R at which the plateau is attained. Through observations made on many different systems it has been found that the approach to the plateau sometimes exhibits "ideal" behavior in that the pick-up isotherm is almost linear. An example is the pick-up of triethylamine with polyethylene-coated magnetic particles that demonstrates an almost linear relationship between the P and R parameters up to the plateau (Ngeh 2002). On the other hand, the isotherm for the pick-up of bromobenzene with the same type of particles demonstrates a significant departure from linearity and, as such, can be classified as an example of a “non-ideal” system (Ngeh 2002). Other variations in the behavior of the isotherm have been observed such as the high rate of approach to the plateau exhibited in the case of the pick-up of iodobenzene by polyethylene-coated magnetic particles (Ngeh 2002).
In order to better understand the physical basis for the pick-up phenomenon a physical model together with the accompanying mathematical description was developed to fit the full range of experimental data obtained. The model is described in this paper and its applicability to a number of different systems of wide variability is demonstrated.
Theory
In an "ideal" system each particle picks up a fixed quantity of chemical, and so upon the addition of successive particles, a linear increase is expected in the total amount of chemical that is picked up. Under these conditions the value of P is expected to vary linearly with R up to the critical or "saturation" value Pc, whose corresponding value of R is denoted Rc. The saturated region where no more chemical can be adsorbed occurs at values of R ≥ Rc.
value Pc. Hence a convex curvature of the isotherm compared with the ideal case is observed. Again, values of R ≥ Rc define the saturated region.
The adsorption of a chemical on magnetic particles such as iron particulates or
polymer-coated magnetic particles can be mathematically modeled by considering the amount of chemical each particle can adsorb in the presence of other particles. Now, the particle-to-chemical ratio, R, is given by equation (1):
R = nm1/m2 (1)
where n is the number of particles, m1 is the average mass of one particle, and m2 is the mass of chemical used in the experiment (Orbell et al. 1997). At the critical particle-to-chemical ratio, Rc, equation (2) applies:
Rc = ncm1/m2 (2)
where nc is the critical number of particles that are responsible for the critical (maximum) percentage adsorption, Pc. The average mass of chemical, ms, that is adsorbed by a single particle can be calculated from equation (3):
ms = Pcm2/(100nc) (3)
Substituting equation (2) in equation (3) yields an expression for ms in terms of values Pc, m1 and Rc that are convenient to determine experimentally:
ms = Pcm1/(100Rc) (4)
P(n) = (nms/m2) × 100 (5)
Under these conditions the value of P(n) varies linearly with n up to the critical value Pc that corresponds to nc. Using equations (1), (4) and (5), the simple function P(R) can be confirmed for values of R in the range 0 ≤ R ≤ Rc:
P(R) = RPc/Rc (6)
In many real systems, the viscous nature of the liquid chemical to be adsorbed as well as the complex surface interactions between the liquid and the particles means that disproportionately larger amounts of the liquid adhere to the particles at lower values of R compared with values of R close to Rc. Alternatively, it is possible that for organic compounds at low values of R, the particles can absorb the maximum amount of the compound, but at high values of R, some organic molecules can interact with two or more particles resulting in the observed deviation of the plot from the straight line. Clearly, the possible interaction with two or more particles is related to the chemical nature of the contaminant. If the contaminant is an organic compound it is anticipated that it would need to have two or more functional groups to interact simultaneously with several particles.
The capacity of the particles to adsorb an excess loading of chemical in the early stages of the adsorption isotherm can be modeled by introducing a parameter α(n) which is the fractional excess of chemical a particle can adsorb in the presence of n particles. The value of α(n) may be generated by an empirical function and depends on the number of particles present at any point in the adsorption process. In "non-ideal" cases, the percentage adsorption, P(n), is thus given by equation (7):
P(n) = (Mn/m2) × 100 (7)
where Mn is the mass of chemical adsorbed by n particles in a "non-ideal" system. The value of Mn may be related to α(n) as shown in equation (8) and can be
Mn = Mn-1 + Ms(n)α(n) (8)
where M0 is zero, Mn-1 is the mass of chemical adsorbed by n – 1 particles, and Ms(n) is the average mass of chemical adsorbed by the nth particle in the presence of n – 1 particles which is iteratively adjusted to account for disproportionate adsorption. In particular:
Ms(n) = [(Pcm2/100) – Mn-1]/(nc – n) where M0 = 0 (9)
A satisfactory fit of the experimental data can be obtained by assuming that the empirical function, α(n) varies linearly with n, and that the boundary conditions of (α, n) are (α0, 1) and (1, nc). Under these conditions equation (10) can be readily
derived:
α(n) = α0 + (α0 – 1)(n – 1)/(1 – nc) (10)
An optimum value of α0 necessary to fit a given set of experimental data can be found
by minimizing the sum of the squares of the residuals, s(α0), in accordance with
equation (11):
n
s(α0) =
Σ
[P(R
i, α0) – P(Ri)]2 (11) i=1where P(Ri, α0) is the theoretical value of P(Ri) calculated for a particular value of
α0 and P(Ri) is the experimental value of the percentage adsorption determined at the
Materials and Methods
Polyethylene (PE) powder (grade 4612-05A) was obtained from Courtney Polymers Ltd., Dandenong, Australia. Steel "isoshot" pellets (grade S330, average particle size 1.0 mm) were kindly provided by Barton Abrasive Ltd., West Midlands, United Kingdom. All chemicals used in the experiments were AR grade reagents obtained from Aldrich Chemical Company Inc., Castle Hill, Australia.
The manufacture of PE-coated "isoshot" magnetic particles was conducted using a procedure involving the high-temperature heating of the pellets in a muffle furnace at 650°C and subsequent scattering of the particles in a fluidized bed of the polymer. The procedure is described elsewhere in detail (Orbell et al. 1997; Ngeh 2002) and it produces mechanically stable particles of average diameter ca. 1.2 ± 0.2 mm. Two hundred PE-coated particles were weighed and the average mass for a single particle was found to be 0.0820 g.
The chemical pick-up experiments were performed gravimetrically (Orbell et al. 1997; Ngeh 2002) at 20°C using a fixed mass (1.00 g) of chemical that was placed in a pre-weighed (w1) Petri dish, which was then re-weighed (w2). The PE-coated particles were applied to the chemical and the Petri dish was again re-weighed (w3). The particle/chemical mixture was left in the Petri dish for 5 min after which the chemical-laden particles were harvested magnetically using a laboratory magnetic tester (Alpha Magnetics, Victoria, Australia). The Petri dish was then re-weighed (w4). These measurements enable experimental values of R and P to be calculated from equations (12) and (13) respectively (Orbell et al. 1997; Ngeh 2002):
R = (w3 – w2)/(w2 – w1) (12)
The procedure was repeated in batches for increasing values of R until a maximum value of P was achieved (i.e. Pc), for a maximum value of Rc. The above procedure was carried out with five replicates in all subsequent experiments.
The experimental P and R data obtained for the affinity of a chemical compound for the magnetic particles were entered into an original computer program that was specifically written to analyze the data. The program determines the value of α0
associated with the optimum fit to the experimental data.
Results and Discussion
Fitting Experimental Data to Theoretical Model
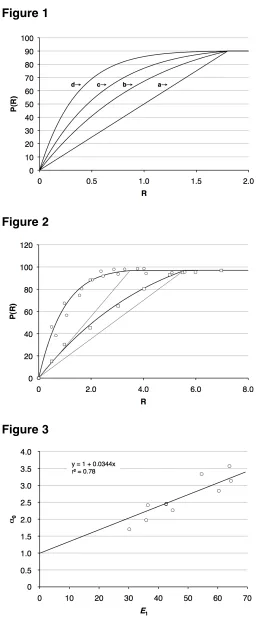
The derived mathematical model that is depicted by equation (1) together with equations (7) to (10) were used within an iterative computer program that generated the theoretical curves P(R) for given values of the adjustable parameter, α0. These
plots appear in Fig. 1 and show that for an ideal system where α0 = 1, a linear
relationship between P(R) and R is established as expected. However, for non-ideal systems where α0 > 1, there is an increase in the curvature of the isotherm as the
value of α0 increases. Thus when α0 = 1, idealized adsorption occurs and values of
α0 that are successively greater than unity indicate successively greater departure
from idealized adsorption behaviour.
>>> Insert Figure 1
Shown in Fig. 2 are experimental data for the pick-up of triethylamine and m-dichlorobenzene at 20°C using PE-coated magnetic particles. In each case the data were fitted using the iterative computer program and the solid lines represent the computer-generated optimum fits to the data. The triethylamine data (α0 = 1.70 in
stages of the triethylamine isotherm each particle picks up nearly the same amount of chemical resulting in an almost linear increase of the isotherm. On the other hand, the m-dichlorobenzene (α0 = 3.57 in Table 1) data show a marked departure from
linearity and so this system can be classified as non-ideal. For m-dichlorobenzene in the initial stages of the isotherm, excess compound is picked up by particles resulting in a convex curvature of the isotherm. In the later stages, both the triethylamine and m-dichlorobenzene isotherms appear to plateau. This is due to the ultimate saturation of the particles by the compounds.
>>> Insert Figure 2
Other compounds show a varying degree of departure from ideality as reflected by their values of α0. The computer fitting procedure was applied to the experimental
data collected for a variety of compounds. Values of α0 for these compounds are
listed in Table 1.
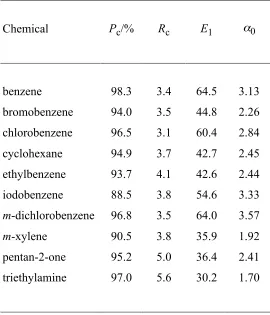
>>> Insert Table 1
Efficiency of Chemical Pick-Up
The data analysis can be extended to determine the efficiency of a given system for the pick-up of a chemical contaminant. This can be achieved using either of two approaches. The first method involves using an efficiency parameter, E1, which may be defined as the initial gradient of the pick-up isotherm, (dP/dR)0, an approximation for which is given in equation (14):
E1 = (dP/dR)0 ≈ (ΔP/ΔR) ≈ P1/R1 (14)
The second method involves mathematically deriving the initial gradient of the adsorption isotherm that represents the theoretical amount of chemical picked up by one infinitesimally small particle. Equation (15) can be derived from equations (8), (9) and (10):
dMn/dn = Msα0/(1 – nc) – αPcM2ln(nc – n)/100 + αMn-1ln(nc – n) (15)
For n = 1, M0 = 0, Ms = PcM2/[100(nc – 1)], α = α0 and so:
(dMn/dn)n=1 = [α0PcM2/100)[1/(nc – 1) + ln(nc – 1)] (16)
Since nc >> 1 then equation (17) applies:
(dMn/dn)n=1≈α0PcM2ln(nc)/100 (17)
Thus equation (17) suggests that the initial gradient of the adsorption isotherm is proportional to α0 and so α0 is related to the adsorption efficiency.
Upon consideration of both the efficiency of pick-up and the extent to which a system behaves ideally, it is clear that a given system can be classified according to one of the following four types: (i) high efficiency and ideal, (ii) high efficiency and non-ideal, (iii) low efficiency and non-ideal, and (iv) low efficiency and non-ideal. From the range of chemical/polymer systems examined in the present study, the lowest value of Rc that was determined is ca. 3.0. Given that the maximum theoretical value of Pc is 100%, an average value of the efficiency parameter E1 for all of these systems is thus estimated E1(av) ≈ Pc/Rc = 33.3. On this basis a distinction can be made between "high efficiency and ideal" and "low efficiency and ideal" classifications at E1≈ 33. Similarly, the maximum observed value of α0 is ca. 3 and so it is reasonable to
propose that for many systems α0 values typically lie in the following range: 1 ≤ α0 ≤
systems listed in Table 1 suggest that these systems belong mainly to the "high efficiency and ideal" or "high efficiency and non-ideal" classifications.
Shown in Fig. 3 is a plot of α0 versus the efficiency parameter E1 that pertains to the
systems given in Table 1. The reasonable degree of linearity of this plot together with its vertical axis intercept close to unity confirms that the α0 parameter is directly
related to the efficiency of pick-up as indicated by equation (17). Moreover, the correspondence between the two variables is consistent with the notion that the high efficiency pick-up systems tend to be those that exhibit a more significant departure from ideality as reflected by their values of the α0 parameter. As the outlying data in
Fig. 3 tend to belong predominantly to non-ideal systems, a departure from linearity would therefore be expected for systems where α0 >> 3. Under these conditions E1
would be expected to be a less reliable estimate of the overall efficiency of pick-up of the system.
>>> Insert Figure 3
It is expected that the pick-up characteristics of the systems will be primarily
dependent on both the viscosity (η) and the surface tension (γ) of the liquid chemical as well as the extent of interaction between the chemical and substrate, and the particle size distribution and/or surface area. Although the dependency of α0 on η
and α0 on γ (data given in Table 1) each shows an overall upward trend with a low
Conclusions
A mathematical model has been successfully developed and implemented using a computer program in order to characterize the pick-up of various liquid chemical contaminants by polymer-coated magnetic particles. Using the model it has been demonstrated that the characteristics of the pick-up isotherms range between two extremes, represented by "ideal" and "non-ideal" behavior. A further dimension to each of these classifications is the efficiency with which a given chemical is picked-up with a given magnetic particle system. The efficiency can be defined as the initial gradient of the pick-up isotherm that, in turn, is shown to be proportional to the α0
parameter. The use of a wide range of different chemicals has revealed that nearly all of the isotherms deviate from the ideal case and that PE-coated magnetic particles are highly efficient in the pick-up of these chemicals. The observed high efficiency of pick-up can be attributed in part to the departure from ideality that these systems exhibit.
Acknowledgement
The authors are grateful to Mrs. Elizabeth Bigger for her assistance with some of the computer calculations in this work.
References
Anderson, N. J., and Priestley, A. J. (1983). "Colour and turbidity removal with reusable magnetic particles - V." Water Resour., 17(10), 1227-1233.
Booker, N. A., Keir, D., Priestley, A. J., Ritchie, C. B., Sudarmana, D. L., and Woods, M. A. (1991). "Sewage clarification with magnetite particles." Water Sci. Technol., 23, 1703 -1712.
Chun, C. L., and Park, J. W. (2001). "Oil spill remediation using magnetic separation.” J. Envir. Eng., 127(5), 443-449.
Dao, H. V., Ngeh, L. N., Bigger, S. W., and Orbell, J. D. (2006a). "The achievement of 100% removal of oil from feathers employing magnetic particle technology." J. Env. Eng., 132, 555-559.
Dao, H. V., Ngeh, L. N., Bigger, S. W., Orbell, J. D., Healy, M., Jessop, R., and Dann, P. (2006c). "Magnetic cleansing of weathered/tarry oiled feathers – the role of pre-conditioners." Marine Poll. Bull., 52, 1591-1594.
Dean, J. A., Ed. (1992). "Lange’s handbook of chemistry." 14th edition, McGraw-Hill Inc., New York, USA.
Lawruk, T. S., Lachman, C. E., Jourdan, S. W., Fleeker, J. R., Herzog, D. P., and Rubio, F. M. (1993). "Determination of metolachlor in water and soil by a rapid magnetic particle-based ELISA." J. Agric. Food Chem., 41 (9), 1426-1431.
Nakamura N., and Matsunaga, T. (1993). "Highly sensitive detection of allergen using bacterial magnetic particles." Anal. Chim. Acta, 281(3), 585-598.
Ngeh, L. N. (2002). "The development of magnetic particle technology for application to environmental remediation." PhD Thesis, Victoria University, Melbourne, Australia.
Nunez, L., Buchholz, M., Kaminski, M., Aase, S. B., Brown, N. R., and Vandegrift, G. F. (1996). "Actinide separation of high-level waste using solvent extractions on magnetic microparticles." Sep. Sci. Technol., 31(10), 1393-1407.
Orbell, J.D., Godhino, L., Bigger, S. W., Nguyen, T. M., and Ngeh, L. N. (1997). "Oil spill remediation using magnetic particles – an experiment in environmental technology." J. Chem. Educ., 74, 1446-1448.
Orbell, J. D., Tan, E. K., Coutts, M., Bigger, S. W., and Ngeh, L. N. (1999). "Cleansing oiled feathers – magnetically." Marine Poll. Bull., 38, 219-221.
Orbell, J. D., Ngeh, L. N., Bigger, S. W., Zabinskas, M., Zheng, M., Healy, M., Jessop, R., and Dann, P. (2004). "Whole-bird models for the magnetic cleansing of oiled feathers." Marine Poll. Bull., 48, 336-340.
Orbell, J. D., Dao, H. V., Ngeh, L. N., Bigger, S. W., Healy, M., Jessop, R., and Dann, P. (2005). "Acute temperature dependency in the cleansing of tarry feathers utilizing magnetic particles." Environ. Chem. Lett., 3, 25-27.
Orbell, J. D., Dao, H. V., Ngeh, L. N., and Bigger, S. W. (2007a). "Magnetic particle technology in environmental remediation and wildlife rehabilitation."
Environmentalist, 27, 175-192.
Orbell, J. D., Dao, H. V., Kapadia, J., Ngeh, L. N., Bigger, S. W., Healy, M., Jessop, R., and Dann, P. (2007b). "An investigation into the removal of oil from rock utilizing magnetic particle technology." Marine Poll. Bull., 54, 1958-1961.
Wang, S. Y., Makl, K. L., Chen, L. Y., Tzeng, C. H., Hu, C. P., and Chang, C. M. (1993). "Elimination of malignant tumor cells from human bone marrow using monoclonal antibodies and immunomagnetic beads." Anticancer Res., 13 (6A), 2281-2285.
Wang L., Feng, L. X., and Xie, T. (2000). "Novel magnetic polyethylene
nanocomposites produced by supported nanometer magnetic Ziegler-Natta catalyst." Polym. Int., 49(2), 184-188.
Table 1. Experimentally determined values of the parameters Pc, Rc, E1 = (dP/dR)0 and α0 for the pick up of a range of chemicals with PE-coated magnetic particles
together with corresponding values of the viscosity, η, and surface tension, γ, of the chemicals.
Chemical Pc/% Rc E1 α0
Glossary of Symbols
α(n) fractional excess of chemical that a magnetic particle can adsorb in the presence of n particles
α0 boundary value of the parameter α(n) corresponding to the theoretical
case where n = 0; magnitude of α0 quantifies extent to which a given
system deviates from ideal case for which α0 = 1
E1 arbitrarily defined efficiency of pick-up parameter
m1 average mass (g) of one magnetic particle
m2 mass (g) of chemical contaminant
Mn mass (g) of chemical adsorbed by n particles in a "non-ideal" system
Mn-1 mass of chemical contaminant adsorbed by n – 1 particles
ms average mass of chemical adsorbed by a single magnetic particle
Ms(n) average mass of chemical contaminant adsorbed by the nth particle in presence of n – 1 particles, iteratively adjusted to account for
disproportionate adsorption
n number of magnetic particles
nc critical number of particles responsible for critical (maximum) percentage adsorption, Pc
P percentage (w/w%) of chemical harvested by magnetic particles
P(n) percentage adsorption after addition of n particles where 0 ≤ n ≤ nc
P(Ri, α0) theoretical value of P(Ri) calculated for a particular value of α0
P(Ri) experimental value of the percentage adsorption determined at the particle-to-chemical ratio, Ri
P1 initial value of P on the experimental pick-up isotherm
Pc critical value of P at which a plateau commences on the P versus R plot
R1 initial value of R on the experimental pick-up isotherm
Rc critical value of R at which a plateau commences on the P versus R plot
Figure Captions
Figure 1 Computer-generated theoretical isotherms for the sequestering of chemical contaminants by magnetic particles in accordance with the model depicted by equations (1) and (7) to (10) for Pc = 90.0%, Rc = 1.8, m1 = 0.005 g and m2 = 0.5 g. Values of α0 are: (a) 1.00, (b) 2.0, (c) 3.0
and (d) 5.0.
Figure 2 Isothermal pick-up at 20.0°C of 1.00 g of: (i) triethylamine (open squares, Pc = 97.0%, Rc = 5.6, α0 = 1.70) and (ii) m-dichlorobenzene (open circles,
Pc = 96.8%, Rc = 3.5, α0 = 3.57) using PE-coated magnetic particles with
average particle mass of 0.0820 g. The solid curves are the computer-generated fit to the experimental data. The oblique straight lines represent the ideal isotherms in each case.
Figure 3 Plot of α0 versus the efficiency parameter E1 = (dP/dR)0 derived from the
Figure 1
Figure 2