Article
A Systems Analysis Approach to Identifying Critical
Success Factors in Drinking Water Source Protection
Programs
Hew Cameron Merrett 1, Wei Tong Chen 2* and Jao Jia Horng 3,
1 Graduate School of Engineering Science and Technology, National Yunlin University of Science and Technology, Taiwan; [email protected]
2 Graduate School of Engineering Science and Technology / Department of Civil and Construction Engineering, National Yunlin University of Science and Technology, Taiwan; [email protected] 3 Graduate School of Environmental, Health and Safety Engineering, National Yunlin University of Science
and Technology, Taiwan; [email protected]
* Correspondence: [email protected]; Tel.: +886-938-358-816
Abstract: The success of source protection in ensuring safe drinking water is centered around being able to understand the hazards present in the catchment then plan and implement control measures to manage water quality risk to levels which can be controlled through downstream barriers. The programs in place to manage source protection are complex sociotechnical systems involving policy, standards, regulators, technology, human factors and so on. This study uses System Theoretic Process Analysis (STPA) to analyze the operational hazards of a typical drinking water source protection (DWSP) program and identify control measures to ensure safe operations. To validate the results a questionnaire was developed and distributed to specialists in DWSP in Taiwan, Australia and Greece. Using Principle Components Analysis (PCA) of the questionnaire responses, the study identified four critical success factors (CSFs) for DWSP. The four factors identified are ‘Policy and Government Agency Support of Source Protection’, ‘Catchment Risk Monitoring and Information’, ‘Support of Operational Field Activities’ and ‘Response to Water Quality Threats’. The results of this study provide insight into the approach of grouping of source protection measures to identify a series of targeted CSF for operational source protection programs. Using CSF can aide catchment management agencies in ensuring that the risk level in the catchment is managed effectively and that threats to public health from drinking water are managed appropriately.
Keywords: Drinking Water Source Protection; Drinking Water Safety; System Theoretic Process Analysis; Principle Components Analysis; Hazard Analysis.
1. Introduction
1.1. Role of Source Protection in Safe Drinking Water Supply
The multi barrier approach to drinking water safety which includes source water protection is recognized internationally as best practice and is advocated for in many national drinking water frameworks and relevant legislation. In most drinking water schemes catchment management and source protection are the first barriers in the supply of safe drinking water [1,2]. A well-developed and implemented source protection program can not only help ensure safe drinking water, but effective source protection can be an economical way of offsetting water treatment costs through capitalizing on ecosystem services to control water quality [3].
For drinking water catchments, two of the most common threats considered in source protection is the potential public health impacts from contaminated water and the potential to compromise downstream processes from water quality parameters that defects the process’ ability to operate as required for safe drinking water production. Protection of drinking water catchments provides key services in the supply of safe drinking water through reducing the number of pathogens and organic
matter entering downstream treatment facilities. From a system wide perspective, controlling pathogens reduces acute enteric risks, and controlling organic matter reducing unwanted by-products form during treatment and disinfection [4].
The success of source protection in ensuring safe drinking water is centered around being able to understand the hazards present in the catchment then plan and implement control measures to manage water quality risk to levels which can be controlled through downstream barriers. Investigations of contributory factors of public disease outbreaks due to drinking water contamination show that common factors related to source protection include inadequate knowledge of source water hazards, fecal contamination from live stock or wildlife as well as extreme weather [5]. In most cases drinking water contamination incidents experienced can be attributed to multiple causes [6]. Drinking water catchments are complex systems, subject to continual dynamic changes resulting from environmental fluctuations over time, impacts of interactions of multiple agencies and stakeholders in the catchment area as well the actions of drinking water management agencies. The nature of complex systems is that they are inherently hazardous and require defenses to guard against failure [7]. When these guards in complex system such as source protection programs and drinking water, systems fail there is potential for significant loss through public illness and potential death.
A well-known example of the result of waterborne disease outbreak is the Walkerton, Canada tragedy in 2000. As the result of drinking water being contaminated with Escherichia coli 0157:H7 and Campylobacter jejuni, 2,300 people experienced gastroenteritis, 65 were hospitalized and 7 died. Detailed investigations of the incident discovered the cause was a multiplicity of failures consistent with other outbreaks experienced in the developed world that went unresolved [8]. In the case of Walkerton investigations, while a lot of attention was focused on the role of the water service providers responsible for operating the water supply, there were several other latent systemic failures in the drinking water supply system. From a source protection perspective there were some key failings, a good example is the government policy and regulation at the time. The government policy and regulation controls in place failed to prevent farming practices from contaminating bores which were known to be vulnerable to contamination from surface activities [9].
For safe drinking water supply the World Health Organization (WHO) advocates for a catchment to consumer approach to risk management that includes all steps in the drinking water supply process [10]. Use of risk-based approaches in the supply of drinking water systems is well established in the water industry. Risk based approaches enable the management focus to be on the greatest threats to drinking water quality and public health. For source protection there is limited literature and research on the management of the complex operational risk in the implementation of source protection programs.
1.2 Source Protection Programs
Understanding the risks present in a drinking-water supply requires a detailed and documented hazard assessment, that considers factors such as system performance, controls in place, assumptions made, data used etc. Hazard assessment outcomes are typically summarized in documents such as water safety plans, catchment management strategies and other operational management plans. Such operational documentation should provide a detailed description of the operations undertaken and the procedures that guide them to ensure safe drinking water [1].
area and controlling them before impact occurs reduces the overall chemical risk to drinking water quality.
The preventative approach to controlling drinking water risk has been in practice in the water industry for many years. To ensure drinking water safety, management focus should be placed on the performance of the entire system including protection of water sources, appropriate treatment, disinfection, and distribution management. Developing an effective source protection strategy is contingent upon having a good understanding of the characteristics of the catchment and the downstream water quality barrier characteristics. In drinking water systems, the term hazards is typically used to refer to the are biological, chemical, physical or radiological agents with the potential to result in public illness or result in water quality which is unacceptable for consumers [11]. When developing a whole of system water safety planning approach, the process of hazard identification should extend beyond the direct inputs driving the microbial and chemical parameters and examine the threats to the proper functioning of the system components [10]. For this study the focus is on the hazards to the proper functioning of the operational program to implement source protection measures for the protection of public health.
The ecosystem services and water quality management infrastructure that influence the drinking water quality outcomes in catchment areas require continuous monitoring and verification of performance against required levels of service to ensure that water quality objectives are met [14]. Whereas conventional water treatment process has a certainty of outcome and can be assessed readily with conventional based hazard analysis techniques, when it comes to source protections and catchment conventional hazard analysis techniques have limited applicability. Numerous methods are frequently employed to evaluate the hazards involved in the operation of complex systems. Many of these component failure-based methods such as Hazard and Operability Analysis, Failure Modes Effect Analysis, Bowtie Analysis and Fault Tree Analysis are used to identify hazards in the assessment of drinking water systems [12]. Managing Catchments as a water treatment asset poses a set of unique challenges compared to conventional water supply infrastructure. Conventional hazard analysis methods focus on reducing the components of larger system to an “assembly” of individual components. This use of analytical reduction and potentially overlook hazards resulting from the component interactions [13]. Rasmussen [15] proposed that risk management should be approached as a control problem which requires a system orientated approach using functional abstraction. The complex sociotechnical structures of source protection systems rely heavily on safe interaction of system components to ensure overall system safety. A key example is the complexity resulting for multiple ownership of land and multiple land managers both private land owners and government agencies. The resulting challenge with managing drinking water catchments as a water treatment asset is that often a large portion of the catchment area is not under water utility ownership [16]. Furthermore, many of the risk control actions are undertaken by organizations not under the control of the water utility. The effective control of activities in catchment areas requires targeted multifaceted programs involving the various agencies which engage landholders and other catchment users in achieving a common outcome. Often there is lack of clarity and confusion around the roles of water utilities and different regulatory agencies in drinking water catchments [17]. The complexity of source protection operations requires hazard analysis methods which can understand both the component interactions as well as the implications of the complex organizational arrangements between agencies involved in natural resource management in catchments.
1.4 Need for Further Research
drinking water, source protection processes in the water industry need to adapt and evolve to meet the growing sophistication of drinking water standards such as the HBT requirements set out the ADWG. Such an evolution requires new innovative ways to analyze the operational risks of source protection programs to ensure the catchment risk control measures are performing as expected.
The operational risk for drinking water supplies typically is centered around the reliability of system components such as the failure of a specific treatment step [19]. The belief that reliability is equal to safety is common throughout the engineering field [20]. In the case of drinking water source protection (DWSP), the assumption would be if that the equipment or processes used in the source protection process perform constantly to a defined standard without deviation then the water produced by the catchment should be deemed safe. However, it is possible to have a high reliability system that does not enforce safety of the overall system. Investigations into incidents involving complex systems have shown many accidents occur without the failure of any single component, instead, the failure has come from the way in which the system components have interreacted [20].
When assessing risk in drinking water supplies frequently broad assumptions are made on the effectiveness of control measures to protect drinking water quality. For the management of catchment risk, the risk tools used play a big role in development of the systems and processes to control ensuring drinking water safety [19]. A common standard industry approach is to use risk matrices which use an analysis of inherent and residual risk after a control has been implemented [12], semiqualitative risk assessment using a risk matrix supports the analysist role in providing a risk assessment where there is no reliable quantified probabilistic data on control performance or reliability. Instead the analysist uses the opinions of experts and staff with intimate knowledge of the process of interest [21]. The risk analysis process typically combines the worst possible consequence and associated likelihood of the hazard occurring to define the level of risk, and in most cases the water supplier usually defines the consequence and likelihood. In this process the analyst is required to make broad assumptions regarding the performance and effectiveness of the control measures and the processes that support them [22]. The resulting high level of uncertainty arising from gaps in knowledge and must be recognized during the risk assessment process [23].
In source protection, risk control actions are diverse and can include, livestock management, land management controls, statutory land use planning, regulatory enforcement actions, access barriers and government policy. Not only is there a vast number of control actions, there are almost as many agencies responsible for the control actions as there are control actions. The challenge then becomes how to ensure the control actions not only reliably perform as expected but correctly enforce safety constraints to meet the assumptions made. Therefore, the issue operational safety of source protection extends beyond component reliability and takes on board component interactions, multiple organizations, government policies etc. In more recent times the growing sophistication of technology such as those used in automation and remote monitoring has introduced new failure modes and operational hazards. There is limited literature exploring the key factors of these programs which can influence successful implementation of risk-based DWSP programs.
The accident model Systems Theoretic Accident Modelling Process (STAMP) was introduced in response to observing that many conventional hazard analysis methods are limited in their ability to work effectively for contemporary sociotechnical systems [24]. Being based on systems theory, the STAMP model views safety a control problem, in that the feedback and control actions in the system determine the overall system safety. In this study the STAMP based System Theoretic Process Analysis (STPA) is used a tool to identify hazards in a typical source protection program. Integrating STPA into hazard analysis process has the potential to overcome the heuristic biases which can contribute to flawed risk assessments [25]. The complexity of analyzing catchment performance and overall drinking water system risk is significant. This complexity is well suited to the use of STMAP based STPA to better comprehend how system constraints and hazards impacts on the overall ability of source protection programs to deliver safe drinking water. STAMP based incident analysis methods have been used to analyses the intricate systemic catchment to tap causal factors of the 2000 Walkerton drinking water contamination event [9].
Using hazard analysis focusing on water quality and public health risk management in drinking water catchments will be used to identify potential hazard control strategies. This study uses STPA to complete a comprehensive process hazard analysis of a source protection program for a typical surface water drinking to develop a set of comprehensive of system requirements for effective source protection programs based on current industry best practice. In this study effective source protection is the prevention or reduction of the potential for public illness due to contamination resulting from catchment contamination.
Through classifying and aggregating the countermeasures into initial critical success factors (CSF), a questionnaire was developed to capture industry professionals’ opinions on the importance of initial source protection critical success factors. Using the questionnaire results the key factors for successful source protection programs will be examined using Principle Components Analysis (PCA). Based on the PCA results of the surveys from combination of specialists and professionals in Taiwan, Australia, and Greece, it is possible to gain insight on the perceptions of the final CSFs influence the successful day to day operational management of source protection programs.
2. Materials and Methods
This study examines the process risks in the delivery of source protection programs for theoretical example of a typical surface water drinking water catchments using process hazard analysis. Process hazard analysis is common in many high-risk industries and is a fundamental step in risk assessment of any technical system and its processes [26]. Many of the conventional methods focus on equipment failure and fail to compressively identify hazards in complex sociotechnical systems [24] like those typically involved in source protection programs. This study uses STPA to take a wholistic look at the process hazards involved in DWSP programs. The results from the STPA process are then categorized and refined into final CSFs based on PCA of expert opinions. The detailed description of the two methods used are presented in the next two subsections.
2.1 STPA Methodology
Typical DWSP programs involve complex sociotechnical systems which can include technology, multiple agencies, government policy, private land holders etc. Hazards can arise from the control actions of the various actors in the safety system as well as the interaction of the various components in the system. STAMP based models are well suited to understanding safety systems involving a network of stakeholders such as government authorities and their corresponding influence over the process operations through regulation and policy [27]. Before commencing STPA based analysis, there is no need for a completed design of the safety process allowing the development of the safety system to be based on the STPA outputs [20]. Thus, STPA can be utilized in the formation of the safety system design and support refinement as the system evolves and changes, enabling enhancements of safety requirements of the safety system design [29]. The flexibility of the STPA methodology can support the analysis of the theoretical source protection program presented in this study.
Figure 1: The generic control structure used in STPA adapted from [29]
The system hazards are derived through assessing how the control actions in the safety system can lead to scenarios which violate the stated safety constraints of the system. The unsafe control actions (UCAs) are the result of scenarios where the control actions can potentially violate safety constraints. The following four prompts are used to guide the process of identifying scenarios which can result in UCAs; control action not provided, control action provided, control action provided too early or too late or in the wrong sequence, and control action provided too long or too short. In total the STPA methodology consists of four key steps [29].
1. Define the purpose of analysis – defining the process is used to identify unacceptable system losses, system level hazards and corresponding safety constraints
2. Model of the control structure – a safety system model comprised of a series of connected feedback and control loops
3. Identify unsafe control actions (UCAs) – the control actions which in a worst-case scenario will result in a hazard.
4. Identify loss scenarios – these are the scenarios that result from the combination of causal factors that lead to UCAs and potential loss(es).
In conjunction with the identification of loss scenarios in step two of the STPA process, the causal factors (CFs) and related scenarios leading to a UCA were considered. In this process CFs are the primary factors which may results in the control actions to becoming UCAs [29]. Following the identification CF for the UCAs, to provide information on how to reduce risk associated with UCAs the next step is to identify suitable countermeasures for each CF. The countermeasures are actions required to either prevent the causal scenario from occurring or reduce the impacts of the relevant CF for the scenarios considered [34]. It’s these countermeasures which are included in the program requirements to reduce the risk of unsafe or out of spec water being produced by the catchment. The STPA was completed using STAMP Workbench V1.0.0 by the Apache Software Company.
2.2 Identification of Critical Success Factors
Measuring the perceptions of importance for each of the countermeasures identified during the STPA process is impractical. For large systems with significant amounts of information a common approach is the use of Critical Success Factors (CSFs). CSFs are key items that must go well to ensure success managing a process. When carefully selected CSFs are proven to be highly effective in supporting planning and requirements analysis [30]. Developing an initial set of CSFs based on the STPA results the countermeasures involves reviewing of each countermeasure and grouping accordingly.
where the respondent provides a response ranging from 1 (strongly disagree) to 5 (strongly agree). Likert type questionnaires are frequently used in the collection of data on personal opinions or perceptions using questionnaires.
The final CSFs are then established using PCA to group the initial CSFs based on the questionnaire results. PCA uses a defined methodology to identify groups of related variables and through taking many variables are grouping them together to create a smaller set of variables that are relatively independent of each other [31]. Factor analysis through PCA and is an ideal technique for creating a more easily understood construct for management frameworks [32]. Through reducing several highly correlated variables to a smaller number of principle components which account for the majority of variance in the observed results, PCA can provide a set of CSFs for source protection program outcomes. The use of PCA is intended to reduce the variables contained in the questionnaire to a select number of focused CSF as well provide insight into how the various factors relate to each other. The key steps involved in PCA are verification of data suitability, construction of a correlation matrix, generate principle components, and interpretation of principle components produced. For this study, SPSS by IBM was used for the processing of questionnaire results and identifying the principle components.
3. Results 3.1 STPA Results
3.1.1 Purpose of analysis
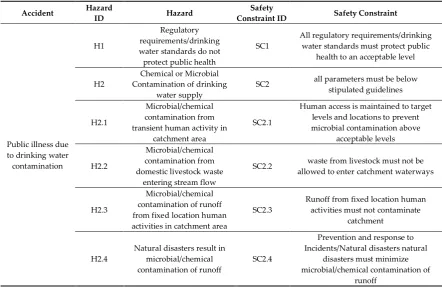
The principle accident or unacceptable loss considered is public illness and death from unsafe water produced by the catchment. The measure of this accident varies internationally depending on the relevant standards adopted, based on current guidance in [33] an accident would be drinking water quality which results in a community disease burden above the acceptable level per person for pathogens. Based on the accident selected, there are two main types of system level hazards considered in this study. The first system level hazard is the potential for regulatory requirements failing to protect public health and the second system level hazard is the activities or events in the catchment resulting in contamination of catchment runoff.
Table 1. The accidents, hazards and safety constraints selected for step one of the STPA method.
Accident Hazard
ID Hazard
Safety
Constraint ID Safety Constraint
Public illness due to drinking water contamination
H1
Regulatory requirements/drinking water standards do not protect public health
SC1
All regulatory requirements/drinking water standards must protect public
health to an acceptable level
H2
Chemical or Microbial Contamination of drinking
water supply
SC2 all parameters must be below stipulated guidelines
H2.1
Microbial/chemical contamination from transient human activity in
catchment area
SC2.1
Human access is maintained to target levels and locations to prevent microbial contamination above
acceptable levels
H2.2
Microbial/chemical contamination from domestic livestock waste
entering stream flow
SC2.2 waste from livestock must not be allowed to enter catchment waterways
H2.3
Microbial/chemical contamination of runoff from fixed location human activities in catchment area
SC2.3
Runoff from fixed location human activities must not contaminate
catchment
H2.4
Natural disasters result in microbial/chemical contamination of runoff
SC2.4
Prevention and response to Incidents/Natural disasters natural
disasters must minimize microbial/chemical contamination of
runoff
3.1.2. Source Protection Safety Control Structure
Table 2. Principle actors, responsibilities and control actions in the source protection safety system.
Component Responsibility Control Action
Government
Pass law for the protection of natural areas and public health. Assign relevant government departments the task of protection of natural areas, water resources, and public health. Provision of legislation to support the roles of the government department
• Pass Law • Provide Resourcing
• Set policy
Natural Resource Management Agencies
Governmental agencies assigned the task of land management and Regulating land uses in which have potential to impact on
water quality
• Enforce approval conditions • Enforce relevant
legislation • natural hazard
reduction • Respond to natural
disasters
Public Health Regulator
Regulate public health aspects of public drinking water supply through a formal relationship with the Water Service Provider
• Set requirements for drinking water safety • Requirements for
safe drinking water
Water Quality Planning
Based on relevant agreed standards interpret the various catchment data to assess the level of risk. Based on the level of
risk plan catchment management operations to control risk to acceptable levels
• Set operational risk management requirements • Set limits for water
quality • Incident response
protocols • Set limits for observational data • Internal policy requirements for water
quality • Set QA requirements for water
sampling
Bulk Water Supplier
Use the water quality planning information to implement risk management and control operations. Provide feedback on the
parameters required by the water planning
• Operational requirements for water
quality • Configure remote
monitoring system • Set event alert
criteria
• Create work orders: Field Operations • Work planning:
Field operations • Set water quality
analysis parameters • Incident
management • Set conditional
approvals
Drinking Water Catchment Area
The area of land where water for the public drinking water supply is captured. The catchment characteristics will determine
the quality of water produced
• Control water quality to reservoir
Remote Monitoring System
Send real-time information to field operators and provide overall risk data to water quality planning
• System configuration commands
Drinking Water Standards
Set guidelines for ensuring safe drinking water in public drinking water supplies
• Set industry standards for safe drinking water
Corporate Governance - WQP
The executive management of the WSP. Responsible for the strategic direction for the water quality planning functions. Also
responsible for the resources for completing the functions of water quality planning
• Provide oversight • Provide resourcing
• Corporate policy
Operators - Field Operations
Undertake the planned actions in the field required to protect drinking water objectives and respond to threats as they arise
• Enforce bylaws • Enforce approval
• Inspect catchment condition • Incident response
• Collect water samples • Collect in situ water
quality data • Inspect reservoir
condition
Operator - Maintenance/Repair
Repair and maintain catchment assets based on relevant work plans
• Repair assets • Inspect asset / barrier condition • Maintain field monitoring equipment
• Inspect asset condition
Water Lab Analyse water samples collected from the catchment • N/A (operates as a sensor in STPA)
Corporate Governance - BWS
The executive management of the bulk water supplier responsible for strategic direction and provision of resources
• Provide oversight • Provide resourcing
• Corporate policy Field Operations
Supervisor
Schedule assigned work and assign resources to catchment operations
• Work schedule: Field operations Maintenance
Supervisor
Oversee that the maintenance team complete all tasks to meet the requirements of the bulk water supplier
Figure 2. Safety control structure of the theoretical surface water catchment suppling a bulk storage reservoir.
Note: Solid lines indicate direction of control actions to a process, dashed lines indicate direction of feedback from the process.
3.1.3. Unsafe Control Actions
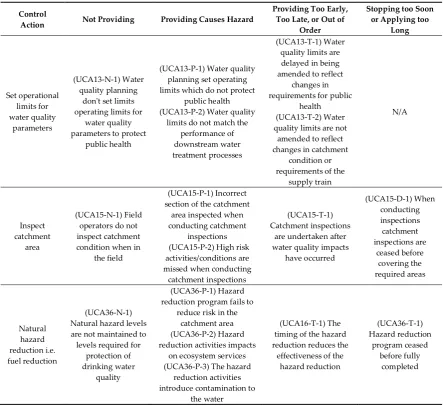
Table 3. Examples of the control actions and scenarios where the control actions could be unsafe.
Control
Action Not Providing Providing Causes Hazard
Providing Too Early, Too Late, or Out of
Order
Stopping too Soon or Applying too
Long Set operational limits for water quality parameters (UCA13-N-1) Water quality planning
don't set limits operating limits for
water quality parameters to protect
public health
(UCA13-P-1) Water quality planning set operating limits which do not protect
public health (UCA13-P-2) Water quality
limits do not match the performance of downstream water treatment processes
(UCA13-T-1) Water quality limits are delayed in being amended to reflect
changes in requirements for public
health (UCA13-T-2) Water quality limits are not amended to reflect changes in catchment
condition or requirements of the
supply train N/A Inspect catchment area (UCA15-N-1) Field operators do not inspect catchment condition when in
the field
(UCA15-P-1) Incorrect section of the catchment
area inspected when conducting catchment
inspections (UCA15-P-2) High risk activities/conditions are missed when conducting catchment inspections
(UCA15-T-1) Catchment inspections
are undertaken after water quality impacts
have occurred (UCA15-D-1) When conducting inspections catchment inspections are ceased before covering the required areas Natural hazard reduction i.e. fuel reduction (UCA36-N-1) Natural hazard levels are not maintained to levels required for
protection of drinking water
quality
(UCA36-P-1) Hazard reduction program fails to
reduce risk in the catchment area (UCA36-P-2) Hazard reduction activities impacts
on ecosystem services (UCA36-P-3) The hazard
reduction activities introduce contamination to
the water
(UCA16-T-1) The timing of the hazard reduction reduces the
effectiveness of the hazard reduction (UCA36-T-1) Hazard reduction program ceased before fully completed
3.1.4. Loss Scenarios and Countermeasures
Table 4. An example of the causal factors identified, and the countermeasures developed following STPA.
UCA Causal Factor Countermeasure
(UCA13-N-1) Water quality planning don't set limits to protect public health on water
sample results
There is no industry agreed limit for the parameter of interest (potentially the case for emerging water quality
issues)
Work with relevant industry bodies to research emerging issues and provide an agreed position on limits to protect public health
(UCA15-P-1) Incorrect section of the catchment area inspected when conducting
catchment inspections
The field operator misses key risk areas of the catchment when
conducting inspections
Field staff are provided with a plan showing all the areas required to be inspected as part of normal surveillance operations which includes fixed location and transient high-risk activities (UCA36-N-1) Natural disaster
hazard levels are not maintained to levels required
for protection of drinking water quality
The natural resource management agency is not aware of the risk that the natural hazard levels in the catchment area have on drinking
water quality
Provide information gained during surveillance that indicates potential hazards to
drinking water quality from natural disaster events e.g. high fuel loads
3.2. Critical Success Factors
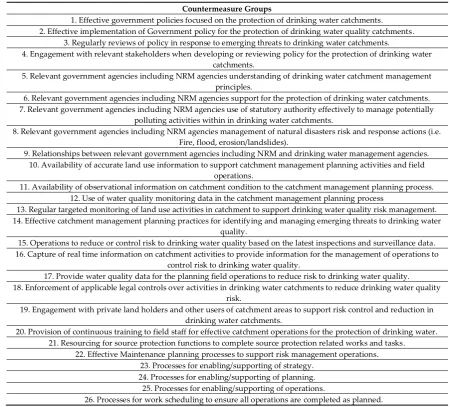
The STPA results can produce a multitude of countermeasures for ensuring safe operational control of source protection. The STPA process is focused on identifying of system level hazards, in the STPA procedure there is no evaluation of importance provided. There is no practical or efficient way to evaluate each of the UCAs or countermeasures identified. Therefore, in this study the validation of countermeasures is determined based on the perceptions of source protection professionals. Measuring the perceptions of importance for each of the countermeasures is impractical, therefore the countermeasures need to be reduced a number of smaller groups based on common traits and functions.
Table 5. Countermeasure groups derived from the STPA countermeasures.
Countermeasure Groups
1. Effective government policies focused on the protection of drinking water catchments. 2. Effective implementation of Government policy for the protection of drinking water quality catchments.
3. Regularly reviews of policy in response to emerging threats to drinking water catchments.
4. Engagement with relevant stakeholders when developing or reviewing policy for the protection of drinking water catchments.
5. Relevant government agencies including NRM agencies understanding of drinking water catchment management principles.
6. Relevant government agencies including NRM agencies support for the protection of drinking water catchments. 7. Relevant government agencies including NRM agencies use of statutory authority effectively to manage potentially
polluting activities within in drinking water catchments.
8. Relevant government agencies including NRM agencies management of natural disasters risk and response actions (i.e. Fire, flood, erosion/landslides).
9. Relationships between relevant government agencies including NRM and drinking water management agencies. 10. Availability of accurate land use information to support catchment management planning activities and field
operations.
11. Availability of observational information on catchment condition to the catchment management planning process. 12. Use of water quality monitoring data in the catchment management planning process
13. Regular targeted monitoring of land use activities in catchment to support drinking water quality risk management. 14. Effective catchment management planning practices for identifying and managing emerging threats to drinking water
quality.
15. Operations to reduce or control risk to drinking water quality based on the latest inspections and surveillance data. 16. Capture of real time information on catchment activities to provide information for the management of operations to
control risk to drinking water quality.
17. Provide water quality data for the planning field operations to reduce risk to drinking water quality. 18. Enforcement of applicable legal controls over activities in drinking water catchments to reduce drinking water quality
risk.
19. Engagement with private land holders and other users of catchment areas to support risk control and reduction in drinking water catchments.
20. Provision of continuous training to field staff for effective catchment operations for the protection of drinking water. 21. Resourcing for source protection functions to complete source protection related works and tasks.
22. Effective Maintenance planning processes to support risk management operations. 23. Processes for enabling/supporting of strategy.
24. Processes for enabling/supporting of planning. 25. Processes for enabling/supporting of operations.
26. Processes for work scheduling to ensure all operations are completed as planned.
3.3. Questionnaire Development
For this study the questionnaire comprised of 20 statements taken from the initial CSFs based on the countermeasure groups 1-20 in Table 5. All the items in these questions related to how an agency would plan, implement, and evaluate source protection programs. Items from 21-26 though representing important results from STPA are more related to the processes within an organization that would be used in supporting source protection programs and were excluded from the scope of this study.
critical to catchment management, 12) Water quality data is critical to catchment management, 13) Typical catchment management practices are capable of identifying and managing threats to drinking water quality, 14) Regular monitoring of activities in catchment areas is essential to managing risk to drinking water quality, 15) Real time information on catchment activities is required for effective control of risk to drinking water quality, 16) Enforcement of legal controls over activities in drinking water catchments are effective in reducing drinking water quality risk, 17) Data collected through inspections/surveillance is valuable in planning field operations to reduce risk to drinking water quality, 18) Water quality data is essential in planning field operations to reduce risk to drinking water quality, 19) Engagement with public in catchment areas is essential in reducing risk in drinking water catchments, and 20) Continuous training of field staff is critical to effective catchment operations for the protection of drinking water.
Prior to full distribution, a copy of the survey questionnaire was provided to four selected source protection professionals to verify that the questions were suitable for collecting representative data of source protection practices. The experts involved in the review included three Australian and two Taiwanese specialists with extensive experience in the water industry as well as having backgrounds in source protection practice, operations and research. To validate the final responses provided the questionnaires included the following screening questions, category of current role, current organization, and years of experience in source protection.
3.3.1. Questionnaire Respondents
Both the electronic and paper-based copies of the surveys were sent to professionals and specialists in Taiwan, Australia, and Greece. The target respondents were people working in drinking water catchment management related roles from industry, consulting, academia. Due to the specific skill set of the target respondents and the number of DWSP professionals the target pool was restricted. There was a total of 63 returned questionnaires received, two paper responses were discarded due to missing data resulting in a total of 61 responses. Once the questionnaires had been returned the results were then analyzed.
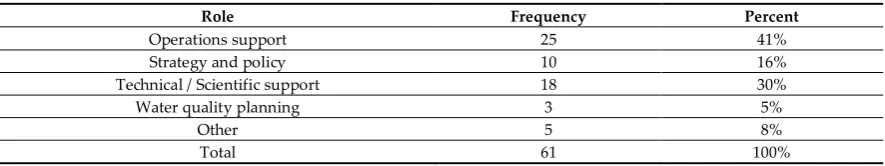
The distribution of responses for the three countries included 40, 13 and 8 questionnaires completed from Taiwan, Australia, and Greece, respectively. The current roles and years of experience in source protection of catchment management reported at the time are presented in Table 6 and Table 7, respectively. The survey shows that 44% of respondents reported of having 5 years or less experience. The remaining 56% of respondents reported having 5 or more years’ experience. The majority of respondents (51%) reported having between 5- and 20-years’ experience in catchment management or source protection.
Table 6. Summary of respondents’ years of experience in catchment management and source protection.
Years’ Experience Frequency Percent
<5 27 44%
5-10 17 28%
10-20 14 23%
>20 3 5%
Total 61 100%
Table 7. Summary of respondents’ role type in their respective organization.
Role Frequency Percent
Operations support 25 41%
Strategy and policy 10 16%
Technical / Scientific support 18 30%
Water quality planning 3 5%
Other 5 8%
3.3.2. Test of Reliability and Validity
In terms of the survey responses, “Reliability” refers to the internal consistency and stability of the questionnaire results and is most frequently expressed in terms of Cronbach’s α [36], with a value exceeding 0.7 indicating a high degree of reliability [37] and is deemed satisfactory [38,39]. The Cronbach’s α for the responses of the responses from the three countries combined is 0.92, showing the internal consistency of the 20 questions is significant enough to continue with the analysis.
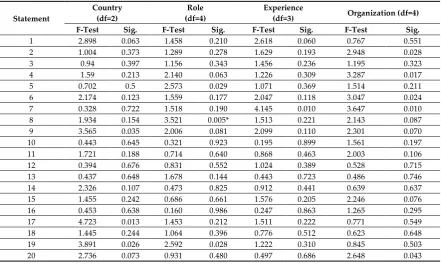
With responses being received from three different countries, multiple agencies, role within respective organization, and different levels of experience there is potential for differences in the responses which could influence the results presented. To test for the potential difference in answers between the three countries a comparison of the means using ANOVA was completed for the responses to each of the 20 questions. Of the responses there was only one significant difference at the P=<0.01 significance level, being item 8 for role. Item 8 relates to Natural Resource Management agencies effective management of risk from natural disasters, given the diversity of roles represented some difference is not unexpected. Given the difference is only with a single item and characteristic it was considered prudent to continue with analyzing the data as a single group. The ANOVA F-test results for each of the 20 questions are presented in Table 8.
Table 8. ANOVA results for comparison of all groups.
Statement
Country (df=2)
Role (df=4)
Experience
(df=3) Organization (df=4)
F-Test Sig. F-Test Sig. F-Test Sig. F-Test Sig.
1 2.898 0.063 1.458 0.210 2.618 0.060 0.767 0.551
2 1.004 0.373 1.289 0.278 1.629 0.193 2.948 0.028
3 0.94 0.397 1.156 0.343 1.456 0.236 1.195 0.323
4 1.59 0.213 2.140 0.063 1.226 0.309 3.287 0.017
5 0.702 0.5 2.573 0.029 1.071 0.369 1.514 0.211
6 2.174 0.123 1.559 0.177 2.047 0.118 3.047 0.024
7 0.328 0.722 1.518 0.190 4.145 0.010 3.647 0.010
8 1.934 0.154 3.521 0.005* 1.513 0.221 2.143 0.087
9 3.565 0.035 2.006 0.081 2.099 0.110 2.301 0.070
10 0.443 0.645 0.321 0.923 0.195 0.899 1.561 0.197
11 1.721 0.188 0.714 0.640 0.868 0.463 2.003 0.106
12 0.394 0.676 0.831 0.552 1.024 0.389 0.528 0.715
13 0.437 0.648 1.678 0.144 0.443 0.723 0.486 0.746
14 2.326 0.107 0.473 0.825 0.912 0.441 0.639 0.637
15 1.455 0.242 0.686 0.661 1.576 0.205 2.246 0.076
16 0.453 0.638 0.160 0.986 0.247 0.863 1.265 0.295
17 4.723 0.013 1.453 0.212 1.511 0.222 0.771 0.549
18 1.445 0.244 1.064 0.396 0.776 0.512 0.623 0.648
19 3.891 0.026 2.592 0.028 1.222 0.310 0.845 0.503
20 2.736 0.073 0.931 0.480 0.497 0.686 2.648 0.043
* significant results at the P =< 0.010 level
3.3.3. Questionnaire Responses
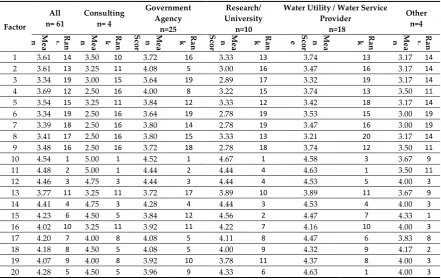
with source protection, resulting in greater importance placed on the tasks associated with management planning. Whereas the policy related items tended to have comparatively lower means and lower ranks in the 20 factors identified. For catchment management agencies the influence over policy is usually as a stakeholder in the development and implement processes. These processes can be protracted and take years to complete. Therefore, there is less direct control over the outcomes and the benefits gained can take a long time to be realized.
Table 9. The ranked means of the survey results shown by organizational group.
Factor
All n= 61
Consulting n= 4
Government Agency
n=25
Research/ University
n=10
Water Utility / Water Service Provider
n=18
Other n=4
Me
a
n
S
co
r
e k Ran Me
a
n
S
co
r
e k Ran Me
a
n
S
co
r
e k Ran Me
a
n
S
co
r
e k Ran Me
a
n
S
co
r
e k Ran Me
a
n
S
co
r
e k Ran
1 3.61 14 3.50 10 3.72 16 3.33 13 3.74 13 3.17 14
2 3.61 13 3.25 11 4.08 5 3.00 16 3.47 16 3.17 14
3 3.34 19 3.00 15 3.64 19 2.89 17 3.32 19 3.17 14
4 3.69 12 2.50 16 4.00 8 3.22 15 3.74 13 3.50 11
5 3.54 15 3.25 11 3.84 12 3.33 12 3.42 18 3.17 14
6 3.34 19 2.50 16 3.64 19 2.78 19 3.53 15 3.00 19
7 3.39 18 2.50 16 3.80 14 2.78 19 3.47 16 3.00 19
8 3.41 17 2.50 16 3.80 15 3.33 13 3.21 20 3.17 14
9 3.48 16 2.50 16 3.72 18 2.78 18 3.74 12 3.50 11
10 4.54 1 5.00 1 4.52 1 4.67 1 4.58 3 3.67 9
11 4.48 2 5.00 1 4.44 2 4.44 4 4.63 1 3.50 11
12 4.46 3 4.75 3 4.44 3 4.44 4 4.53 5 4.00 3
13 3.77 11 3.25 11 3.72 17 3.89 10 3.89 11 3.67 9
14 4.41 4 4.75 3 4.28 4 4.44 3 4.53 4 4.00 3
15 4.23 6 4.50 5 3.84 12 4.56 2 4.47 7 4.33 1
16 4.02 10 3.25 11 3.92 11 4.22 7 4.16 10 4.00 3
17 4.20 7 4.00 8 4.08 5 4.11 8 4.47 6 3.83 8
18 4.18 8 4.50 5 4.08 5 4.00 9 4.32 9 4.17 2
19 4.07 9 4.00 8 3.92 10 3.78 11 4.37 8 4.00 3
20 4.28 5 4.50 5 3.96 9 4.33 6 4.63 1 4.00 3
3.4. Principle Components Analysis 3.4.1. Data Suitability
The total valid responses (n) received was 61 for the 20 questions (p) results in a factor to respondent ratio of 3:1. The literature on the minimum sample size required for PCA varies greatly and therefore there is no a straightforward guideline on the minimum sample size required for PCA [40]. The minimum sample size required varies depending on the quality and type of the data. Though the sample size was quite low, communalities for the 20 factors were all above 0.6 with exception of factors 4 and 15 which were 0.49 and 0.57, respectively. The relatively high levels of communality for the factors indicates that the data is of suitable quality to continue with PCA.
3.4.2 Correlation Matrix
The correlation matrix is developed through calculating the Pearson Correlation values (r) for each of the factors pair together to form a matrix (Table 10). Most correlations in the matrix display significant values with many correlations over an r value of 0.4, indicating that several significant relationships exist between the factors. With the large number of strong correlations between factors, the data is suitable to continue with PCA. Interestingly the strongest correlations are between 10 and 11(r=0.88), 10 and 12(r=0.82), and 11 and 12(r=0.84). Given that these factors relate to the different data used in the planning process such as observational data and water quality data as well as land use information, there is likely to be a strong relationship between then. Water quality data has long been the key focus in determining catchment risk and identifying potential risks to public health and planning control measures. However, the formal use of observational data to provide information on potential threats to drinking water quality in catchment is comparatively recent.
Table 10. Pearson correlation matrix for the 20 initial CSF.
1 2 3 4 5 6 7 8 9 10 11 12 13 14 15 16 17 18 19 20
1 1.0
0
2 0.7
2
1.0 0
3 0.6
1 0.6
6
1.0 0
4 0.4
9 0.4 7 0.5 1 1.0 0
5 0.4
8 0.6 1 0.4 8 0.5 0 1.0 0
6 0.6
2 0.6 9 0.6 2 0.6 0 0.7 1 1.0 0
7 0.5
5 0.5 8 0.5 4 0.5 0 0.4 8 0.7 0 1.0 0
8 0.4
3 0.4 3 0.5 2 0.5 3 0.3 8 0.5 6 0.5 9 1.0 0
9 0.5
1 6 0.3 2 0.1 4 0.1 7 0.4 3 0.1 0 0.2 0 0.2 7 0.3 9 0.3 2 0.4 2 0.4 8 0.4 8 0.6 1 0.4 4 0.5 3 1.0 0 1 7 0.3 7 0.3 6 0.3 1 0.3 3 0.1 7 0.1 8 0.1 8 0.3 9 0.4 2 0.5 6 0.6 7 0.6 7 0.5 4 0.6 4 0.4 8 0.4 9 1.0 0 1 8 0.3 5 0.3 2 0.3 6 0.3 8 0.1 6 0.2 5 0.1 8 0.2 3 0.3 0 0.5 2 0.5 4 0.7 3 0.5 1 0.5 9 0.4 3 0.4 6 0.6 9 1.0 0 1 9 0.1 7 0.0 9 0.2 5 0.3 2 0.1 0 0.0 6 0.0 1 0.2 6 0.3 3 0.3 6 0.3 7 0.3 7 0.3 9 0.4 6 0.3 0 0.2 6 0.6 7 0.5 4 1.0 0 2 0 0.0 4 -0.0 7 0.0 5 0.2 5 0.1 3 0.0 5 -0.0 6 0.1 8 0.2 2 0.4 4 0.4 3 0.5 1 0.4 4 0.5 9 0.4 7 0.3 1 0.5 6 0.5 4 0.6 6 1.0 0
correlation values in bold and italics are significant (p-value <0.05)
Before progressing to the extraction of the factors, an assessment of the data for suitability of Factor was made. The tests include Bartlett's Test of Sphericity to verify that the correlation matrix doesn’t represent an identify matrix, as well as the KMO Measure of Sampling Adequacy to ensure the matrix is suitable for PCA. The KMO index has a potential range from 0 to 1, where a result greater than 0.50 indicating the data is suitable for PCA. This test is important where the factor to respondent ratio is less than 5:1 [40]. Additionally, the Bartlett's Test of Sphericity should be significant at p=0.05 level. The KMO index value in this case is 0.83 indicating the matrix is highly suitable for PCA despite the low factor to respondent ratio. Furthermore, the Bartlett's Test of Sphericity returned an approximate Chi-Square value of 912.6 with 190 degrees of freedom, resulting in a p-value of 0.000, further indicating the suitability for continuing with PCA.
3.4.3 Extraction of Factors
Eigenvalues indicate the amount of variance explained by each principal component [41]. The scree plot of eigenvalues and component values shown in Figure 4 shows that a large proportion of the variance is explained between component number one and component number four. At around component number 4 there is an inflection point where the scree plot flattens. The final factors were extracted using the Kaiser rule, where components with eigenvalues of 1 or above are retained [42]. The results contained four factors with an eigenvalue above 1, therefore a 4-factor model was selected.
Figure 4. Scree plot of the eigenvalue versus the number of components.
be considered good and indicates 30% overlapping variance. The resulting factor groups, factor loadings and associated variances are shown in Table 11.
Table 11. Rotated factors Key factors identified, factor loadings and variance.
Criteria and Characteristic Variables Factor
Loading
Variance Percentage
Cumulative Variance Percentage CSF 1: Policy and Government Agency Support of Source Protection 40.13% 40.13% 6: Natural Resource Management agencies support the protection of drinking
water catchments 0.892
2: Government agencies actively implement policy for the protection of drinking
water quality catchments 0.835
5: Natural Resource Management agencies have a good understanding of
drinking water catchment management principles. 0.777 7: Natural Resource Management agencies use their authority to manage
activities within in drinking water catchments 0.769 3: Government provides timely policy responses to emerging threats to drinking
water catchments. 0.766
1: Current government policies provide robust protection of drinking water
catchments 0.746
9: Natural Resource Management agencies see drinking water management
agencies as key stakeholders 0.759 4: Government engaging with relevant stakeholders when developing or
reviewing policy for the protection of drinking water catchments 0.668 8: Natural Resource Management agencies effectiveness in managing risk of
natural disasters (i.e. Fire, flood, erosion/landslides) 0.619
CSF 2: Catchment Risk Monitoring and Information 19.77% 59.90%
10: Effective catchment management planning requires current land use
information 0.898
11: Observational information on catchment condition is critical to the
catchment management planning process 0.884 12: Effective catchment management planning requires water quality
monitoring data 0.854
14: Regular surveillance of human activities in catchment areas is essential to
manage risk to drinking water quality 0.721 15: Real time information on catchment activities is required for effective control
of risk to drinking water quality. 0.630
CSF 3: Support of Operational Field Activities 6.29% 66.19%
19: Engagement with private land holders is essential in reducing risk in
drinking water catchments. 0.839
20: Continuous training of field staff is critical to effective catchment operations
for the protection of drinking water. 0.772 17: Data collected through inspections/surveillance is valuable in planning
operations to reduce risk to drinking water quality 0.568
CSF 4: Response to Water Quality Threats 5.32% 71.51%
13: Best practice catchment management planning practices can identify and
manage emerging threats to drinking water quality 0.788 16: Enforcement of legal controls over activities in drinking water catchments
are effective in reducing drinking water quality risk 0.716
4. Discussion
With the PCA completed the next step is to interpret the results and understand the implications for implementation of source protection programs. The PCA results are interpreted as a series of refined CSFs based upon the factors which when combined account for 71.5% total variance observed. CSF 1: Effective Policy and Government Agency Support of Source Protection
commitment from all involved to sustain. Policy and legislation can take years to develop and effectiveness is based on the commitment and the engagement and support of the various stakeholders in the catchment areas. The development of new environmental policy related to source protection is often incremental and done in response to a crisis [43].
Drinking water catchments are often multiuse and fall under the jurisdiction of multiple government agencies for the management of various natural resources or environmental protection roles. For water utilities there of often limited statutory power to enforce requirements for the protection of drinking water quality. Therefore, the actions natural resource management agencies operating in catchment areas have substantial influence over water quality produced by the catchment. Active stakeholder engagement between water utilities and natural resource management agencies is fundamental to ensuring safe drinking water. The approach taken should be that of a partnership which leverages of each agencies strength in protecting drinking water.
CSF 2: Catchment condition information and risk monitoring
This group is comprised of factors 10, 11, 12, and 14, which relate to information on catchment condition and water quality. The respondents to the survey ranked these items the highest overall, and together they account for almost 20% of the variance observed in the PCA. In this group, the items are related to the information required to effectively plan for the operations to manage risk in the catchment. Often these items are of high focus as they are key to the planning and are easily managed and controlled by water utilities and catchment management agencies. The three key sources of risk information included are conventional water sampling, observational monitoring of catchment condition as well as inspection of conditionally approved activities.
Data collected on catchment condition and water quality plays an important role in the risk assessment and control activities of water utilities. Water quality sampling is long standing practice; however, water quality samples provide a limited view of what has happened in the catchment area. Furthermore, to sample for all possible contaminants is very costly and highly impractical. On the other hand, data obtained through observations if understood correctly can provide information on what threats to drinking water quality may occur. Using observational information and together can provide a more accurate representation of the risks in the catchment and the performance of control measures. In [2] the guidelines for data collection presents the same process for both risk management for water quality monitoring and observational monitoring.
CSF 3: Support and enabling of operational activities
The three factors that make up this group (19, 20 and 17) are centered around providing the enablement to collect the appropriate information to support effective catchment management planning. CSF 2 is based on the use of catchment information to assess risk and plan controls. In CSF 3 are the functions are centered around field staff being able to use current catchment information to plan and execute their functions in collection of data relating to the overall catchment condition. Catchment areas can be very large covering significant parcels of land, and monitoring catchment condition is very resource intensive task. Additionally, many of the high-risk activities are can be spatially or temporally transient in nature. To ensure that field operations realize the required outcomes in managing drinking water risk the planning of the activities needs to be based on the most accurate catchment information as possible. Furthermore, field staff across most agencies are required to complete a vast portfolio of tasks in the course of their regular duties in addition to response to incidents such as wildfire. For field staff being able to successfully execute the large variety of tasks and keep up to date with advancing practices in source protection, there needs to be a program of continual training and skills development.
CSF 4: Response to water quality threats
referred to in this study arise in two main ways, the first being potential for the discovery of certain compounds to have potential health impacts and significant changes to land uses or activities in the catchment which could impact water quality.
5. Conclusions
Capitalizing on catchment ecosystems and their services to producing clean runoff has the potential to reduce or offset costs serving alongside necessary conventional built infrastructure to provide an integrated system to deliver cost effective drinking water [45]. Drinking water catchments are a unique asset in the drinking water supply network, due to the involvement of multiple government agencies, private landholders, commercial industries, etc. Protecting drinking water catchments reduces health risks associated with enteric pathogens, chemical contamination, toxic compounds produced by cyanobacteria, and disinfection by products. The programs in place to manage source protection are complex sociotechnical systems involving policy, standards, regulators, technology, human factors and so on. The inherent nature of source protection programs is that many conventional hazard analysis methods are not well suited to such a system.
In this study, we show the potential of the STAMP based STPA method for hazard analysis in source protection programs to identify and plan countermeasures for operational hazards to ensure safe drinking water. The top-down approach of STPA provides a clear picture on how the risk control measures for preventing catchment contamination is managed all the way from government policy and regulation through to field operations. Having this whole of system perspective can assist in the risk assessment process when trying to understand and assess the effectiveness of control measures. For a water utility, this type of tool is beneficial for understanding where weakness in current operational risk systems may be present and implement targeted strategies through the conventional risk assessment approaches.
Through a targeted questionnaire the study uses the perspective of professionals and specialists involved in catchment management and source protection to validate source protection measures identified through STPA. The PCA of questionnaire results provides insight into the approach of grouping of source protection measures to identify a series of targeted CSF for operational source protection programs. The results questionnaire results presented provide insight into the factors which influence the overall success for source protection programs based on the perceptions of professionals and experts working in the field. In general, the view catchment management experts surveyed aligned with principles of best practice in the planning and execution of source protection operations based on the STPA results. However, there is limited investigation on the operational hazards that can be faced in implementing source protection programs. Assessing drinking water risk effectively requires an understanding of operational hazard involved in complex sociotechnical systems used in the protection of drinking water sources. With the introduction of new risk management frameworks such the proposed HBT, operational management systems need to become more sophisticated to ensure the objectives set are being continually met. There is potential for asynchronous evolution where the advancements in risk management frameworks place greater pressure on risk controls without adequate management of operational hazards in delivering those controls. Further leveraging of the knowledge industry professionals and practitioners can help to design guidelines and policies which support good practice in source protection.
Author Contributions: “conceptualization, Hew Merrett, Wei Tong Chen and Jao Jia Horng; methodology, Hew Merrett, Wei Tong Chen and Jao Jia Horng.; software, Hew Merrett.; formal analysis, Hew Merrett; resources, Wei Tong Chen and Jao Jia Horng; writing—original draft preparation, Hew Merrett.; writing—review and editing, Hew Merrett and Wei Tong Chen.”.
Funding: This research received no external funding
Acknowledgments: The authors would like to acknowledge the valuable input of the selected specialists who provided their time and expertise to review the initial questionnaires. Also, the authors thank all the respondents that took the time to complete the surveys and provide their valued opinions.
Conflicts of Interest: The authors declare no conflict of interest
References
1. WHO. Guidelines for drinking-water quality: fourth edition incorporating the first addendum. Geneva: World Health Organisation, 2017, ISBN: 978-92-4-154995-0
2. NHMRC, NRMMC. Australian Drinking Water Guidelines Paper 6 National Water Quality Management
Strategy. Commonwealth of Australia, Canberra: National Health and Medical Research Council, National
Resource Management Ministerial Council. 2011. ISBN:186-496-5118
3. Postel S.L.; Thompson B.H. Watershed protection: Capturing the benefits of nature's water supply services.
Natural Resources Forum2005,98, pp98-105. https://doi.org/10.1111/j.1477-8947.2005.00119.x
4. Davies J.M.; Mazumder A. Health and environmental policy issues in Canada: the role of watershed management in sustaining clean drinking water quality at surface sources. Journal of Environmental
Management2003, 68, pp 273–286 https://doi.org/10.1016/S0301-4797(03)00070-7
5. Hrudey S.E.; Hrudey E.J. Pollard S.J.T.; Risk management for assuring safe drinking water. Environment
International2006, 32, pp 948-957. https://doi.org/10.1016/j.envint.2006.06.004
6. Wu S.; Hrudey S.; French S.; Bedford ??; Soane E.; Pollard S.; A role of human reliability analysis (HRA) in preventing drinking water incidents and securing safe drinking water. Water Research2009, 43, pp 3227-3238. https://doi.org/10.1016/j.watres.2009.04.040
7. Cook R.I.; How Complex Systems Fail. University of Chicago: Cognitive Technologies Laboratory. 2000, pp 1-2.
8. Hrudey S.E.; Payment P.; Huck P.M.; Gillham R.W.; and Hrudey E.J.; A fatal waterborne disease epidemic in Walkerton, Ontario: comparison with other waterborne outbreaks in the developed world. Water Science
and Technology2003, 47, pp7-14. https://doi.org/10.2166/wst.2003.0146
9. Leveson N.M.; Daouk, N Dulac, and K Marais. Applying STAMP in Accident Analysis. Workshop on the Investigation and Reporting of Accidents. 2003, p177-198
10. Bartram J.; Corrales L.; Davison A.; Deere D.; Drury D.; Gordon B, Howard G, Rinehold A, Stevens M.;
Water safety plan manual: step-by-step risk management for drinking-water suppliers. Geneva: World Health
Organisation 2009, pp1-5, ISBN: 978-924-1-56263-8
11. Nadebaum P; Chapman M.; Morden R.; Rizak S.; A guide to hazard identification & risk assessment for drinking
water supplies - Research Report 11. Salisbury: The Cooperative Research Centre for Water Quality and
Treatment. 2004. ISBN: 1876616121.
12. Hokstad P.; Røstum J.; Sklet S.; Rosén L.; Pettersson T.J.; Linde A.; Sturm S.; Beuken R.; Kirchner D.; Niewersch C.; Methods for risk analysis of drinking water systems from source to tap - guidance report on Risk
Analysis. TECHNEAU report. 2009, pp 50-70 available online:
http://citeseerx.ist.psu.edu/viewdoc/download?doi=10.1.1.367.4044&rep=rep1&type=pdf (accessed 2 January 2019).
13. Sulaman S.M.; Beer A.; Felder M.; Host M.; Comparison of FMEA and STPA safety analysis methods: a case study. Software Quality Journal2017, Pp1-39. https://doi.org/10.1007/s11219-017-9396-0
14. Merrett, H.C.; Chen W.T.; Horng, J.J.; Managing water catchments as water treatment assets for water quality and source protection. In Proceedings of the 6th Annual International Conference on Architecture and Civil Engineering. 2018 https://doi.org/10.5176/2301-394X_ACE18.93
![Figure 1: The generic control structure used in STPA adapted from [29]](https://thumb-us.123doks.com/thumbv2/123dok_us/7905005.1312435/6.595.226.372.74.237/figure-generic-control-structure-used-stpa-adapted.webp)