Clinical Ophthalmology
Dovepress
O r i g i n A L r e s e A r C h
open access to scientific and medical research
Open Access Full Text Article
Progression rate of total, and upper and lower
visual field defects in open-angle glaucoma patients
Takeo Fukuchi Takaiko Yoshino hideko sawada Masaaki seki Tetsuya Togano Takayuki Tanaka Jun Ueda haruki Abe
Division of Ophthalmology
and Visual science, graduated school of Medical and Dental sciences, niigata University, niigata, Japan
Correspondence: Takeo Fukuchi Division of Ophthalmology and Visual science, graduated school of Medical and Dental sciences, niigata University,
1-757 Asahimachi-dori, Niigata, Niigata 951-8510, Japan
Tel +81 25 227 2296
Fax +81 25 227 0785
email [email protected]
Purpose: We evaluated the progression rate of total, and upper and lower visual field defects in treated open-angle glaucoma patients.
Patients and methods: This study was a retrospective, nonrandomized, comparative study. Five-hundred forty-four eyes from 315 Japanese open-angle glaucoma patients were examined. The mean deviation (MD) and total deviation (TD) for both the upper and lower slopes on the Humphrey Field Analyzer were calculated and compared in high-tension glaucoma (.21 mmHg) and normal-tension glaucoma (#21 mmHg).
Results: Patients with over −20 dB of MD and over −23 dB of upper or lower TD were enrolled into each analysis. Patients with −7.75 ± 5.30 (mean ± standard deviation) dB of MD,
−9.16 ± 10.80 dB of upper TD, or −7.11 ± 6.02 dB of lower TD were followed up for 4–19 years. The mean MD slope was −0.41 ± 0.50 dB/year, the upper TD slope was −0.46 ± 0.65 dB/year, and the lower TD slope was −0.32 ± 0.53 dB/year. Comparing high-tension glaucoma and normal-tension glaucoma, the upper TD slope was similar for both types of glaucoma, but the MD and lower TD slopes in high-tension glaucoma were significantly lower than those in normal-tension glaucoma.
Conclusions: The progression rates in lower visual field defects in high-tension glaucoma might be faster than those in normal-tension glaucoma. The results of this study might be used to predict the prognosis of visual field defects, as well as the quality of vision in patients with open-angle glaucoma.
Keywords: open-angle glaucoma, visual field defects, progression rate, primary open-angle glaucoma, normal-tension glaucoma
Introduction
Glaucoma is one of the leading causes of acquired blindness worldwide.1,2 A lot of
clinical trials have confirmed the importance of intraocular pressure (IOP) in the devel-opment of open-angle glaucoma and its progression. These studies have shown that IOP reduction lessens the risk of development and progression of open-angle glaucoma.3–14
In the Ocular Hypertension Treatment Study (OHTS),3,4 the mean reduction of IOP
in the treated group was 22.5% ± 9.9% (mean ± standard deviation [SD]). The IOP decreased by 4.0% ± 11.6% in the observation group. Treatment to reduce IOP also reduced the progression of clinically manifest glaucoma from 62% to 45% in the Early Manifest Glaucoma Trial (EMGT),5–7 and from 27% to 12% in the Collaborative
Normal Tension Glaucoma Study (CNTGS).8–10 In addition, these multicenter trials
identified various clinical factors related to both the onset or progression of glaucoma.
Clinical Ophthalmology downloaded from https://www.dovepress.com/ by 118.70.13.36 on 21-Aug-2020
For personal use only.
Number of times this article has been viewed
This article was published in the following Dove Press journal: Clinical Ophthalmology
Table 1 The profiles of the patients enrolled into the study
OAG HTG NTG P
Patients (eyes/cases) 544/325 265 /154 279/171
Bilateral/unilateral (cases) 219/106 111/43 108/63
OD/Os (eyes) 273/271 138/127 135/144
gender
Male (eyes/cases) 236/141 132/77 104/64
Female (eyes/cases) 308/184 133/77 175/107
Age (years) 57.2 ± 11.3
(30–79)
57.1 ± 11.3
(33–79)
57.3 ± 10.7 (30–79)
0.9974
Follow-up duration (years) 8.78 ± 4.01 (4–19)
8.78 ± 4.01
(4–18)
9.06 ±3.71
(4–19)
0.0526
initial MD (dB) −9.50 ± 8.75
(−0.01 to −31.7)
−10.46 ± 8.75
(−0.03 to −31.7)
−8.59 ± 6.12
(−0.01 to −27.1)
0.0326
initial upper TD (dB) −11.80 ± 9.35 (−0.18 to −30.95)
−12.54 ± 9.35 (−0.18 to −30.95)
−11.09 ± 8.30
(−0.43 to −28.9)
0.0464
initial lower TD (dB) −8.35 ± 9.73
(−0.97 to −31.12)
−9.28 ± 9.73
(−0.97 to −31.12)
−7.46 ± 6.52
(−0.97 to −30.55)
0.0932
Note: By Mann–Whitney’s U-test.
Abbreviations: OAG, open-angle glaucoma; HTG, high-tension glaucoma; NTG, normal-tension glaucoma; MD, mean deviation; TD, total deviation.
Dovepress
Fukuchi et al
However, the pathogenesis of glaucomatous optic neuropathy and its long-term progression are still unknown.
Patients with open-angle glaucoma, primary open-angle glaucoma, and normal-tension glaucoma require man-agement and follow-up in the long term, and essentially for a lifetime. Thus, with longer-term follow-up, we can understand more about the disease course of open-angle glaucoma. The treatment for glaucoma, ie, lowering of IOP, is not free from risk.15,16 We have to achieve a balance
between treatment intensity and disease severity, such as stage of glaucoma, life expectancy, and rate of progression. Over two decades have passed since standard automated perimetry was introduced into clinical practice for the man-agement and monitoring of glaucoma. A lot of clinical data from glaucomatous patients have been accumulated using standard automated perimetry. The results of multicenter trials have set a number of different criteria and scoring methods to evaluate progression of glaucomatous visual field defects.3–14,17–31 When the visual field defect crossed the
criteria or the scores increased, it was judged as progression. We can therefore understand the prevalence of progressive cases. Although there are rare cases of rapid progression, open-angle glaucoma progresses slowly, but exactly, as seen in careful examination over a 10-year period in general.9 The
progression rate of visual field defects should be known so that advances in the management and treatment of open-angle glaucoma can be evaluated.
The primary purpose of treatment for glaucoma is to maintain the patient’s quality of life and quality of vision. The severity of the condition of the visual field should be
calculated in each patient and the expected progressive rate of the visual field defects. Glaucomatous visual field has a character to change by upper and lower segments independently. We have been able to analyze the area and progression of visual field defects by total fields as well as by upper and lower visual fields separately. From the standpoints of quality of life and quality of vision, the lower visual field is more susceptible to subjective symptoms.32–35
When we evaluate the severity and the progression of the glaucomatous visual field defects, we have to precede the lower visual field.
In this study we evaluated the progression rate of the total as well as the upper and lower visual field defects separately from a series of standard automated perimetry results of open-angle glaucoma patients who had been managed and followed up in the middle to long term for up to 19 years. Furthermore, we classified open-angle glaucoma into higher and lower IOP groups and compared these two groups.
Patients and methods
Patient selection
A total of 323 open-angle glaucoma patients (544 eyes) from the Ophthalmology Clinic at the Niigata University Medical and Dental Hospital were recruited according to the following inclusion and exclusion criteria. Overall profiles of the patients are shown in Table 1. We separated open-angle glaucoma patients into two groups according to their maximum IOP, ie, high-tension glaucoma (. 21 mmHg) and normal-tension glaucoma (#21 mmHg).
Clinical Ophthalmology downloaded from https://www.dovepress.com/ by 118.70.13.36 on 21-Aug-2020
Dovepress Visual field defect progression in OAG
inclusion criteria
• A diagnosis of primary open-angle glaucoma or normal-tension glaucoma based on clinical examinations by slit lamp, optic disc, and visual field with the normal anterior chamber angle. Clinical diagnosis of each glaucoma type was according to the guidelines of the European Glaucoma Society36 and the Japan Glaucoma
Society37
• Ages at the initial examination between 30 and 80 years
• Follow-up for at least four years with reliable (fix loss, pseudopositive, and negative, less than 30%) results at least five times by the Humphrey Field Analyzer (Carl Zeiss Medthec Inc., Dublin, CA) using the Full-Threshold 30-2 program
• Reproducible glaucomatous visual field defects by Anderson and Patella’s criteria38 and mean
devia-tion (MD) 0 dB or lower both at the initial and final examinations.
When glaucoma surgery was performed, follow-up was ended or started at that time point. A longer duration of follow-up either before or after surgery was chosen for this study as following the same criteria. Cataract surgery was permitted, but if the IOP or visual field changed significantly before or after the surgery, we used the same approach as for the glaucoma surgery.
exclusion criteria
• Refractive errors (spherical equivalent power less than −6 D or more than +6 D)
• Corrected visual acuity under 20/40
• Combination with cataract, which possibly influences the visual acuity and visual field. Eyes with reduction of three or more steps in corrected visual acuity due to cataract progression were excluded
• Overlap of other types of glaucoma, such as primary angle-closure glaucoma, pseudoexfoliation glaucoma, and steroid-induced glaucoma. Cases with a shallow anterior chamber under Grade 2 or a van Herick’s or Shaffer’s classification were excluded
• Combination of congenital optic disc anomalies (tilted disc syndrome, optic nerve hypoplasia, optic disc pit, or coloboma) or retinal diseases (diabetic retinopathy, retinal vein or artery occlusion, acquired macular degeneration, central serous chorioretinopathy)
• Possibility of other optic nerve disease (eg, optic neuritis, anterior ischemic optic neuropathy)
• Intracranial lesions or trauma possibly associated with visual field defects.
study visit
Patients were observed every three months. The study visits included IOP measurements with the Goldmann Applanation Tonometer. Perimetry was performed with the Humphrey Field Analyzer using the Full-Threshold 30-2 program at least once a year. Patients also underwent best-corrected visual acuity measurements and a standard eye examination including slit-lamp and ophthalmoscopic examinations.
Analysis of visual field
The progressive rate of the total visual field defect was evaluated by the MS slope on the Humphrey Field Analyzer. Those of the upper and lower visual field defects were also evaluated using the upper and lower total deviation slopes (upper TD slope and lower TD slope). A linear regression analysis was performed by a Windows-based PC program, HfaFiles ver.5 (Beeline Office Co., Tokyo), to calculate the MD slope, and the upper and lower TD slope. The first two or three visual field results were excluded in order to minimize learning effects. No reliable, unexpected, or unreasonable results were excluded. From our preliminary study using the same patients, the MD slope as well as the TD slope might not be suitable for the analysis of the progressive rates in cases with severe visual field defects. Thus, we excluded eyes with an initial MD under −20 dB and an initial upper or lower TD under −23 dB from each examination.
Visual field progression
Progression analysis for glaucomatous visual field using a statistical linear regression analysis has been called trend-type analysis.39 In eyes associated with a significant negative
correlation against time progress statistically, it is decided as progression in this system. So when the eyes had a negative value (,0 dB/year) for MD slope, and upper or lower TD slope, and a P value under 5%, in the study they were eyes with statistically significant progression. The cases were included in the group of “statistical progression” in this study. The exact evaluation using the trend-type analysis requires more visual field examinations in the longer term than that of the event analysis. If the visual field results were too vari-able, it was often hard to evaluate as statistically significant progression, even with long-term follow-up or rapid progres-sion. Thus, we set different criteria for the progression, ie, “rapid progression” for the MD slope, and upper or lower TD slope under -1.0 dB/year, and “moderate progression” for those under -0.5 dB/year.
Clinical Ophthalmology downloaded from https://www.dovepress.com/ by 118.70.13.36 on 21-Aug-2020
Dovepress
Fukuchi et al
statistical analysis
The Chi-square test was used for the comparison of gender, sides affected, and prevalence of “statistical progression”, “rapid progression”, or “moderate progression” between high-tension glaucoma and normal-tension glaucoma. Mean age, follow-up duration, follow-up IOP, MD, upper and lower TD at initial examination, MD slope, and upper and lower TD slope were compared between high-tension glaucoma and normal-tension glaucoma using the Mann–Whitney U-test.
Results
Finally, 485 eyes from 305 cases for the MD slope, 458 eyes from 293 cases for the upper TD slope, and 510 eyes from 302 cases for the lower TD slope were enrolled in the analysis from the initial 544 eyes from 325 cases with open-angle glaucoma (Tables 2, 3, and 4). Although the initial MD was −7.75 ± 5.30 (mean ± SD) dB at 57.3 ± 10.8 years, the visual field defects progressed with −0.41 ± 0.50 db/year of the MD slope during 8.91 ± 3.80 years of follow-up. The initial upper TD was −9.16 ± 10.8 dB and the upper TD slope was −0.46 ± 0.65 dB/year. Instead, the lower TD slope was
−0.32 ± 0.53 dB/year during 8.80 ± 3.77 years of follow-up from −7.11 ± 6.02 dB of the initial lower TD.
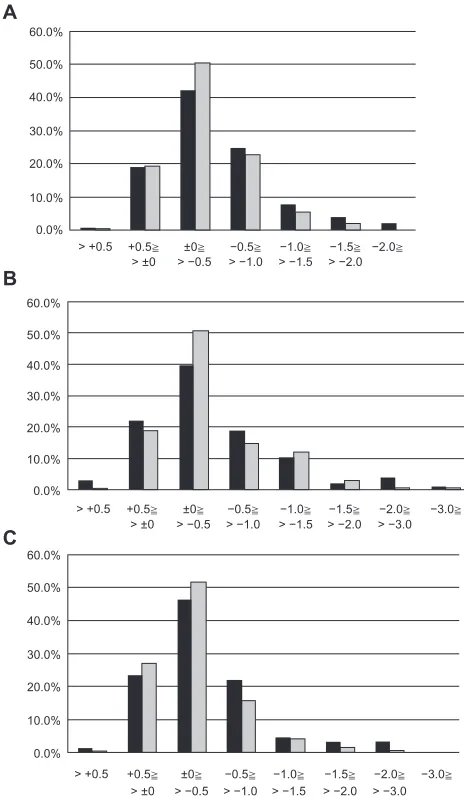
The frequency distribution of the MD slope for high-tension glaucoma and normal-high-tension glaucoma is shown in Figure 1A. In both the high-tension glaucoma and normal-tension glaucoma groups, eyes with an MD slope between 0 and −0.5 dB/year were seen most frequently. The frequency of an MD slope between 0 and −0.5 dB/year was greater in normal-tension glaucoma than in high-tension glaucoma. In the cases studied for MD slope evaluation, the mean
follow-up term; initial age; initial MD; MD slope; and number of eyes with statistical progression, rapid progres-sion, or moderate progression in open-angle glaucoma, high-tension glaucoma, and normal-tension glaucoma are shown in Table 2. There was no statistically significant dif-ference in mean follow-up duration and initial MD between high-tension and normal-tension glaucoma. The prevalence of statistical progression was similar between the two groups. However, the mean MD slope was lower and there were more eyes with moderate or rapid progression in the high-tension glaucoma group than in the normal-tension glaucoma group.
The frequency distribution of the upper TD slope with high-tension and normal-tension glaucoma is shown in Figure 1B. The upper TD slope was from over 0.5dB/year to under −3dB/year, so it was distributed in a wider range than for those of the MD slope and lower TD slope. Com-paring the MD slope and the lower TD slope, it was signifi-cant that the frequency of the upper TD slope was greater in normal-tension glaucoma (from −1.0 to −2.0 dB/year) than in high-tension glaucoma (Table 3). For the upper TD slope, the results for mean follow-up duration, initial upper TD, TD slope, and the prevalence of statistical progression, rapid progression, and moderate progression were quite similar between high-tension glaucoma and normal-tension glaucoma.
The frequency distribution of the lower TD slope is pre-sented in Figure 1C. Distribution of the lower TD slope was quite similar to that of the MD slope. As with the MD slope, there were no statistical differences in the mean follow-up term and initial lower TD between high-tension glaucoma
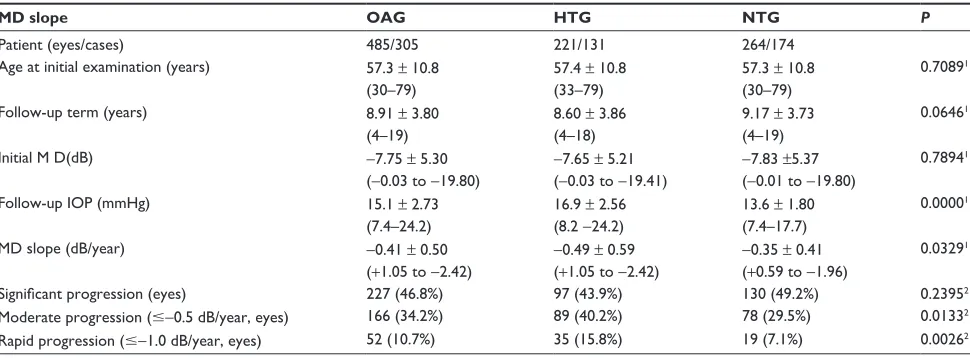
Table 2 The profiles of the patients enrolled into mean deviation (MD) slope analysis and the results. (mean ± standard deviation and range)
MD slope OAG HTG NTG P
Patient (eyes/cases) 485/305 221/131 264/174
Age at initial examination (years) 57.3 ± 10.8 (30–79)
57.4 ± 10.8 (33–79)
57.3 ± 10.8 (30–79)
0.70891
Follow-up term (years) 8.91 ± 3.80
(4–19)
8.60 ± 3.86 (4–18)
9.17 ± 3.73
(4–19)
0.06461
initial M D(dB) −7.75 ± 5.30
(−0.03 to −19.80)
−7.65 ± 5.21 (−0.03 to −19.41)
−7.83 ±5.37
(−0.01 to −19.80)
0.78941
Follow-up IOP (mmHg) 15.1 ± 2.73 (7.4–24.2)
16.9 ± 2.56 (8.2 −24.2)
13.6 ± 1.80 (7.4–17.7)
0.00001
MD slope (dB/year) −0.41 ± 0.50
(+1.05 to −2.42)
−0.49 ± 0.59 (+1.05 to −2.42)
−0.35 ± 0.41 (+0.59 to −1.96)
0.03291
Significant progression (eyes) 227 (46.8%) 97 (43.9%) 130 (49.2%) 0.23952 Moderate progression (#−0.5 dB/year, eyes) 166 (34.2%) 89 (40.2%) 78 (29.5%) 0.01332 rapid progression (#−1.0 dB/year, eyes) 52 (10.7%) 35 (15.8%) 19 (7.1%) 0.00262 Notes: 1By Mann–Whitney’s U-test; 2 By Chi-square test.
Abbreviations: OAG, open-angle glaucoma; HTG, high-tension glaucoma; NTG, normal-tension glaucoma; MD, mean deviation; TD, total deviation; IOP, intraocular pressure.
Clinical Ophthalmology downloaded from https://www.dovepress.com/ by 118.70.13.36 on 21-Aug-2020
Dovepress Visual field defect progression in OAG
and normal-tension glaucoma (Table 4). The mean lower TD slope was lower and there were more eyes with rapid and moderate progression in the high-tension glaucoma group than in the normal-tension glaucoma group. The prevalence of statistical progression was similar between the groups.
Discussion
In this study we retrospectively evaluated the rate of progres-sion of visual field defects in Japanese open-angle glaucoma patients whom we followed in the middle to long term for up to 19 years. Many previous studies, including multicenter trials, had evaluated the progression of glaucomatous visual field defects by setting the criteria or grading to be used for the duration of follow-up.3–14,17–27 In general, life-table analysis
was used in these studies to reflect the rate of progression. The present study evaluated the progression rate directly, so it is different from a number of previous investigations. In addition, we analyzed eyes separately using total, and upper and lower visual fields. No similar studies were identified in a literature search.
Trend-type analysis39 and event-type analysis40,41 are
known to be two representative methods for detecting or evaluating glaucomatous visual field defect progression using standard automated perimetry. Trend-type analysis using the MD slope or TD slope can show the progression trend more exactly, as well as the progression rate or speed of the visual field defect. Mean progression rate of the total visual field in open-angle glaucoma patients was −0.41 dB/year in the
Table 3 The profiles of the patients enrolled into upper total deviation (upper TD) slope analysis and the results. (mean ± standard deviation and range)
Upper TD slope OAG HTG NTG P
Patients (eyes/cases) 458/293 210/127 248/166
Age at initial examination (years) 57.1 ± 10.6 (30–79)
57.2 ± 10.6 (33–74)
57.1 ± 10.7 (30–79)
0.74651
Follow-up duration (years) 8.88 ± 3.81
(4–19)
8.57 ± 3.86 (4–18)
9.13 ± 3.77
(4–19)
0.08451
initial upper TD (dB) −9.16 ± 10.8
(−0.18–22.97)
−9.00 ± 6.30
(−0.18–22.97)
−9.29 ± 6.94
(−0.43 to −22.97)
0.97121
Follow-up IOP (mmHg) 15.0 ± 2.76 (6.1–24.2)
16.7 ± 2.77 (6.1–24.2)
13.6 ± 1.78 (7.4–17.7)
0.00001
Upper TD slope (dB/year) −0.46 ± 0.65
(+0.85 to −3.62)
−0.51 ± 0.75
(+0.84 to −3.62)
−0.41 ± 0.55 (+0.85 to −3.05)
0.55211
Significant progression (eyes) 191 (41.7%) 83 (39.5%) 108 (43.5%) 0.38412 Moderate progression (#−0.5 dB/year, eyes) 165 (36.0%) 84 (40.0%) 81 (32.6%) 0.10312 rapid progression (#−1.0 dB/year, eyes) 81 (17.6%) 42 (20.0%) 39 (15.7%) 0.23232 Notes:1By Mann–Whitney’s U-test; 2By Chi-square test.
Abbreviations: OAG, open-angle glaucoma, HTG, high-tension glaucoma; NTG, normal-tension glaucoma; MD, mean deviation; TD, total deviation.
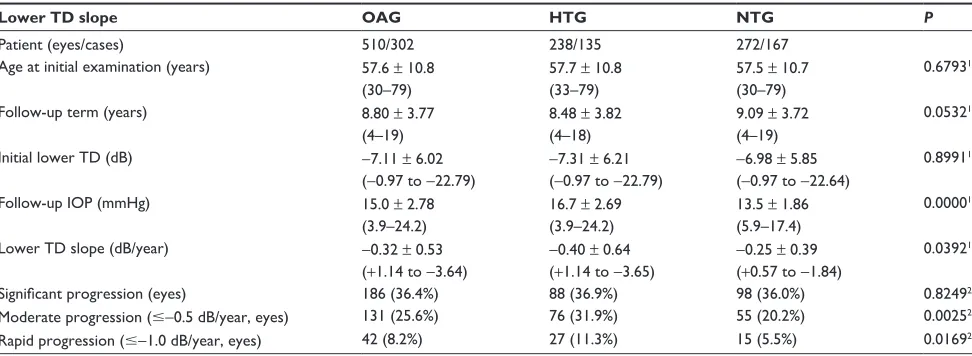
Table 4 The profiles of the patients enrolled into the lower total deviation (lower TD) slope analysis and the results. (mean ± standard deviation and range)
Lower TD slope OAG HTG NTG P
Patient (eyes/cases) 510/302 238/135 272/167
Age at initial examination (years) 57.6 ± 10.8 (30–79)
57.7 ± 10.8 (33–79)
57.5 ± 10.7 (30–79)
0.67931
Follow-up term (years) 8.80 ± 3.77
(4–19)
8.48 ± 3.82 (4–18)
9.09 ± 3.72
(4–19)
0.05321
initial lower TD (dB) −7.11 ± 6.02
(−0.97 to −22.79)
−7.31 ± 6.21
(−0.97 to −22.79)
−6.98 ± 5.85
(−0.97 to −22.64)
0.89911
Follow-up IOP (mmHg) 15.0 ± 2.78
(3.9–24.2)
16.7 ± 2.69
(3.9–24.2)
13.5 ± 1.86 (5.9–17.4)
0.00001
Lower TD slope (dB/year) −0.32 ± 0.53 (+1.14 to −3.64)
−0.40 ± 0.64
(+1.14 to −3.65)
−0.25 ± 0.39 (+0.57 to −1.84)
0.03921
Significant progression (eyes) 186 (36.4%) 88 (36.9%) 98 (36.0%) 0.82492 Moderate progression (#−0.5 dB/year, eyes) 131 (25.6%) 76 (31.9%) 55 (20.2%) 0.00252 rapid progression (#−1.0 dB/year, eyes) 42 (8.2%) 27 (11.3%) 15 (5.5%) 0.01692 Notes:1By Mann–Whitney’s U-test; 2By Chi-square test.
Abbreviations: OAG, open-angle glaucoma, HTG, high-tension glaucoma; NTG, normal-tension glaucoma; MD, mean deviation; TD, total deviation.
Clinical Ophthalmology downloaded from https://www.dovepress.com/ by 118.70.13.36 on 21-Aug-2020
Dovepress
Fukuchi et al
MD slope. This indicates that it would take 25 years for a decrease of 10 dB in standard automated perimetry to occur if the cases progressed at a similar rate. Although the prog-nosis might be better for patients diagnosed at an early stage, patients with a middle or late stage of visual field defect might have to expect subjective impairment during their lifetime. Comparing high-tension and normal-tension glaucoma, those with high-tension glaucoma progressed faster than those with normal-tension glaucoma. Progression in the upper visual field was faster than that in the lower visual field, and this phenomenon was more marked in normal-tension glaucoma. Although the progression rate in the upper visual field was similar between high-tension and normal-tension glaucoma, the progression rate in the lower visual field was slower in normal-tension glaucoma than that in high-tension glaucoma.
Thus, the difference in progression rate for the total visual field between high-tension and normal-tension glaucoma might depend on the difference in the lower visual field.
EMGT5–7 is a study that included patients with IOP #
30 mmHg and −16 dB or better of MD who were similar to those in our study. Heijil et al7 reported that −0.05 dB/month
in MD slope without treatment increased to −0.03 dB/month with treatment. On the other hand, the CNTGS reported that the MD slope in normal-tension glaucoma cases was
−0.41 dB/year without treatment.9 Another report from the
CNTGS evaluated the benefits of lowering IOP by various background factors using the MD slope.10 Although the MD
slopes in untreated cases were about between −0.35 and
−0.6 dB/year, those in treated cases improved at a rate of around −0.2 to −0.35 dB/year. Treated MD slopes from both the EMGT and CNTGS appear similar to our results.
The disadvantages of trend-type analysis are that it is possible that local progression in the visual field can be disclaimed by general stability, and that this analysis needs a longer follow-up duration and more field examinations than event-type analysis for correct assessment. Although the patients with good reliability and reproducibility can be evaluated for statistical progression over shorter peri-ods, others are often hard to evaluate, even with long-term follow-up. Therefore, we set three different criteria for visual field progression, ie, statistical progression (MD slope , 0 dB/year and P , 0.05), moderate progression (MD slope # −0.5 dB/year), and rapid progression (MD slope # −1.0dB/year). Statistically significant progression was detected in 47.2% in total, and 40.8% in upper and 37.3% in lower visual fields. There was no difference between high-tension glaucoma and normal-tension glaucoma. The cases of 10.1% in total, 16.1% in upper, and 7.9% in lower visual fields were classified as rapid progression. With regard to total and lower visual fields, fewer normal-tension glaucomatous eyes showed rapid progression than eyes with high-tension glaucoma. Eyes with moderate progression comprised 33.6% in total, with 32.6% of upper and 25.9% of lower visual fields. In summary, the progression rates in the upper visual field might be faster than those in the lower visual field, and the progression rate of total and lower visual fields with high-tension glaucoma might be faster than in those with normal-tension glaucoma.
Several previous studies have discussed the similari-ties and differences between visual field defects associated with primary open-angle glaucoma and normal-tension glaucoma.28–31,42–44 Glaucomatous visual field defects are
often identified in the upper field, both in primary open-angle
A
B
C
60.0%
50.0%
40.0%
30.0%
20.0%
10.0%
0.0% > +0.5
> −0.5 > −1.0 > −1.5 > −2.0 +0.5 ±0
> ±0
−0.5 −1.0 −1.5 −2.0
60.0%
50.0%
40.0%
30.0%
20.0%
10.0%
0.0% > +0.5
> −0.5 > −1.0 > −1.5 > −2.0 > −3.0 +0.5 ±0
> ±0
−0.5 −1.0 −1.5 −2.0 −3.0
60.0%
50.0%
40.0%
30.0%
20.0%
10.0%
0.0% > +0.5
> −0.5 > −1.0 > −1.5 > −2.0 > −3.0 +0.5 ±0
> ±0
−0.5 −1.0 −1.5 −2.0 −3.0
Figure 1 Frequency distributions of mean deviation (MD) slope A), upper total deviation (upper TD) slope B) and lower total deviation (lower TD) slope C) in the patients with hTg (black bar) and nTg (gray bar).
Clinical Ophthalmology downloaded from https://www.dovepress.com/ by 118.70.13.36 on 21-Aug-2020
Dovepress Visual field defect progression in OAG
glaucoma and normal-tension glaucoma.42–45 Araie et al29
reported that an area just above the horizontal meridian was significantly more depressed in normal-tension glaucoma, whereas high-tension glaucoma had significantly more diffuse visual field damage. Caprioli and Spaeth30 showed
that scotoma in the low-tension group had a steeper slope, was significantly closer to the fixation, and had greater depth than in those from the high-tension group. Chauhan et al31
mentioned that individuals with normal-tension glaucoma had larger areas with normal sensitivity, and hence more localized damage. With progression, normal-tension glau-coma in the early stage trends towards local depression, particularly in the upper central and upper nasal visual fields. Thus, although it has been recognized that both primary open-angle glaucoma and normal-tension glaucoma have a similar progression pattern, the visual field defect is often seen in a more localized upper area with normal-tension glaucoma, but generally in a more diffuse area with primary open-angle glaucoma. Our results might confirm the difference in visual field defect between primary open-angle glaucoma and normal-tension glaucoma in terms of progression rate. The issue of whether normal-tension glaucoma is different from primary open-angle glaucoma remains a matter of debate. We cannot distinguish between primary open-angle glaucoma and normal-tension glaucoma exactly on the basis of IOP, because individual IOP is variable. In this study, we separated high-tension glaucoma and normal-tension glaucoma according to the maximum recorded IOP, so both high-tension glaucoma and normal-tension glaucoma groups must include overlap or immediate cases. Nevertheless, the results showed weak but significant differences between normal-tension glaucoma and high-tension glaucoma in the progressive nature of visual field defects.
The results of this study might be useful when considering the visual prognosis in open-angle glaucoma. Recently, some research has been done on the relationship between visual field defects and quality of vision (QOV) in glaucomatous patients.32–35 Lower visual field defects, particularly in the
central visual field, are closely related to subjective symptoms as well as to QOV.
Generally, visual field defects under −20 dB of MD by Humphrey Field Analyzer influence to the worse for visual subjective. Almost all cases under −25dB of MD are incon-venienced, and this level is sometimes called functional blindness. We have to maintain the aim for each individual glaucomatous patient to not reach visual impairment during their lifetime. We always have to take into account in our clinical practice how much progression we can permit and
how much we must prevent. Evaluation of the progression rate of visual field defects, particularly in the upper and lower fields, taking into account area, degree of defect, and age is necessary for the effective and safe management of open-angle glaucoma patients.
This study is important because it includes a large amount of clinical information from a big group of open-angle glau-coma patients, with long-term follow-up. However, the study does have some limitations. Faster and more progressive cases may have been missed at the enrolment of study patients. In a report from the CNTGS,9 the fast progressive eye under
−1.0 dB/year were quite a few in the eyes with more than three years of follow-up of treatment. The cases over 0 dB were hard to calculate for the MD slope or TD slope even if they satisfied Anderson and Patella’s glaucoma criteria. Cases under −20 dB of MD or under −23 dB of upper or lower TD were also excluded. These cases were too severe for the progression rate to be evaluated by MD slope or TD slope from preliminary examination. Fortunately, the clinical back-grounds in the finally selected cases were similar between the high-tension glaucoma and normal-tension glaucoma patients. Therefore, the results indicate that high-tension glaucoma and normal-tension glaucoma might be differ-ent in progression rate for the total and lower visual fields. Furthermore, this study included patients followed up from a long time ago. The eyedrops used, as well as treatment targets, were different from the more recent research.43 We have to
consider that the results may not reveal the prognosis of the patients whom we are presently managing and following up. Information about patient backgrounds and other factors, including general history, central corneal thickness, and disc hemorrhage, was incomplete because of the retrospective nature of the study. The complete exclusion of cataract-associated cases whose visual field results were influenced would be difficult. In particular, the analysis of upper and lower visual fields must be influenced by using the TD as in this study. All cases with repeated glaucoma surgery that are too variable for follow-up IOP or with unreliable visual field results were also excluded. In addition, we had not set treat-ment targets for this study. We have had to take these factors into consideration when interpreting our results.
Using the same patients, we determined that high-tension glaucoma and normal-high-tension glaucoma have a weak but statistically significant correlation between IOP and the progression rate of visual field defects. This means that the higher the IOP, the faster the progression of visual field defects. The differences in progression rate between high-tension glaucoma and normal-tension glaucoma were
Clinical Ophthalmology downloaded from https://www.dovepress.com/ by 118.70.13.36 on 21-Aug-2020
Dovepress
Fukuchi et al
reasonable in the lower field. The similarity in the upper visual field may be incompatible. In a further investigation, we are examining the relationship between rate of visual field defect progression and follow-up IOP, and IOP reduction and related factors in the upper and lower visual fields. Improved medication in glaucoma has definitely resulted in lower follow-up IOP.45 Also, the progression rate of visual field
defects in open-angle glaucoma patients may have altered from 10 years ago. We can confirm the true improvement in glaucoma therapy by evaluation of IOP, as well as suppres-sion of progressive rate.
Although this study showed the managed course of open-angle glaucoma patients rather than the natural history of progression, it gives us a better understanding of the disease course and its progression, evaluation of long-term treatment, and likely prognosis in open-angle glaucoma.
Disclosure
The authors report no conflicts of interest in this work.
References
1. Thylefors B, Negrel AD. The global impact of glaucoma. Bull World Health Organ. 1994;72(3):323–326.
2. Quigley HA, Broman AT. The number of people with glaucoma world-wide in 2010 and 2020. Br J Ophthalmol. 2006;90(3):262–267. 3. Kass MA, Heuer DK, Higginbotham EJ, et al. The Ocular
Hypertension Treatment Study: a randomized trial determines that topical ocular hypotensive medication delays or prevents the onset of primary open-angle glaucoma. Arch Ophthalmol. 2002;120(6):701–713.
4. Gordon MO, Beiser JA, Brandt JD, et al. The Ocular Hypertension Treatment Study: baseline factors that predict the onset of primary open-angle glaucoma. Arch Ophthalmol. 2002;120(6):714–720. 5. Leske MC, Heijl A, Hyman L, et al. Early manifest glaucoma trial:
design and baseline data. Ophthalmology. 1999;106(11):2144–2153. 6. Leske MC, Heijl A, Hussein M, et al. Factors for glaucoma progression
and the effect of treatment: the Early Manifest Glaucoma Trial. Arch Ophthalmol. 2003;121(1):48–56.
7. Heijl A, Leske MC, Bengtsson B, et al. Reduction of intraocular pressure and glaucoma progression: results from the Early Manifest Glaucoma Trial. Arch Ophthalmol. 2002;120(10):1268–1279. 8. Collaborative normal-tension glaucoma study group. Comparison of
glaucomatous progression between untreated patients with normal tension glaucoma and patients with therapeutically reduced intraocular pressures. Am J Ophthalmol. 1998;126(4):487–497.
9. Collaborative normal-tension glaucoma study group. Natural history of normal-tension glaucoma. Ophthalmology. 2001;108(2): 247–253.
10. Anderson DR, Drance SM, Schulzer M. The Collaborative Normal-tension Glaucoma Study Group: Factors that predict the benefit of lowering intraocular pressure in normal tension glaucoma. Am J Ophthalmol. 2003;136(5):820–829.
11. The Advanced Glaucoma Intervention Study Investigators. Advanced Glaucoma Intervention Study. 2. Visual field test scoring and reliability. Ophthalmology. 1994;101(8):1445–1455.
12. The AGIS Investigators. Advanced Glaucoma Intervention Study (AGIS):7. The relationship between control of intraocular pressure and visual field deterioration. Am J Ophthalmol. 2000;130(4):429–440.
13. Nouri-Mahdavi K, Hoffman D, Coleman AL, et al. Predictive factors for glaucomatous visual field progression in the Advanced Glaucoma Intervention Study. Ophthalmology. 2004;111(9):1627–1635. 14. Chauhan BC, Mikelberg FS, Balaszi G, et al. Canadian Glaucoma
Study, 2. Risk factors for the progression of open-angle glaucoma. Arch Ophthalmol. 2008;126(10):1030–1036.
15. Goldberg I. Relationship between intraocular pressure and preservation of visual field in glaucoma. Surv Ophthalmol. 2003;48:S3–S7. 16. Allingham RR, Damji K, Freedman S, et al. Management of the
glau-coma patients. In: Shields’ Textbook of Glaucoma. 5th ed. Lippincott Williams & Wilkins: Philadelphia, PA, 2005, pp 437–445.
17. Armaly MF, Krueger DE, Maunder L, et al. Biostatistical analy-sis of collaborative glaucoma study, I: summary report of the risk factors for glaucomatous visual field defects. Arch Ophthalmol. 1980;98(12):2163–2171.
18. Wilson R, Walker AM, Dueker DK, Crick RP. Risk factors for rate of progression of glaucomatous visual field loss: a computer-based analysis. Arch Ophthalmol. 1982;100(5):737–741.
19. Richler M, Werner EB, Thomas D. Risk factors for progression of visual field defects in medically treated patients with glaucoma. Can J Ophthalmol. 1982;17(6):245–248.
20. Ishida K, Yamamoto T, Kitazawa Y. Clinical factors associated with progression of normal-tension glaucoma. J Glaucoma. 1998; 7(6):372–377.
21. Daugeliene L, Yamamoto T, Kitazawa Y. Risk factors for visual field damage progression in normal-tension glaucoma eyes. Graefe’s Arch Clin Exp Ophthalmol. 1999;237(2):105–108.
22. Suzuki Y, Shirato S, Adachi M, Hamada C. Risk factors for the progression of treated primary open-angle glaucoma: a multivariate life-table analysis. Graefe’s Arch Clin Exp Ophthalmol. 1999; 237(6):463–467.
23. Chen PP, Park RJ. Visual field progression in patients with initially unilateral visual field loss from chronic open-angle glaucoma. Ophthalmology. 2000;107(9):1688–1692.
24. Stewart WC, Kolker AE, Sharpe ED, et al. Factors associated with long-term progression or stability in primary open-angle glaucoma. Am J Ophthalmol. 2000;130(3):274–279.
25. Drance S, Anderson DR, Schulzer M. Risk factors for progres-sion of visual field abnormalities in normal-tenprogres-sion glaucoma. Am J Ophthalmol. 2001;131(6):699–708.
26. Tezel G, Siegmund KD, Trinkaus K, et al. Clinical factors associ-ated with progression of glaucomatous optic disc damage in treassoci-ated patients. Arch Ophthalmol. 2001;119(6):813–818.
27. Araie M, Sekine M, Suzuki Y, Koseki N. Factors contributing to the progression of visual field damage in eyes with normal-tension glau-coma. Ophthalmology. 1994;101(3):1440–1444.
28. Drance SM, Douglas GR, Airaksinen PJ, et al. Diffuse visual field loss in chronic open-angle glaucoma Am J Ophthalmol. 1987;104(6):577–580.
29. Araie M, Yamagami J, Suzuki Y. Visual field defects in normal-tension glaucoma and high-normal-tension glaucoma. Ophthalmology. 1993;100(12):1808–1814.
30. Caplioli J, Spaeth GL. Comparison of visual field defects in the low-tension glaucoma with those in the high-low-tension glaucomas. Am J Ophthalmol. 1984;97(6):730–737.
31. Chauhan BC, Drance SM, Douglas GR, Johnson CA. Visual field dam-age in normal-tension and high-tension glaucoma. Am J Ophthalmol. 1989;108(6):636–642.
32. Gutierrez P, Wilson MR, Johnson C, et al. Influence of glaucomatous visual field loss on health-related quality of life. Arch Ophthalmol. 1997;115(6):777–784.
33. Parrish RK 2nd, Gedde SJ, Scott IU, et al. Visual function and quality of life among patients with glaucoma. Arch Ophthalmol. 1997;115(11):1447–1455.
34. McKean-Cowdin R, Wang Y, Wu J, et al. Impact of visual field loss on health related quality of life in glaucoma. The Los Angeles Latino Eye Study. Ophthalmology. 2007;115(6):941–948.
Clinical Ophthalmology downloaded from https://www.dovepress.com/ by 118.70.13.36 on 21-Aug-2020
Clinical Ophthalmology
Publish your work in this journal
Submit your manuscript here:http://www.dovepress.com/clinical-ophthalmology-journal
Clinical Ophthalmology is an international, peer-reviewed journal covering all subspecialties within ophthalmology. Key topics include: Optometry; Visual science; Pharmacology and drug therapy in eye diseases; Basic Sciences; Primary and Secondary eye care; Patient Safety and Quality of Care Improvements. This journal is indexed on
PubMed Central and CAS, and is the official journal of The Society of Clinical Ophthalmology (SCO). The manuscript management system is completely online and includes a very quick and fair peer-review system, which is all easy to use. Visit http://www.dovepress.com/ testimonials.php to read real quotes from published authors.
Dovepress
Dovepress
Visual field defect progression in OAG35. Sumi I, Shirato S, Matsumoto S, Araie M. The Relationships between Visual Disability in Patients with Glaucoma. Ophthalmology. 2003;110(2):332–339.
36. European Glaucoma Society. Terminology and Guidelines for Glaucoma. 3rd ed. 2008. Available from: http://www.eugs.org/eng/ EGS_guidelines.asp. Accessed 2010 Feb 28.
37. Japan Glaucoma Society. Guidelines for Glaucoma. Tokyo, Japan: Japan Glaucoma Society; 2002.
38. Anderson DR, Patella VM. Automated static perimetry, 2nd ed. CV Mosby: St. Louis, MO, 1993, pp 121–190.
39. Flammer J. The concept of visual filed indices. Graefes Arch Clin Exp Ophthalmol. 1986;224(5):389–392.
40. Hoddap E, Parrish IRA, Anderson DR. Clinical detection in glaucoma. CV Mosby: St. Louis, MO, 1993, pp 84–126.
41. Viswanathan AC, Fitzke FW, Hitchings RA. Early detection of visual field progression in glaucoma: a comparison of PROGRESSOR and STATPAC 2. Br J Ophthalmol. 1997;81(12):1037–1042.
42. Lewis RA, Hayreh SS, Phelps CD. Optic disc and visual field correlations in primary open-angle and low-tension glaucoma. Am J Ophthalmol. 1983;96(2):148–152.
43. Grave EL, Geijssen C. Comparison of glaucomatous visual field defects in patients with high and low intraocular pressures. In: Grave EL, Heijil A, editors. 5th international visual field symposium, Dr W Junk: Hague, 1983, pp101–105.
44. Anderson DR, Hitchings R. A comparative study of visual field of patients with low-tension glaucoma and those with chronic simple glaucoma. In: Grave EL, Heijil A, editors. 5th international visual field symposium, Dr W Junk: Hague, 1983, pp97–99.
45. Cantor L. Achieving low target pressure with today’s glaucoma medications. Surv Ophthalmol. 2003;48:S8–S16.
Clinical Ophthalmology downloaded from https://www.dovepress.com/ by 118.70.13.36 on 21-Aug-2020