A Method for Exemplar Based Inpainting By
Combining Graph Based Segmentation and
Diffused Expectation Maximization Algorithm
Ajana Ajayakumar, Monisha Menon
M.Tech Student, Dept. of E.C.E, Marian Engineering College, Kazhakootam India Assistant Professor, Dept. of E.C.E, Marian Engineering College, Kazhakootam, India
ABSTRACT: Image inpainting is a method of restoring lost, deteriorated, damaged or selected portion of an image by
making use of the neighboring information. Inpainting should be such that, the inpainted image when viewed by any casual observer should feel a visually pleasing continuous flow of data in and around the inpainted region. This paper proposes a method for image inpainting using DEMA (Diffused Expectation Maximization Algorithm) and GBS (Graph Based Segmentation) and compares it with the inpainting using GBS only. Here an Exemplar-based in-painting method is adopted, which iteratively search the neighboring region (source region) and fill the missing region (target region), with the most suited patches from the source region. The proposed method uses graph based segmentation along with diffused expectation maximization algorithm to improve the performance of inpainting. In Graph Based Segmentation method the spatial information in the source region is utilized .This method selects the parameter values of the robust priority function and thereby determines the most suited patch size and reduces the search region. The number of segments obtained from GBS is used in DEMA thereby we get a DEMA segmented image which is once again graph based segmented in order to get the parameter value of the DEMA segmented image. This parameter value along with the segmented image is passed through an exemplar based inpainting algorithm forming a better inpainted image. Certain parameters to evaluate the performance of the proposed algorithm is also done. Experimental results with a number of test images shows the effectiveness of the proposed method.
KEYWORDS: Diffused Expectation Maximization, Graph Based Segmentation, Exemplar Based Inpainting,
Inpainting
I. INTRODUCTION
II. RELATED WORK
Diffusion based inpainting and Exemplar based inpainting are the two main methods used in inpainting. In case of diffusion based inpainting, which was the first digital Inpainting approach, where the missing region is filled by diffusing the image information from the known region into the missing region at the pixel level. These algorithms are based on theory of variational method and Partial Differential equation (PDE).The diffusion based Inpainting algorithm produces good results by filling the non-textured or relatively smaller missing region. The main disadvantages of the diffusion process is that it introduces some blur, which will be noticeable while filling larger regions. All the PDE based inpainting models are more suitable for completing small, non-textured target region. The second category of Inpainting is exemplar- based Inpainting algorithm. This method of Inpainting is an efficient approach in reconstructing large target regions. Exemplar-based Inpainting approach iteratively synthesizes the target region by most suited patch from the source region [1]. These algorithms also overcome the drawbacks of PDE based inpainting and removes smooth effect of the diffusion based Inpainting algorithm. Inpainting work as follows,In the first step of Inpainting method the user manually selects the portions of the image that need be restored or reconstructed .The image restoration is done automatically, by filling these regions with information from the surrounding pixels or from the whole image. The proposed algorithm for Inpainting uses the information from the surrounding portions of image to inpaint the selected region.
Now a days, exemplar-based algorithms have been proposed to use adaptive patch size in order to improve the quality of filling results. Zhou and Zheng proposed an adaptive-size patch based inpainting algorithm using gradient angle histogram [2], solved the optimization problem to determine the optimal size of each patch. Liu et al. proposed an adaptive inpainting method using local similarity and adaptive patch size [3], where it searched pre-selected source area to avoid incorrect matching and selected appropriate patch size using local similarity and gradient magnitude. Holtzman-Gazit and Yavneh proposed an adaptive inpainting algorithm using scale consistency measurement [4]. They tested several patch sizes to obtain a best matching result. Drori et al. proposed a fragment-based inpainting algorithm [5], where fragments as circular patches around target region are defined and the adaptive sizes reflecting structure components are computed.
In this paper we propose a method for image inpainting using Graph Based Segmentation (GBS) and Diffused Expectation Maximization Algorithm (DEAM). Here the segmentation map provides local texture similarity and dominant structure region and then we adaptively choose weighting parameter values of the robust priority function for each segment. With boundary information of a segmented image map, it determines the suitable patch size and selects candidate source regions for reducing unnatural artifact. Then a curve connection method is used [6] for visually plausible filling result. Dominant structures are filled using interpolated contours in the target region followed by parameter selection by robust priority function [7].The proposed method improves robustness of inpainting results, which is influenced by priority functions. This paper is an extended version of [8] where DEMA (Diffused Expectation Maximization Algorithm) and GBS (Graph Based Segmentation) are combined thereby getting the advantages of those two methods. Detailed analysis, intermediate processes of the proposed method, and extensive experimental results are supplemented.
III.PROPOSED ALGORITHM
Initially a segmentation map M is constructed using an input image I[9]. On this input image the target region Ω is
selected manually, it is region which is to be removed. The target region is filled by using the information of the known region ɸ called the source region ,∂Ω be the boundary between the source and the target region called as decision
Target image
The parameter values of the robust priority function is determined for this difference of Gaussian (DoG) is used .The target region and the number of segments found from graph based segmentation is used by the EMA to form a segmented image. This is followed by graph based segmentation to find the parameter value of the segmented image, which in turn is used by the robust exemplar inpainting algorithm to form inpainted image[10]. The proposed method computes the priority of the target patches using robust priority function and finds the best matching source patch using Criminisi algorithm [2]. In order to obtain a better efficiency, adaptive patch size selection and search region reduction is used. Fig: 1 shows the block diagram of the proposed inpainting
.
Fig.2: shows the input image with target region, source region and the boundary A. Graph Based Segmentation
Graph-based image segmentation techniques generally represent the problem in terms of a graph G = (V, E) where each node vi ∈V corresponds a pixel in the image, and the edges in E connect certain pairs of neighbouring pixels[6]. A weight is associated with each edge based on some property of the pixels. Let G = (V,E) be an undirected graph with vertices vi ∈V , which represents set of elements to be segmented, and edges(vi, vj) ∈E corresponding to pairs of neighboring vertices. Each edge (vi, vj) ∈E has a corresponding weight w ((vi, vj)), which is a non-negative measure of the dissimilarity between neighboring elements vi and vj . In the case of image segmentation, the elements in V are pixels and the weight of an edge is some measure of the dissimilarity between the two pixels connected by that edge .In the graph-based approach, a segmentation S is a partition of V into components such that each component (or region) C
∈S corresponds to a connected component in a graph G′ = (V,E′), where E′ ⊆E. In other words, any segmentation is induced by a subset of the edges in E. There are different ways to measure the quality of a segmentation but in general we want the elements in a component to be similar, and elements in different components to be dissimilar. [8]First, the segmentation algorithm is used to produce an initial segmentation map. Next, we merge segments in T of the initial segmentation map into one segment and then assign a new label that indicates the target region. The segmentation map in the robust exemplar-based inpainting method performs two functions: as an indicator of T and as selection criteria of patch size and candidate source regions.
GBS
Selection of weighing
DEM
Algorithm GBS
Robust exemplar inpainting Input
image
e
B. Parameter Selection Of Robust Priority Function
Let P(p) denotes the priority function which is a product of confidence term C(p) and data term D(p)[2] where p is the center pixel of a patch.
P(p) = C(p)D(p) (1) The confidence term C(p) is expressed as
( ) =∑ ∈ ∩ ( ) ⎸ ⎸ (2)
Where ⎸ ⎸represents the number of pixels in the patch and initial values of C(p) are
C(P) = 0 1 ∀∀ ∈ ɸ∈ (3)
The confidence term is determined by the number of pixels that belong to ɸ .The confidence term is determined by the number of pixels that belong to ɸ .Using the priority function, we can determine the filling order of the target region, which is important to reconstruct structural information. The data term D (p), which is defined as
( ) =⎸∇ ∗ ⎸ (4)
A normalization value of 255 is chosen for 8-bit images. We compute directional similarity between the normal component of intensity gradient ∇ where the superscript ⊥ represents the normal component, and normal vector np at pixel p. Using the data term, linear structures are synthesized first. However, due to influence the dropping effect, structural information cannot be adequately assigned to the target region when the confidence is rapidly dropped. Cheng et al. proposed the robust priority function to avoid the dropping effect, which is defined as
R(p) = α. ( )+ β D(p) , 0 ≤ α , β ≤ 1 , α+β = 1 (5) With the regularized confidence term Rc (p) expressed as
( ) = ( 1- ω ) . C(p) + ω (6)
where ω is set to 0.7 and fixed weighting parameters α and β are manually selected by users in Cheng et al.’s algorithm[7]. However, the selection of α and β in the inpainting algorithm shows visually varying results. Thus, selection of appropriate parameter values is one of the primary objective to obtain good inpainting results. The proposed method uses difference of Gaussian values to determine the weighting parameters where, DoG is not only robust against noise components but also can enhance edge and detail of images. The data term D (p) in equation (5) has much influence in propagating structure components. For the accurate propagation of the structure components, we
adaptively choose a coefficient β of data term of the robust priority function according to the local image features.Thus, we set βto the average values of the normalized absolute DoG values in each segment, where absolute DoG values are
divided by the maximum absolute DoG value for normalization, and α is set to 1– β.
C. Diffused Expectation Maximization Algorithm
DEM ALGORITHM FOR GMM
Consider a Gaussian mixture model, our goal is to maximize the likelihood function with respect to the parameters comprising the means and covariances of the components and the mixing coefficients.
Estimation: repeat for t iterations until | logL^(t+1)_logL^(t)|| < 2 :
E-step: with fixed parameters ( ) , ( ), ( )compute the labelling probabilities at each site i as:
ℎ( )=
( ) ( | , ( ), ( ))
∑ ( ) ( | , ( ), ( ))(7)
D-step: propagate ℎ by m iterations of the discrete form of anisotropic diffusion
ℎ( )= ℎ( )+ λ▽. (g(▽ℎ( )) ▽ℎ( ) (8)
and set ℎ( )=ℎ( )
M-step: with ℎ( )fixed, calculate the parameters that maximize log L:
( )
= ∑ ℎ( ). ( )=∑
( )
∑ ( ), ( )
(9)
=∑
( )
[ ( )]
∑ ( )
and calculate log L^(t+1).
D. Graph Based Segmentation
This step is same as that of the A, the only difference is that the, here the GBS of the Expectation Maximized Segmented image is taken. The input to GBS is the segmented image from C and the target region. Once the graph based segmentation is done, selection of the weighting parameters of the robust priority function is carried out. The beta value obtained from this step is used in robust exemplar based inpainting to obtain a perfect inpainted image.
E. Robust Exemplar Based Inpainting
Using segmentation map M, an input image I can be separated into several regions, which is expressed as
⋃ = (10)
number of segments. A chosen target patch pˆ belongs to at least one segment Ri. In the proposed method, we simply define selection rules for suitable patch size and candidate search region with segmentation result. First, the patch size is adaptively selected as follows. When the current patch is located on the segment boundaries, a default window size(9×9) is used. On the other hand, when the current patch belongs to a single segment Ri, we increase the size of the patch while pˆ⊂ Ri. In our experiments, we set the maximum window size of patches to 17×17 to achieve high quality results. Next, to prevent undesirable source patch selection, we restrict search region using adjacent segments. We assume that an image is grouped according to texture similarity, thus search area is restricted to adjacent neighboringregions.The proposed method searches corresponding candidate source regions that contain target region. With this approach, we can reduce the computation time and error propagation. We find pixel pˆ with the maximum priority and thus the most similar source patch qˆ, where qˆ is the center point of the patch. We search the candidate source region to find a patch with the minimum distance from the patch pˆ, i.e.,
= d ( , ) (11) Distance d ( pˆ, q ) is defined as the sum of squared differences, which is expressed as
whereNp is the number of pixels in a patch and C is the color vector and G is the image gradient vector. A target patch
pˆ is updated by a selected source patch qˆ .
pˆ ( ) = qˆ (s),¥ r ε T
= ( ) ( ), ¥ r ε S (13)
wherer and s are pixels in the target patch and co-located pixel in the source patch, respectively. The proposed method updates whole pixels in the target patch pˆ , thus pixels in pˆ that belong to source region and neighboring pixels in
qˆare overlapped. We fill overlapped region with average of target and source pixels. Then, its confidence term and boundary ∂Ω are updated. Following the region update rule , segment labels are introduced in the target segment. Therefore, we can infer the suitable patch size and candidate source region for the target region after a number of iterations. Propagation of segments affects the performance of the proposed algorithm because the proposed adaptive patch size and candidate selection rules depend on segments that belong to the target patch. However, segment information is not correct all the time. Incorrectly propagated segments cause error propagation. Thus, to reduce error propagation in the proposed method, we use a curve connection method in [10]. We link broken boundary lines along
∂Ω to achieve perceptually good continuation.
IV.SIMULATION RESULTS
Here the proposed method has been tested with various input images. Fig 3: shows the input image, here the target is the elephant shown in green, which is to be removed and has to be filled with the information from the neighboring region and the third one shows the segmentation map.Fig 9 shows the EM segmented image Fig 14 Shows the confidence term, data term andthe inpainting region . Fig 10 : shows the inpainted result .
Fig 3: Original image, target region in green, segmentation map
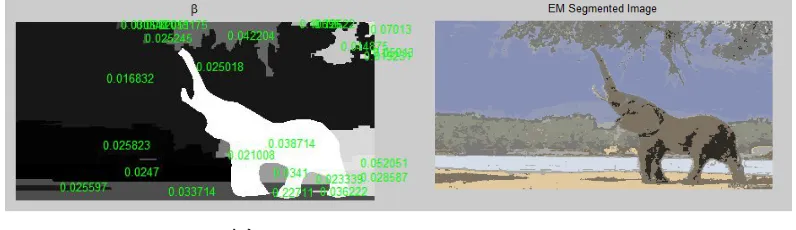
Figure 4: shows the values of β with respect to different region of the image .Fig 5: shows the Expected Maximization segmented output.
Fig 4: Values of β w.r.t different region Fig 5: EM Segmented Image
Fig 6: Inpainted image Fig.7: Inpainted output from[10]
Figure 8: shows the input image ,here the target is deer shown in green, which is to be removed and has to be filled with the information from the neighboring region and the third one shows the segmentation map.
Fig 8: Original image, target region in green, segmentation map
Figure 9: shows the DEM segmented image. Figure 10: shows the inpainted image
Fig 9:DEM Segmented Image Fig 10:Inpainted output
V. PERFORMANCE EVALUATION
The performance evaluation is performed by calculating the following
Root Mean Square Error(RMSE)
The Root Mean Square Error (RMSE) is a frequently used measure of the difference between values predicted by a model and the values actually observed from the environment that is being modelled. These individual differences are also called residuals, and the RMSE serves to aggregate them into a single measure of predictive power. The RMSE of a model prediction with respect to the estimated variable Xmodel is defined as the square root of the mean squared
error:
n
X
X
RMSE
n
i obsi modeli
12 ,
,
)
(
Peak Signal to Noise Ratio (PSNR)
PSNR is the measure of peak error.It is the ratio between the maximum possible power of a signal and the power of corrupting noise that affects the fidelity. A higher value of PSNR is good because it means the signal to noise ratio is higher.
PSNR = 10∗log (Peak) MSE
Structural Similarity (SSIM) Index
The structural similarity (SSIM) index is a method for measuring the similarity between two images. The difference with respect to other techniques mentioned previously such as MSE or PSNR is that these approaches estimate perceived errors; on the other hand, SSIM considers image degradation as perceived change in structural information. Structural information is the idea that the pixels have strong inter-dependencies especially when they are spatially close. These dependencies carry important information about the structure of the objects in the visual scene. The SSIM metric is calculated on various windows of an image. The measure between two windows and of common size N×N is:
( , ) = (2 + ) (2 + )
( + + ) ( + + )
The following table shows the performance evaluation corresponding to various input images.
GBS GBS and DEMA
Image RMSE PSNR SSIM RMSE PSNR SSIM
Elephant 4.15 28.35 .75 3.78 34.12 .86 Deer 5.45 26.12 .78 4.57 33.12 .90
From the table we could conclude that Exemplar based Inpainting Algorithm using Graph-based Segmentation and Diffused Expectation Maximized Algorithm is an efficient method of reconstructing lost and missing parts of an image
VI. CONCLUSIONS
This paper combines the advantages of texture synthesis and structure synthesis, and proposes an exemplar based inpainting algorithm using region segmentation and diffused expectation maximization algorithm to form an inpainted image. The structure and texture information are used to determine appropriate patch size and candidate source regions and to automatically select robust parameter values. With this approach we can reduce the number of iterations and error propagation caused by incorrect matching of source patch. From figure 8 and 9 it is clear that the output image obtained from the proposed algorithm is better compared to [10] visually. Experimentalresults and performance evaluation shows the effectiveness of the proposed method.
REFERENCES
[1] M. Bertalmio, A. L. Bertozzi, and G. Sapiro, “Navier-Stokes, fluid dynamics, and image and video inpainting,” in Proc. IEEE Conf. Computer Vision and Pattern Recognition, vol. 1, pp. 355–362, Kauai, HI, Dec. 2001.
[2] A. Criminisi, P. Perez, and K. Toyama, “Region filling and object removal by exemplar-based image inpainting,” IEEE Trans. ImageProcessing, vol. 13, no. 9, pp. 1200–1212, Sep. 2004.
[3]Stefan Roth Michael J. Blacky “Fields of Experts “Received: 22 January 2008 / Accepted: 17 November 2008
[5] J. Sun, L. Yuan, J. Jia, and H.Y. Shum, “Image completion with structure propagation,” ACM Trans. Graphics, vol. 24, no. 3, pp. 861–868, Jul. 2005.
[6] W.-H. Cheng, C.-W. Hsieh, S.-K. Lin, C.-W. Wang, and J.-L. Wu, “Robust algorithm for exemplar-based image inpainting,” in Proc. Int.Conf. Computer Graphics, Imaging and Vision 2005, pp. 64–69, Beijing, China, Jul. 2005.
[7] H. Zhou and J. Zheng, “Adaptive patch size determination for patch based image completion,” in Proc. IEEE Conf. Image Processing, vol. 1,pp. 421–424, Hong Kong, China, Sep. 2010.
[8] Y. Liu, X.-J. Tian, Q. Wang, S.-X. Shao, and X.-L. Sun, “Image inpainting algorithm based on regional segmentation and adaptive window exemplar,” in Proc. IEEE Conf. Advanced Computer Control,vol. 1, pp. 656–659, Shenyang, China, Mar. 2010.
[9]M.Bertalmio, L. Vese, G. Sapiro, and S. Osher. “Simultaneous structure and texture image inpainting.” In Proc. Conf. Comp. Vision Pattern Rec., Madison,WI,2003
[10]Jino Lee, Dong-Kyu Lee and Rae-Hong Park “Robust Exemplar-Based Inpainting Algorithm Using Region Segmentation” IEEE Transactions on Consumer Electronics, Vol. 58, No. 2, May 2012.
BIOGRAPHY
AjanaAjayakumarreceived her B.Tech degree from LBS Institute of Science &Technology, Thiruvananthapuram in
the year 2013. She is currently doing her second year M.Tech. at Marian Engineering college, Thiruvananthapuram. Her research interests include digital signal processing and digital image processing
Monisha Menon received her B.Tech degree from LBS Institute of Science&Technology, Thiruvananthapuram in the
![Fig 6: Inpainted image Fig.7: Inpainted output from[10]](https://thumb-us.123doks.com/thumbv2/123dok_us/1484976.1181685/7.595.109.488.173.276/fig-inpainted-image-fig-inpainted-output.webp)
