Munich Personal RePEc Archive
Achieving Universal Literacy in Andhra
Pradesh : Status and Prospects
Motkuri, Venkatanarayana and Chaganti, Ravi
S. R. Sankaran Chair, National Institute of Rural Development,
Hyderabad, Centre for Economic and Social Studies, Hyderabad
September 2012
Online at
https://mpra.ub.uni-muenchen.de/48617/
Achieving Universal Literacy in Andhra Pradesh
: Status and Prospects
M. Venkatanarayana and C. Ravi####
Introduction
Informed citizenry, active citizenship and collective actions are critical for the functioning of
civil society especially in democratic society (APHDR. 2007). The vehicle through which
these are made possible is education. Moreover, literacy and basic education are the crucial
factors for the social, economic and human development. Particularly acquiring literacy skills
is the foundation for life-long learning and it is a human right (UNESCO, 2005; 2008 &
2012). The crucial role that education development plays in the growth process of an
economy is well established (see Barro, 1997; Barro and Sala-i-Martin, 2004;
Psacharopoulos, 2006). In the context of globalisation and emerging knowledge based
economies, the illiterate labourforce and those having poor educational levels would
definitely be disadvantaged in the labour market. Moreover, education enhances the
functioning of an individual better (see Sen, 1999). Therefore, given the low levels of
education in India it is necessary to enhance educational development further in order to
unravel the growth potentials of the Indian economy (Mehrotra et. al., 2005).
Within the country there are wide variations across regions, states and sub-regions within the
states. Andhra Pradesh is one of those Indian states which are having historical trend of low
levels literacy rate and levels of education. In spite of the state’s remarkable performance in
terms of the child schooling (i.e. school attendance rate) especially since 1990s, its
performance in literacy rate is relatively poor (APHDR, 2007). It is because of the state is
having large stocks of illiterate population especially in the adult and older age groups. It is
also observed that in spite of state of Andhra Pradesh witnessing better economic growth
during the last two decades, its performance in respect of human development index is not
impressive because its performance in education particularly with respect to literacy levels is
one of the poorest among Indian states (APHDR, 2007). Therefore, in order to improve the
#
performance of the state with respect human development index, a remarkable achievement
in education particularly adult literacy rate is critical (ibid). Thus, the policy concern in the
state is about the prospects of literacy and hence policy interventions required to improve
literacy levels in the state.
In this context, the present analysis of progress in literacy rate and changes in disparities
across social and geographical groups in literacy rate in Andhra Pradesh. Also an exercise
explores the prospects of literacy in Andhra Pradesh with simulation modelling exercise
which considers different policy interventions. Having said, the paper is organised as follows.
Section I below presents the status of literacy levels in Andhra Pradesh and the Section II
presents the prospects of the literacy in India. Section III discusses on policy initiatives and
issues with respect adult education programmes. Finally, concluding observations and
remarks follows.
I Status of Literacy in Andhra Pradesh
With respect to the literacy rate, there is a significant improvement over a period in Andhra
Pradesh. However, the latest Census 2011 figures have shown that about two-thirds of
population in Andhra Pradesh are literates and the rest one-third still remained as illiterates
(Table 1.1). Literacy rate in the state is well below the national average and the state is found
to be one of the poor performing states in India. The Census 2011 figures show that the state
stands at fourth position from the below (lowest literacy rates) next to Bihar, Rajasthan and
Jharkand (see Figure 1.1). There are about 24.9 million (or 2.49 crore) illiterates (7 + years
age) in the state. While the state’s share in total population of the country is nearly 7% in
2011, its contribution to the total illiterates (282.6 million) in the country is around 8.8%. It
shows that state over representing for the illiterates of the country.
Over a period especially since 1961, the improvement in overall literacy rate in the state is
the largest during the 1980s (14 percentage points increase between 1981 and 1991) and
1990s (17 percentage points increase between 1991 and 2001). During the last decade (i.e.
between 2001 and 2011) the improvement in the literacy rate of the state is around 6.6
percentage points which is very low when compared to its performance in the previous
decades (Table 1.1). In fact, it is observed that the performance of the state in respect of
improvement in literacy rate during 1990s was impressive and one of the highest among
the lowest. If the trend continues, Andhra Pradesh would remain as a laggard state in India
[image:4.612.75.538.146.320.2]with respect to literacy rate.
Figure 1.1: Literacy Rate across Major Indian States, 2011
Note: 1. Literacy Rate – percentage of literates to the 7 + age population; 2. States are ordered by the rank in terms of literacy rate.
Source: Census of India, Census 2011 Provisional Data.
Table 1.1: Literacy Rate in Andhra Pradesh and in India
Year Andhra Pradesh All-India
Person Male Female Person Male Female
1 2 3 4 5 6 7
1961 21.2 30.2 12.0 28.30 40.40 15.35
1971 24.6 33.2 15.8 34.45 45.96 21.97
1981 29.9 39.3 20.4 43.57 56.38 29.76
1991 44.1 55.1 32.7 52.21 64.13 39.29
2001 60.5 70.3 50.4 64.84 75.26 53.67
2011 67.0 74.9 59.1 72.99 80.89 64.64
Note: 1. Literacy is for 5 + age population till 1981 and after that, for 7 + age population.
Source: 1. APHDR (2008); 2. Census of India.
Although the gender gap in literacy in the state is narrowing down as a results of the
improvement in literacy rate over a period is faster among the females when compared to
their male counterparts, there is still a significant level of difference (around 16 percentage
points in 2011) between male and females in terms of literacy.
6 3 .8 6 7 .1 6 7 .6 6 7 .7 6 8 .7 6 9 .7 7 0 .6 7 1 .0 7 3 .2 7 3 .5 7 4 .0 7 5 .6 7 6 .6 7 6 .7 7 7 .1 7 9 .3 7 9 .6 8 0 .3 8 2 .9 8 3 .8 8 6
.3 93.9
[image:4.612.95.518.429.580.2]Regional Variation
Within the state there are huge variations across districts in literacy rate. The highest literacy
rate (83.2%) is observed in Hyderabad district followed by Rangareddy (75.9%) and West
Godavari (74.6%) districts. The lowest rate (55.0%) is observed in the Mahabubnagar district
followed by Vizianagaram (58.9%) and Kurnool (60%) districts (Figure 1.2). Between the
highest and the lowest literacy rate across districts in the state there is a gap of 28 percentage
points. The levels of literacy across districts also indicates a regional pattern wherein except
Hyderabad and Rangareddy districts all the other districts are having literacy higher than the
state average are Coastal and Rayalaseema districts.
Figure 1.2: Literacy Rate (%) across Districts in Andhra Pradesh, 2011
Note: 1. Rural-urban combined; 2. Percentage of literates to 7+ years age population.
Source: Census of India, 2011.
Mandal1 (sub-district) level analysis of literacy rate shows that out of the total 1128 mandals
in the state of Andhra Pradesh a majority number of them (815 mandals comprising of
three-fourths of the total) are having literacy rate below the state average (67%), according to 2011
Census information. About two-fifths of mandals are having literacy rate in the range of 50 to
60% and another two-fifths of them are having 60 to 70% (Figure 1.3). Very few mandals are
having literacy rate above 80% (see Figure 1.3 and Table 1.2). However, with respect to
literacy rate of rural people especially among the rural females, there are about 10 mandals in
Andhra Pradesh having rural female literacy rate below 30% in 2011. Moreover, strikingly,
about half of the rural mandals are having female literacy in the range of 30 to 50% only
(Figure 1.3). This half of the mandals located in rural topography and having female literacy
rate below 50%, are found to contribute more than one-thirds of the total population in the
1
Mandal is administrative division below the District in Andhra Pradesh.
state (see Table 1.2). Such is the dire condition of female literacy in many of mandals the
[image:6.612.72.539.147.333.2]state.
Figure 1.3: No of Mandals in Andhra Pradesh by the level of Literacy Rate in 2011
Note: Mandal is administrative division below the District in Andhra Pradesh.
Source: Primary Census Abstract, Census 2011, Census of India, Andhra Pradesh.
Table 1.2: Number of Mandals with their share of population and average literacy rate by Literacy Level in 2011 - Andhra Pradesh
Literacy Levels
(%)
Overall Literacy: Persons Rural Literacy: Persons Rural Females’ Literacy No. of mandals % of Population Average literacy(%) No. of mandal % of Population Average literacy(%) No. of mandal % of Population Average literacy(%)
1 2 3 4 5 6 7 8 9 10
Less than
30% - - - 11 4.8 27.5
30-50% 71 4.5 45.61 91 8.5 45.81 553 31.1 36.6
50-60% 406 24.4 56.05 473 40.8 56.07 361 17.9 52.1
60-70% 436 31.8 64.66 425 39.3 64.07 131 31.3 63.7
70-80% 167 23.5 74.86 101 10.4 73.53 42 14.9 72.7
Greater
than 80% 48 15.8 82.74 8 1 81.07 - - -
Note: ‘-‘ None.
Source: Primary Census of Abstract.
Social Group disparities
Across social groups, there has been a progress in literacy among both SC and ST
communities in the state. For SCs it increased from 8.5 per cent to 31.6 per cent between
1961 and 1991 and to 53.5 during 1991-2001. For STs the literacy rate was 4.4 per cent in
1961; it increased to 17.2 per cent in 1991 and 37.1 per cent in 2001. Till 1991 the literacy
7
1
4
0
6 436
1 6 7 4 8 1 0 4 6 7 3 7 5 1 7 5 8 5 1 6 9 1 4 7 3 4 2 5 1 0 1 8 1 1 5 5 3 3 6 1 1 3 1 4 2 0 100 200 300 400 500 600
<30 30-50 50-60 60-70 70-80 >80
N o . o f M a n d a ls
Literacy Rate (%)
[image:6.612.80.534.438.599.2]rate of STs was less than one-third of the all-community average literacy rate in the state. The
gap between the literacy levels of SC/ST and the state average increased till 1991 and
subsequently it narrowed down to some extent. The rate of achievement in terms of literacy
levels was higher for the STs and SCs when compared to the state average during 1991-01.
However about half the SCs and two-thirds of the STs in the state still continued to be
illiterates.
Table 1.3: Literacy Levels by Caste and Gender in Andhra Pradesh
Year
SC ST All
Person Male Female Person Male Female Person Male Female
1 2 3 4 5 6 7 8 9 10
1961 8.5 13.4 3.4 4.4 7.3 1.5 21.2 30.2 12.0 1971 10.7 15.9 5.3 5.3 8.5 2.1 24.6 33.2 15.8 1981 17.7 24.8 10.3 7.8 12.0 3.5 29.9 39.3 20.4 1991 31.6 34.4 20.9 17.2 20.1 8.7 44.1 55.1 32.7 2001 53.5 63.5 43.4 37.1 47.7 26.1 60.5 70.3 50.4
Notes: 1. Figures are in percentage; 2. Literacy is for 5 + population for the years 1961 and 1971 thereafter it has been for 7+ age population; 3. Up to 2001 it is Census data, for 2009-10 it is based on NSS estimations.
Source: 1. GoAP (2007); Census of India, Andhra Pradesh.
The growth of literate persons in each social group during 1991-2001 was very much higher
than the growth of population of the respective social group. Moreover, the growth of literate
persons was the highest of among the STs (10.41 per cent per annum) followed by the SC
(7.55 per cent per annum) when compared to the all community (5.01 per cent per annum)
average in the state (GoAP, 2007).
Further disaggregated by gender and caste, ST women were the most backward and their
literacy rate was one-fourth of the state average. This suggests that ST female adults could
not avail of the desired benefit from literacy campaigns and/or from formal schooling
facilities as compared to SC female adults in rural Andhra Pradesh. SC male adults, however,
could benefit from these initiatives to improve their literacy position between 1991 and 2001
(Reddy et. al., 2008).
To get the recent experiences of these social groups in terms of their performance in
improving their literacy level during the last one decade period, Census based information is
survey on employment and unemployment, in this respect. The analysis based on the NSSO
data indicates that the gaps in literacy rates across social groups continue to persist (Figure
1.4a). Still around half of the ST and SC population in the state survives with illiteracy. If one
compares the performance of these ST/SC social groups in the state with that of their
counterparts at the all India level, performance of ST/SC groups in Andhra Pradesh is lagging
behind that of national averages (Figure 1.4a&b).
Figure 1.4: Literacy Rate (%) by Social Groups in Andhra Pradesh and India
a) Andhra Pradesh b) All India
Note: Literacy rate for 7 + age population.
Source: Estimated using NSSO 61st (2004-05) and 66th (2009-10) Round Employment and Unemployment Survey unit record data.
Within the state there are huge variations across districts in terms of the performance of these
social groups. A study analysed such variations across districts based on 2001 Census data
observed that the pattern of inter-district variations in literacy rate among SCs was very
similar to the regional pattern seen in the all community average literacy rate (Reddy et al,
2009). Across districts, the literacy rate was relatively the lowest among the STs by
community and ST female by community and gender. West Godavari district next to
Hyderabad was the district with highest literacy rate and Mahabubnagar was the district with
the lowest literacy rate in all six literacy rate parameters (ibid).
Change in Age-group specific literacy rate
Literacy rate across age groups too varied. When examined age group specific literacy rate it
can be observed that the literacy rate in Andhra Pradesh declined with ascension of higher
age groups (Figure 1.5). The high literacy rate among younger age groups is because of
recent remarkable expansion primary education owing initiative such as DPEP and its
successor SSA. The literacy among the older age groups indicates the haunting historical
neglect of primary education and the adult education/literacy programmes. The increase in
5
8
.3
4
4
.5 51.1 55
.0 7
0
.9
6
5
.4
5
0
.0 56.7 63
.8 7
7
.3
0.0 20.0 40.0 60.0 80.0 100.0
All ST SC OBC Others
2004-05 2009-10
6
7
.3
5
3
.1 58.2 65
.6 7
9
.0
7
3
.4
6
3
.4
6
5
.7 72.3 8
2
.7
0.0 20.0 40.0 60.0 80.0 100.0
All ST SC OBC Others
age group-specific literacy rate between 1995-96 and 2007-08 literacy shows the expansion
of primary education over a period of time (Figure 1.5). Because of remarkable expansion
and improvements in primary education in the state especially during the last two decades,
the improvement in the literacy rate during the period is relatively higher among the younger
[image:9.612.84.550.206.367.2]age groups than that of the adult and older age group.
Figure 1.5: Improvement in Literacy Rate (%) by age groups in Andhra Pradesh and India
Note: Age group specific literacy rates (%).
Source: Based on the unit record data of NSS 52nd (1995-96) and 64th Round (2007-08) Surveys on Literacy and Participation in Education (Sch. 25).
The contribution of younger age group literates to the total literates in the state is higher than
their proportion in the state population (Table 1.4). Correspondingly the contribution of
adults and older age group literates to the total literates in the state is lower than their
proportion in the state population.
Table 1.4: Percentage Distribution of Population and Literates by Broad Age Groups in Andhra Pradesh and India
Age Group
Distribution of Population Distribution of Literates
Andhra Pradesh India Andhra Pradesh India
1995-96 2007-08 1995-96 2007-08 1995-96 2007-08 1995-96 2007-08
1 2 3 4 5 6 7 8 9
7-14 18.9 15.4 19.1 17.9 33.1 26.3 29.8 27.2
15-24 16.0 18.2 16.4 18.0 24.1 28.3 24.3 25.3
25-34 19.3 17.3 17.0 16.1 19.2 20.0 19.4 18.8
35-59 24.3 29.5 23.4 26.2 20.1 22.0 22.4 24.3
60+ 5.4 8.0 6.4 7.3 3.5 3.4 4.1 4.4
Note: Figures presented are percentages.
Source: Based on the unit record data of NSS 52nd (1995-96) and 64th Round (2007-08) Surveys on Literacy and Participation in Education (Sch. 25).
7
6
.3
6
6
.0
4
3
.4
3
6
.1
2
7
.8
7
6
.3
6
6
.0
4
3
.4
3
6
.1
2
7
.8
9
6
.1
8
6
.9
6
4
.9
4
1
.9
2
3
.7
9
3
.3
8
6
.0
7
1
.6
5
6
.8
3
6
.8
0.0 20.0 40.0 60.0 80.0 100.0 120.0
7 to 14 15 to 24 25 to 34 35 to 59 60+ 7 to 14 15 to 24 25 to 34 35 to 59 60+
Andhra Pradesh All India
[image:9.612.82.532.567.715.2]Having analysed the situation of literacy levels for the state, the comparison of the state with
the other states in terms of age specific literacy rate shows the relative position of the state of
Andhra Pradesh in the all India context. The Figure 1.6 indicates that in the younger (7 to 14)
age groups the literacy rate across states varies between 90 to 99 percent except Bihar; and
the state of Andhra Pradesh stands in the middle.
The variation across states in the literacy rate increases from the younger (7to 14) age group
to that of the older age group (60 + years). The relative position of the Andhra Pradesh
worsens with ascension of higher age groups wherein the state position moves from the
middle for the 7 to 14 years age group to fifth lowest for the 15 to 34 years age group and to
the second lowest for the 35 to 59 years age group and the third lowest for the older (60 +
[image:10.612.74.540.347.651.2]years) age group (see Figure 1.6a, b, c and d).
Figure 1.6: Age Specific Literacy Rate across Major States in India, 2007-08
a) 7 to 14 Age Group b) 15 to 34 Age Group
81.3 90.6 91.4 91.4 93.3 93.5 94.4 94.5 95.2 95.2 95.7 95.8 96.1 96.2 96.3 96.5 96.5 97.1 97.4 99.2 99.4 99.9 0 .0 2 0 .0 4 0 .0 6 0 .0 8 0 .0 1 0 0 .0 1 2 0 .0 Bihar Uttar Pradesh Jharkhand Rajasthan India Orissa Madhya Pradesh Punjab Chhattisgarh West Bengal Uttaranchal Haryana Andhra Pardesh Gujrat Karnataka Delhi
c) 35 to 59 Age Group d) 60 + Age Group
Note: Age specific literacy rates.
Source: Based on the unit record data of NSS 64th Round (2007-08) Surveys on Literacy and Participation in Education (Sch. 25).
Literacy through informal means
There are different means i.e. formal and informal ways and non-formal educational
programmes, that impart basic skills (reading, writing and numeracy) required for literacy.
Formal schooling is the most common mode to become a literate, so that at young age the
chances of formal schooling are more than that of as age increases. When formal schooling is
the only means of acquiring literacy skills, the literacy rate observed for an younger age
cohort remains constant (if one assumes mortality rate among the literates and illiterates in
that age cohort is same) throughout the passage of that age cohort through different age group
brackets over a period of time. In this case, therefore, the age-specific literacy rate at a point
of indicates change in literacy rate over a period of time. In the older age group there are
chances for acquiring literacy skills through these means. Therefore, there are chances of
improving the literacy rate across age groups through these methods (also see
Venkatanarayana, 2013).
When observed the percentage of those literates who have become literates (or who acquired
programmes or adult literacy programmes to the total literates in the state are very marginal
(below one percent among 7 + years age literates). When we refer it as the percentage of
literates without formal schooling, by age groups the share is increasing marginally. The
percentage is higher (around 3%) among the older age groups (60 + years age). However,
when compared to all India average, the percentage of literates without formal schooling is
[image:12.612.88.532.260.399.2]lower in the state across age groups (Figure 1.7).
Figure 1.7: Percentage of those who became Literates without Formal Schooling (through Informal/Non-formal Education) to the Total Literates by age groups in
Andhra Pradesh and India, 2007-08
Note:1. Age group specific percentages; 2. Informal/Non-Formal Education includes Total Literacy Campaign (TLC), NFEC, AIEP, AEC, and others.
Source: Based on the unit record data of NSS 64th Round (2007-08) Surveys on Literacy and Participation in Education (Sch. 25).
One must also note the demographic factor i.e. age specific mortality rate as important factor
that affects the age specific literacy rate. In other words in a particular age cohort in its
passage, if the mortality rate is higher among literates when compared to illiterates in that
cohort, the literacy rate in the age cohort declines and vice versa (i.e. if the mortality rate is
higher among illiterates when compared literates, the literacy rate in that age cohort
increases). The increase or decline in the age specific literacy rate in a particular age cohort in
this particular case is purely a demographic effect. However, we don’t have sufficient
information on age specific mortality rates among literates and illiterates.
Similarly, the case of migration especially external migration factor i.e. the literacy levels
among the net migrants affects the overall literacy rate of a country/state/region. If the net
migration (positive) in favour of in-migrants and the literacy level are higher (lower) than
non-migrant population then the overall literacy rate improves (declines). If the net migration
(negative) in favour of out-migrants and the literacy level are lower (higher) than
non-0
.0 0.4
1
.2 1.6
2
.9
0
.2 0.4
1
.2
2
.2
4
.6
0.0 1.0 2.0 3.0 4.0 5.0
7
-1
4
1
5
-2
4
2
5
-3
4
3
5
-5
9
6
0
+
migrant population then the overall literacy rate improves (declines). But it all depends on
size of the migrants. In case of Andhra Pradesh, the share of external migrants in the total
population of the state is small (below 1%) so that the literacy status of net migrants may not
significantly affect overall literacy rate in the state.
Isolated and Proximate Illiteracy
It is also appropriate to consider literacy at the household level. It is observed that a
household with an adult literate member has an advantage over that of a household which had
no literate adult. The externality effect of one adult literate member on the other illiterate
members within a household is referred as proximate literacy and the illiterate members are
proximate illiterates in the literature (See Basu and Foster, 1998; Gibson, 1999; Basu et. al.,
2000; and Subramanian, 2004). Due to the externality effect of the literate member of the
family the benefits of literacy will spread to other members. Household in which no adult
member is literate, it is referred as isolated illiteracy (ibid), it is the most disadvantaged
/deprived one. In this respect, the literacy programmes has to identify the households in
[image:13.612.74.534.429.607.2]which all the members are illiterate, prioritise and target such households.
Figure 1.8: Percentage of Households without an Adult Literate in A P and India
Note: 1. Adults in the 15+ age group; 2. Percentage of Households.
Source: Estimations using three Rounds (55th, 61st and 66th) of NSS Employment and Unemployment Survey Unit Record data.
In Andhra Pradesh there are still one-third of the rural households and one-tenth of the urban
households are without an adult literate (see Figure 1.8). The incidence of household adult
illiteracy (where the entire adult members are illiterates) is relatively much higher in Andhra
Pradesh than all-India. Moreover, it is well established fact that the externality of female
literacy, presence of female literate in a household is even more especially in terms of women 44.8
36.4
29.4 32.1
26.1
20.4
71.4
57.7
54.3
60.9
50.0
44.0
17.2
12.7 11.1 11.6
8.4 6.9
38.7
28.1 30.7
34.6
19.5
25.5
0.0 10.0 20.0 30.0 40.0 50.0 60.0 70.0 80.0
1999-2000 2004-05 2009-10 1999-2000 2004-05 2009-10 1999-2000 2004-05 2009-10 1999-2000 2004-05 2009-10
AP India AP India
and child health, child mortality and child schooling etc. It is more important if an adult
female. In this respect Andhra Pradesh is highly disadvantaged wherein more than half of the
rural and around one-third of the urban households still do not have a female adult literate
member (see Figure 1.8). Over time there is declining trend of household illiteracy in terms
of both the aspects – all adult illiterates and female adult illiterates (see Figure 1.8). During
last one decade period, the rate of decline at the national level is faster than that of Andhra
Pradesh.
In the all India context, Andhra Pradesh is the third largest state in terms of the incidence of
households without any adult literates (See Figure 1.9). In terms of the incidence of
households without a female adult literate, Andhra Pradesh is the fifth largest state in India.
But the magnitude of the problem is very high around half of the total households (rural
[image:14.612.75.530.379.670.2]urban combined) in the state.
Figure 1.9: % of Households without an Adult Literate member Across Major States in India, 2009-10
a) % Without any Adult Literate b) % Without a Female Adult Literate
Note: Rural-Urban Combined.
Source: Estimations using NSS 66th (2009-10) Round Employment and Unemployment Survey Unit Record data.
It is to be noted that Andhra Pradesh is sixth largest in terms of percentage of female headed
households in the state. All its southern sisters are ahead of Andhra Pradesh in having female
30.5 30.2 24.1 21.2 21.2 20.1 18.5 16.7 16.4 15.6 13.9 12.9 12.4 12.4 10.2 9.6 8.1 7.8 7.4 5.9 4.7 4.2 1.7
0.0 10.0 20.0 30.0 40.0 Bihar Jharkhand Andhra Pradesh Uttar Pradesh Orissa Rajasthan Chattisgarh Madhya Pradesh All India Karnataka West Bengal Punjab Jammu & Kashmir Tamil Nadu Gujarat Haryana Maharastra Uttaranchal Assam Himachal Pradesh All Other States Delhi Kerala 60.5 55.8 54.3 49.9 47.5 42.7 42.5 41.9 38.5 37.2 36.5 35.9 35.7 34.1 32.8 30.3 30.3 27.3 25.6 21.1 17.8 16.5 7.5
headed households. But the uniqueness of the state is that although state is lower incidence of
female headed households but the incidence of household without a female adult literate is
higher even among the female headed households. In other southern states it is not case.
On the whole, despite its remarkable performance in school education in the recent past
especially during the last two decades, the state is lagging behind in literacy particularly
among the adults. The performance of the state over a period is impressive with respect to
improvement in literacy rate, such performance of the state however, has not been sufficient
to break its status as a laggard state in India in respect literacy. It indicates need for an
appropriate state-specific policy measures to improve literacy levels in the state.
II Prospects of Literacy in Andhra Pradesh
The analysis indicates that the relatively poor performance of Andhra Pradesh with respect to
literacy rate in the all India context especially when compared to the other states and also the
poor performance of the state during the last decade when compared to that of the previous
decades. It is, therefore, the cause of concern for the state policy. In this respect an attempt is
made to explore the prospects of literacy rate in the state through simulation exercise. Herein
we present the variants of literacy rate projection models involving a policy variable and
demographic factors. Both the population and literates projections are made using following
simulation model by taking year 2008 as the base.
Demographic Factors affecting literacy rate
One must also note the demographic factor i.e. age specific mortality rate as important factor
that affects the literacy rate in general age specific literacy rate in particular (see also
Venkatanarayana, 2013). In other words, if the mortality rate is higher among the illiterates
than that of literates, rate of growth in literates would be higher than that of illiterates. The
literacy rate as result of such demographic factor increases. The case is other way round when
the mortality rate is higher among the literates than that of illiterates, literacy rate declines.
Similarly, for a particular age cohort in its transit across different age structures, if the
mortality rate is higher among literates when compared to illiterates in that cohort, the
literacy rate of the cohort declines and vice versa - i.e. if the mortality rate is higher among
the illiterates when compared that of literates, the literacy rate in that age cohort increases. In
purely is a demographic effect. However, we don’t have sufficient information on age
specific mortality rates among literates and illiterates2.
Besides, the factor of migration especially external migration wherein the literacy levels of
the net migrants do affects the overall literacy rate of a country/state/region. If the net
migration is positive indicating surplus of in-migrants over out-migrants and the literacy level
are higher (lower) among these net in-migrants than that non-migrant population then the
overall literacy rate improves (declines). If the net migration is negative indicating the
out-migrants and the literacy level are lower (higher) than non-migrant population then the
overall literacy rate improves (declines). But it all depends on size of the migrants and its
share in the population. In India, however, the share of external migrants in the total
population is small (below 1%) so that the literacy status of net migrants may not
significantly affect overall literacy rate in the country.
Along with these factors the demographic transition itself has its impact on the improvement
in literacy levels. The faster demographic transition with a fast deceleration in birth rate
means decline in the size of the younger age group and the bulging adult/older age group.
Andhra Pradesh is one of the Indian states that have shown a faster demographic transition
especially during last two decades (see Venkatanarayana, 2012). In this case, if there are very
low levels of adult literacy, even a remarkable improvement in school education, which is the
most resorted way of acquiring literacy skills, thereby the literacy levels among the younger
age groups. The growth in flow of young literates with formal schooling into the adult cohort
decelerates. In the absence of any adult literacy programme, the decline in stock of adult
illiterate is equal to their mortality rate only. In a situation of same morality rate for literate
and illiterate among adult population, the rate of growth in adult literates is limited by the rate
growth in flow of younger age into adult cohort. As a result the improvement in overall
(among 7+ years age group) or adult (among 15+ years age group) literacy rate would be
very slow. Herein one say that it could be one of the reasons why Andhra Pradesh states’
performance with respect to literacy rate when compared with other Indian states is not so
impressive during the 2000s (between 2001 and 2011).
2
Policy Initiatives and Literacy
As mentioned elsewhere above, there are different means i.e. formal schooling, informal or
non-formal educational programmes that impart basic literacy skills. Formal schooling is the
most common mode. The other means are informal/non-formal modes of adult education
programmes which are complementary and provide second chance of acquiring literacy skills
for those who have missed the first chance through formal schooling when they were young.
All these means are associated with the policy initiatives. Most of adult literacy and
education programmes have to adapt informal or non-formal modes only. Under the National
Literacy Mission (NLM) in India and for its initiatives such as Total Literacy Campaign
(TLC) these informal or non-formal modes were used to impart literacy skills among the
adults. Herein we consider such a policy intervention to improve adult literacy.
Assumptions
For population projections birth rate continues to decline beyond our base years but the
age-specific mortality rate of base year continues to prevail during our projection period. With
respect to literacy projection, the basic assumption of the literacy model is age-specific
mortality rate is same among both the literates and illiterates of that age group. With respect
to external migration (in or out), the literacy rate among the net migrants is equal to that of
the non-migrant population. Besides, these basic assumptions, the other assumptions along
with policy variable prescriptions considered for the simulation exercise are specified in the
Table 2.1.
Source of Data for the Base Year
We have used RGI projections based on 2001 Census data for the age group-wise population.
With respect to age-specific mortality rate we have used SRS estimates for the year 2008. As
regards the age-specific literacy rate, we have used our estimates using unit record data of
NSSO 64th round (2007-08) survey on Literacy and Participation in Education (Sch. 25).
Projection Models
Both the population and literates projections are made using following simulation model by
taking year 2008 as the base year for the required parameters. The model specifications are as
follows.
Age Group Specific Population projection model specification:
Age Group Specific Literate population projections model specification – Without any policy intervention:
Li,j = {[(Li-1,j-1)/Zi) . (Zi-1 - (Zi-1 - 1))] + [(Li,j-1 - (ASDRi . Li,j-1)) . (Zi - 1)]} ... (2)
Age Group Specific Literate population projections model specification – With policy intervention in school education and in terms of adult literacy programmes:
Li,j = {[((Li-1,j-1)/Zi) . (Zi-1 - (Zi-1 - 1))] + [(Li,j-1 - (ASDRi . Li,j-1)) . (Zi - 1)] + [PIi,j]} ... (3)
PIi,j = (xi,j . ILPi,j)
P – Population; L – Literates
PI – Number of Illiterates made as Literates through Policy Intervention
ILP – Illiterate population; x – Percent of Illiterates targeted
i - ith age group (0-6, 7-9, 10-14, 15-19, ..., and 75 +)
j – jth Year (2008, 2009, ... 2050)
Z – age group interval (mostly 5 years age interval except 0-6, 7-9 and 75+ age groups)
ASDR – Age specific death/mortality rate of population (based on SRS)
i-1 and j-1 refer to immediate precedent age group and year
Given the projections of population and literates by age groups, the age specific literacy rates can be simply computed as:
ALRi,j = Li,j / Pi,j . 100 ... (4)
Finally the overall literacy is the summation of age-specific literacy rates:
LR(7+ pop),j = ∑ni ALRi,j . SPi,j ... (5)
ALR – Age-specific Literacy Rate
LR – Overall Literacy Rate
SP – Share of the ‘i’th age group in the total population
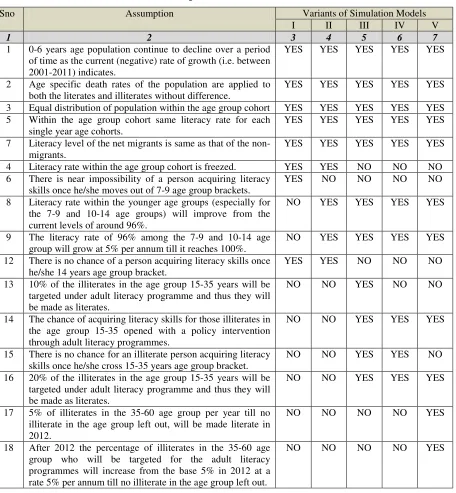
Having specified the simulation model, there are five variants of simulation models and the
specifications of five variants are as follows. Assumptions that apply to different Variants
simulation models are presented in the Table 2.1.
Variant II – In this simulation model policy intervention programmes in the school education of 5-14 years age group is assumed to improve literacy levels in the state.
Variant III – In this simulation model policy intervention through adult literacy programmes especially for the 15-35 years age group along with policy intervention programmes in the
[image:19.612.81.537.216.709.2]school education of 5-14 years age group is assumed to improve literacy levels in the state.
Table 2.1: Assumption of the Simulation Models
Sno Assumption Variants of Simulation Models
I II III IV V
1 2 3 4 5 6 7
1 0-6 years age population continue to decline over a period of time as the current (negative) rate of growth (i.e. between 2001-2011) indicates.
YES YES YES YES YES
2 Age specific death rates of the population are applied to both the literates and illiterates without difference.
YES YES YES YES YES
3 Equal distribution of population within the age group cohort YES YES YES YES YES 5 Within the age group cohort same literacy rate for each
single year age cohorts.
YES YES YES YES YES
7 Literacy level of the net migrants is same as that of the non-migrants.
YES YES YES YES YES
4 Literacy rate within the age group cohort is freezed. YES YES NO NO NO 6 There is near impossibility of a person acquiring literacy
skills once he/she moves out of 7-9 age group brackets.
YES NO NO NO NO
8 Literacy rate within the younger age groups (especially for the 7-9 and 10-14 age groups) will improve from the current levels of around 96%.
NO YES YES YES YES
9 The literacy rate of 96% among the 7-9 and 10-14 age group will grow at 5% per annum till it reaches 100%.
NO YES YES YES YES
12 There is no chance of a person acquiring literacy skills once he/she 14 years age group bracket.
YES YES NO NO NO
13 10% of the illiterates in the age group 15-35 years will be targeted under adult literacy programme and thus they will be made as literates.
NO NO YES NO NO
14 The chance of acquiring literacy skills for those illiterates in the age group 15-35 opened with a policy intervention through adult literacy programmes.
NO NO YES YES YES
15 There is no chance for an illiterate person acquiring literacy skills once he/she cross 15-35 years age group bracket.
NO NO YES YES NO
16 20% of the illiterates in the age group 15-35 years will be targeted under adult literacy programme and thus they will be made as literates.
NO NO YES YES YES
17 5% of illiterates in the 35-60 age group per year till no illiterate in the age group left out, will be made literate in 2012.
NO NO NO NO YES
18 After 2012 the percentage of illiterates in the 35-60 age group who will be targeted for the adult literacy programmes will increase from the base 5% in 2012 at a rate 5% per annum till no illiterate in the age group left out.
NO NO NO NO YES
Variant IV – It is similar to the Variant III. In this simulation model also policy intervention through adult literacy programmes especially for the 15-35 years age group along with policy
intervention programmes in the school education of 5-14 years age group is assumed to
improve literacy levels in the state. But the rate at which the percentage of illiterates in the
15-35 age group who will becomes literates through adult literacy programmes will be
higher. All the assumptions of the Variant III remain constant in this simulation model but the
at which the percentage of illiterates in the 15-35 age group who will be made literates
through adult literacy programme would vary.
Variant V –In this variant of simulation model the policy intervention through adult literacy programmes is applied to 35 to 60 years age group along with 15-35 age group and the policy
intervention programmes in the school education of 5-14 years age group, is assumed to
improve literacy levels in the state. In this variant of simulation all the assumptions of the
Variant IV remain constant. Besides the other assumptions are related to rate at which the
number illiterates in 35-60 year age group will be made literates.
Based on the above models and the model specific assumptions, projection results can be
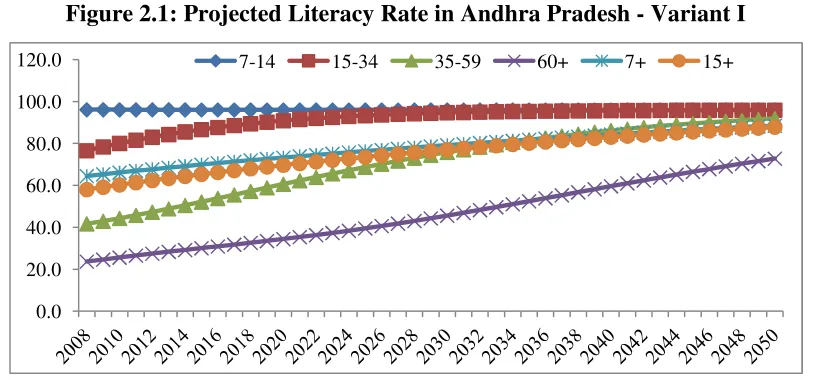
summarised as below. The trend in the projected literacy rate for Andhra Pradesh till 2050
based on the simulation model Variant I is presented in the Figure 2.1. Projections based on
this model indicate that Andhra Pradesh will not achieve 100% literacy rate even by 2050.
[image:20.612.103.511.521.711.2]The maximum possible literacy rate in the 7 + years age population will be around 88%.
Figure 2.1: Projected Literacy Rate in Andhra Pradesh - Variant I
Note: Age group specific Literacy Rates.
Source: Authors Projections. 0.0
20.0 40.0 60.0 80.0 100.0
The trend in the projected literacy rates for Andhra Pradesh till 2050 based on the simulation
model Variant IV is presented in the Figure 2.2. Projections on this model indicate that
although achieving 100% literacy rate even by 2050 is not possible, it can be improved
through school education and adult literacy programmes for the 5-14 and 15-35 age group.
[image:21.612.100.513.186.384.2]The maximum possible literacy rate in the 7 + age population will be around 95%.
Figure 2.2: Projected Literacy Rate in Andhra Pradesh - Variant IV
Note: Age group specific Literacy Rates.
Source: Authors Projections.
The trend in the projected literacy rates for Andhra Pradesh till 2050 based on the simulation
model Variant V is presented in the Figure 2.3. Projections on this model indicate that 100%
literacy rate possible by 2050. In this respect literacy levels have to be improved through
school education for the 5 to 14 year age group and adult literacy programmes for 15 to 35
years and 35 to 60 years age groups.
The trend in projected literacy rates for the 15 to 35 years age group Andhra Pradesh till 2050
based on the simulation model Variant I and IV is presented in the Figure 2.4. The illiterate
population in the 15 to 35 years age will be the target age group for the adult literacy
programmes in the state. The projections with Variant IV simulation model indicate that
when around 20% per year of the illiterates in the age group 15 to 35 years will be targeted
under adult literacy programme and thus they will be made as literates, the literacy rate in this
age group would be distinctively higher than the literacy rate projected with Variant I (under
the condition that there will not be any new policy intervention for improving literacy rate in
this age group). If the target of imparting literacy skills to the 20% of the illiterates in the 15 0.0
20.0 40.0 60.0 80.0 100.0
to 35 years age group per years will be made possible, by 2020 there is a chance of achieving
[image:22.612.97.519.125.342.2]100% literacy rate in this age group in the state.
Figure 2.3: Projected Literacy Rate in Andhra Pradesh - Variant IV
Note: Age group specific Literacy Rates.
Source: Authors Projections.
Figure 2.4: Projected Literacy Rate for 15-34 age group in A P - Variant I and IV
Note: Age group specific Literacy Rates.
Source: Authors Projections.
Similarly the trend in projected literacy rates for the 35 to 60 age group based on the Variant
I, IV and V of our simulation models is presented in the Figure 2.5. The illiterate population
in the 15 to 35 years age will be the target age group for the adult literacy programmes in the
state. The projections with Variant V simulation model indicate that when around 5% per
year of the illiterates in the age group 15-35 years will be targeted under adult literacy
programme and thus they will be made as literates, the literacy rate in this age group would
be distinctively higher than the literacy rate projected with Variant I and IV (under the 20.0
30.0 40.0 50.0 60.0 70.0 80.0 90.0 100.0
110.0 7-14 15-34 35-59 60+ 7+ 15+
70.0 75.0 80.0 85.0 90.0 95.0 100.0
[image:22.612.80.533.408.575.2]condition that there will not be any new policy intervention for improving literacy rate in this
age group). If the target of imparting literacy skills to the 5% of the illiterates in the 35 to 60
age group per year will be made possible, by 2020 there is a chance of achieving 100%
[image:23.612.80.522.180.359.2]literacy rate in this age group in the state.
Figure 2.5: Projected Literacy Rate for 35-60 age group in A P - Variant I, IV and V
Note: Age group specific Literacy Rates.
Source: Authors Projections.
All the above said and done given the policy intervention through school education and adult
literacy programmes for the 5 to 14 and 15 to 35 and 35 to 60 age groups and thereby
improvement in the literacy rate in these two age groups, the concern is what would be the
overall improvement. The trend in projected literacy rates for the 7 + age group Andhra
Pradesh till 2050 based on the simulation models Variant I, IV and V is presented in the
Figure 2.6. It indicates the state will achieve 100% overall literacy rate (for 7 + years age
population) at least by 2050.
When the 20% illiterate population in the 15 to 35 years age and 5% illiterate population in
the 35 to 60 years age will be the target age group for the adult literacy programmes and the
school education programmes ensures 100% enrolment of 5 to 14 years age group and thus
the 100% literacy rate among the 7 to 14 years age group in a few years ahead the overall
literacy (of 7 + year age population) will also be distinctively higher than the literacy rate
projected with Variant I (under the condition that there will not be any new policy
intervention for improving literacy rate in this age group). 35.0
45.0 55.0 65.0 75.0 85.0 95.0 105.0
Figure 2.6: Projected Literacy Rate (for 7+ age Population) in A P - Variants I, IV and V
Source: Authors Projections.
Similarly the concern is about the adult literacy rate in the state. The trend in projected
literacy rates among adults (i.e. for the 15 + years age group) in Andhra Pradesh till 2050
based on the simulation model Variant I and IV is presented in the Figure 2.7. The adult
literacy (of 15 + years age population) will be improved over that of the Variant I, with the
policy intervention through adult literacy programmes.
Figure 2.7: Projected Adult Literacy Rate (for 15 + age Population) in Andhra Pradesh - Variants I, IV and V
Note: Age group specific Literacy Rates.
Source: Authors Projections.
The projected literacy rate for Andhra Pradesh based on four variants of simulation models
across age groups are summarised in the Table 2.2. It indicates that without any new policy 60.0 65.0 70.0 75.0 80.0 85.0 90.0 95.0 100.0 105.0 2 0 0 8 2 0 1 0 2 0 1 2 2 0 1 4 2 0 1 6 2 0 1 8 2 0 2 0 2 0 2 2 2 0 2 4 2 0 2 6 2 0 2 8 2 0 3 0 2 0 3 2 2 0 3 4 2 0 3 6 2 0 3 8 2 0 4 0 2 0 4 2 2 0 4 4 2 0 4 6 2 0 4 8 2 0 5 0
Variant V Variant I
Variant IV 55.0 60.0 65.0 70.0 75.0 80.0 85.0 90.0 95.0 100.0 105.0 2 0 0 8 2 0 1 0 2 0 1 2 2 0 1 4 2 0 1 6 2 0 1 8 2 0 2 0 2 0 2 2 2 0 2 4 2 0 2 6 2 0 2 8 2 0 3 0 2 0 3 2 2 0 3 4 2 0 3 6 2 0 3 8 2 0 4 0 2 0 4 2 2 0 4 4 2 0 4 6 2 0 4 8 2 0 5 0
[image:24.612.81.535.471.678.2]intervention, the improvement in literacy rate will be very slow in the state. By 2050 it can
achieve only 88% literacy rate. The improvement in literacy would be due to demographic
change only. When the policy intervention through school education programmes ensures the
100% school attendance rate especially for 5-14 age group and thus the 100% literacy rate in
the 7 to 14 years age, the overall literacy can be improved marginally when compared to that
of the situation without any policy intervention with respect to adult literacy. It is because
when the chance of becoming a literate is only possible through formal schooling and for the
7 to 14 age groups and thus those crossing 14 years loses the chance of acquiring literacy
skills. The chances of acquiring literacy skills through informal methods without any target
adult literacy programmes meant for 15 + years age group illiterates are very meagre. It takes
[image:25.612.104.508.326.712.2]time to the passage of the current 7-14 age cohort through different age groups.
Table 2.2: Prospects of Literacy Rate in Andhra Pradesh Age Group
/ Simulation Variant
Base Year Projections for the Year
2008 2015 2020 2030 2040 2050
1 2 3 4 5 6 7
Variant I
7-14 96.14 96.05 96.02 96.00 96.00 96.00
15-34 76.59 86.66 90.88 94.70 95.71 95.94
35-59 41.73 52.17 60.65 75.82 86.21 91.91
60 + 23.71 30.08 34.44 45.60 59.62 72.82
7 + 64.48 69.92 73.28 79.19 84.30 88.53
15 + 58.06 65.31 69.70 77.06 83.05 87.83
Variant II
7-14 96.14 100 100 100 100 100
15-34 76.59 87.18 92.35 97.68 99.41 99.86
35-59 41.73 52.17 60.66 76.22 87.60 94.38
60 + 23.71 30.08 34.44 45.60 59.71 73.31
7 + 64.48 70.72 74.37 80.78 86.34 91.02
15 + 58.06 65.56 70.34 78.34 84.89 90.18
Variant III
7-14 96.14 100 100 100 100 100
15-34 76.59 96.86 100 100 100 100
35-59 41.73 55.91 68.81 86.98 95.69 98.81
60 + 23.71 30.08 34.51 47.83 66.64 82.42
7 + 64.48 75.83 80.19 86.12 91.21 95.10
15 + 58.06 71.57 77.08 84.37 90.27 94.64
Variant IV
7-14 96.14 100 100 100 100 100
15-34 76.59 98.59 100 100 100 100
35-59 41.73 54.76 68.32 86.79 95.66 98.81
60 + 23.71 30.08 34.45 47.33 66.16 82.17
7 + 64.48 76.11 80.00 85.96 91.09 95.04
15 + 58.06 71.91 76.86 84.19 90.14 94.57
Variant V
7-14 96.1 100 100 100 100 100
15-34 76.5 96.7 100 100 100 100
35-59 41.7 81.6 95.7 99.8 100 100
60 + 23.7 31.2 44.3 75.9 91.9 97.5
7 + 64.4 84.8 91.2 95.9 98.3 99.4
15 + 58.0 82.1 89.8 95.3 98.1 99.3
Note: 1. Age group specific Literacy rate (percentage of literates to the population within the age group); 2. 2008 is the base is year.
The policy intervention through adult literacy programmes can change situation and can
improve the literacy levels among the adults where a large stock of illiterates lie. However,
for the adult literacy programmes especially under the National Literacy Mission (NLM)
illiterate population of 15-35 years age is the target age group. A large stock of illiterates who
were not in this age group and crossed 35 years of age and entered into 35 + age population
will remain as illiterates till their mortality.
III Need for Adult Education/Literacy Programmes
Projections presented above indicate that there is need for policy intervention through school
education programmes and adult literacy programmes for the improvement literacy levels in
the state. As the literacy rates among the 7-14 age groups is reaching saturation point, all the
younger age cohorts (below 15 years age) becomes literates very soon. However, the due to
decelerating growth and declining size of younger age population, it can contribute
marginally to the overall literacy rate as there is a huge stock of adult illiterates. The
improvement in school education targeting 100% enrolment and universal primary
completion ensures 100% literacy among the young (below 15 years age). If this is the only
medium of improving literacy levels without any initiative for adult illiterates, it takes long
time (at least a century) achieve 100% literacy rate in total population. It will possible when
the 100% literacy of school age population sustained forever and this 100% literacy rate age
cohort grows older and older. On the other hand, it is possible when all the adult illiterates
becomes older and ultimately die.
In this context, a policy intervention through adult literacy programmes is a necessary
condition to address the phenomenon of illiteracy. In this respect there have been initiatives
the Indian context. At the national levels eradication of illiteracy has been concern since
independence. However, policy attempts Non-Formal Education for the Youth in 1975,
National Adult Education Programme in 1978. Thereafter, establishment of National Literacy
Mission (NLM) in 1988 was an important policy intervention for liquidating the illiteracy.
The NLM has three components in the Total Literacy Campaign (TLC), Post Literacy (PLP),
and Continuing Education Programme (CEP). They are continuously interlinked programmes
for improving adult literacy. The Total Literacy Campaign is to turn as many illiterate adults
as to literates by motivating and facilitating the acquisition of basic literacy skills (reading,
skills of the neo-literates. The Continuing Education Programme (CEP) is meant for those
have acquired literacy skills and retained with PLP and interested in further education and
vocational education, occupational skills. Initially the implementation of NLM was selective
and the success of the selective implementation ensured the scaling up of the Mission and
turned into a mass programme. However, the execution of NLM and implementation of its
three-tier programmes resulted in a very poor outcomes (see Rao, 1993; Banerjee, 1993 &
1994; GoI, 1994; Ghosh, 1997; Mishra, 1998; Saldanha, 1999; Karlekar, 2004). Although
one cannot ignore the success stories of the NLM in different parts of the country, its
shortcomings have resulted in poor outcomes in general3. A promising and intrinsically good
programme inflicted with serious weakness (GoI, 1994; Banerjee, 1994).
Many times it could not ensure adequate acquisition of literacy skills for the neo-literates
(ibid). Further, there was a problem of relapse into illiteracy - the loss of newly acquired
fragile literacy skills due to long delays between the initial literacy programs and the start-up
activities of the PLP (Karlekar, 2004). Besides, there was a problem of loss of interest in
continued learning because of a paucity of relevant materials in native languages and the lack
of a perceived value for further education as a means of social and economic development
(ibid). Such a problem of relapse into illiteracy led to fragility in literacy achievement
through TLC (GoI, 1994; Banerjee, 1994). On the learners’ point of view too, there was a
failure of many adults to acquire initial literacy skills due to lack of perceived need, work
schedules, or family needs (Karlekar, 2004).
Despite of all the weakness and problems, a numerous adults acquired initial literacy and a
useful percentage did sustain and advance their literacy and education in post- literacy and
continuing education (Karlekar, 2004). Besides, there were ‘externality’ and ‘multiplier’
effects of the literacy campaign (ibid). One of such externality of TLC is the social
mobilization especially the women4 (Ghosh, 1997). One of such success stories is the
women’s mobilization as an unintended outcome of the TLC’s literacy primer in Andhra
Pradesh. It began with a fight against distribution of arrack in a Village of Nellore district and
3
The NLM’s initial strategy of implementing TLC at the district level with a wider public participation, on pilot basis in southern states observed to be successful (Ghosh, 1997). The success of the TLC faded away when it was scaled up to many other districts across states especially to educational backward states and region (Ghosh, 1997, Saldanha, 1999). The initial wider public participation was replaced with over bureaucratisation (Ghosh, 1997). The target obsessed bureaucratic implementation resulted in fudging the number of neo-literates (GoI, 1994; Banerjee, 1994).
4
had spread all over the state eventually resulted in the invocation of prohibition law in the
state (Pattanaik and Reddy, 1993; Ghosh, 1997).
However, the success story of Kerala and Tamil Nadu to some extent is not replicated any
other state in India, so is in Andhra Pradesh. It interesting to note that at height of extremism
prevailing in parts of the state during early 1990s, the TLC was one of the State’s initiates
that were approved by extremists in the state (Rao, 1993). Also, Andhra Pradesh has
presented a success story of impact of literacy primer in the form women’s mobilization and
fight against arrack that mentioned above. But when we examined the impact of TLC on
improving literacy rate, as we have observed from the above analysis it was very meager in
the state.
It is also true for the country as a whole too. The overall intended impact of the programme
on improving the literacy rate in India was very meager. It might be due to problems of the
programme in promoting and assessing the acquisition of initial literacy and the need for
post- literacy and continuing education programmes to sustain literacy and promote
continued learning and knowledge development (Karlekar, 2004).
Instead of the revitalising and strengthening the total literacy programme, it is almost
scrapped all over the country, in Andhra Pradesh too. One can observe that the number of
TLC and PLP centres at the national levels reduced to a few and they almost disappeared in
the context of Andhra Pradesh. In contrast there are number of CEP centres in the state as
well as in the country. In fact CEP is transition phase evolves through TLC and PLP. Thus
what does the presence of CEP centres in the state without TLC and PLP centre indicate, is it
that necessity of TLC centre is over, had the TLC achieved its targets in the state as well as in
the country? One may not get an answer but one can say there is a need for continuance of
these adult literacy programmes in the state as well as in the country as a whole.
The simulation exercise that explored the prospects of literacy levels in the state indicates that
unless the state policy concentrates on improving adult literacy and hence designs
appropriates programmes especially for illiterates of both the 15-35 and 35 to 60 age groups
and implements them rigorously, achieving 100% literacy rate in the state is simply not
possible in the near future (even by 2050). Hence, there is a strong need for rejuvenating the
State Literacy Mission (SLM) and designing state specific adult literacy programmes if the
The Total Literacy Campaign (TLC) under the National Literacy Mission (NLM) of India
targets only 15-35 age group illiterate population. But there is a sheer need to target the 35 to
60 age group illiterates and even the older age illiterate population under the adult literacy
programmes in order to achieve 100% literacy rate in the state in the near future.
Unless the state improves its literacy levels remarkably, it will remain one of those poor
performing states in India in terms of human development index (HDI) and ranking of states
based it. Because education is one of the three components with one-third weight each
involved in the computation of HDI. Adult literacy is one of the two sub-components and
accounts two-thirds of weight in the education component.
IV Concluding Remarks
The performance of the state with respect to literacy rate in the all India context especially
when compared to the other states is relatively poor. The recent data has also shown the poor
performance of the state during the last decade when compared to that of the previous
decades. Therefore there is a cause of concern for the state policy. In this regard an attempt is
made to explore the prospects of literacy rate in the state through simulation exercise. These
simulation exercises indicate the impossibility of achieving 100% literacy rate in the near
future for the state Andhra Pradesh. But it can achieve 95% of literacy rate by 2050 if the
state can rigorously implement the adult literacy programmes for at least 5 years period from
2012 for the age group 15 to 35 years age group covering all those illiterates in this age
group. Moreover, if the state can extend the adult literacy programmes for the 35 to 60 years
group and implement the programme for at least 5 years period from 2012, the state can
achieve 100% literacy rate by 2050. Therefore, achieving the goal of 100% literacy rate in the
state depends on its policy intervention through adult literacy programmes, rigour in their
implementation and their coverage. It is important because unless the state improves its
literacy levels remarkably, it will remain one of those poor performing states in India in terms
of human development index (HDI) and ranking of states based it.
Reference
APHDR (2008) Human Development Report 2007: Andhra Pradesh, Centre for Economic and Social Studies, Hyderabad.
Balagopal, K (1992) “Slaying of a Spirituous Demon”, Economic and Political Weekly, Vol. XXVII, No. 46, November, 14.
Banerjee, Sumanta (1993) “Revisiting the National Literacy Mission”, Economic and Political Weekly, Vol. 28, No. 25 (Jun. 19, 1993), pp. 1274-1278.
Banerjee, Sumanta (1994) “Flowers for the Illiterate”, Economic and Political Weekly, Vol. 29, No. 48 (Nov. 26, 1994), pp. 3013-3016.
Barro, Robert J. (1997), Determinants of Economic Growth: A Cross-country Empirical Study, Lionel Robbins Lectures, The MIT Press, Cambridge.
Barro, Robert J. and Xavier Sala-i-Martin (2004), Economic Growth, 2nd Edition, The MIT Press, Cambridge.
Basu, Kaushhik and James E. Foster (1998) “On Measuring Literacy”, Economic Journal, Vol. 108, November.
Basu, Kaushhik; James E. Foster and S. Subramanian (2000) “Isolated and Proximate Illiteracy and Why These Concepts Matter in Measuring Literacy and Designing Education Programmes”, Working Paper No. 00-W02, Vanderbilt University, Nashville.
Bordia, Anil and Anita Kaul (1992) “Literacy Efforts in India”, Annals of the American Academy of Political and Social Science, Vol. 520, World Literacy in the Year 2000 (Mar., 1992), pp. 151-162.
Dreze, Jean and Jackie Loh (1995) “Literacy in India and China”, Economic and Political Weekly, November 11.
Ghosh, Avik (1997) “Adult Education: Looking Beyond Literacy Campaign”, Economic and Political Weekly, Vol. 32 (51), December 20.
Gibson, John (1999) “Literacy and Intra-household Externalities”, World Development, Vol. Xx.
GOI (1994) Evaluation of Literacy Campaign in India: Report of Expert Group(REG), National Literacy Mission, Directorate of Adult Education, Ministry of Human Resource Development, Government of India, New Delhi.
Govinda, R and K. Biswal (2005) “Mapping literacy in India: who are the illiterates and where do we find them?”, Background paper prepared for the Education for All Global Monitoring Report 2006 -
Literacy for Life, UNESCO.
Gupta, Shaibal (2000) “Status of Literacy in India”, Asian Development research Institute, Paper presented at the Summer Literacy Training Programme (SLTP), 2000, International literacy Institute, University of Philadelphia, July 5-28, 2000.
Karlekar, Malavika (2004) Paradigms of Learning: The Total Literacy Campaign in India, Sage, New Delhi.
Kothari, Brij and Tathagata Bandyopadhyay (2010) “Can India's "literate" read?”, International Review of Education, Vol. 56, No. 5/6 (2010), pp. 705-728
Mehrotra, S. K.; P. R. Panchamukhi; Ranjana Srivatsava; Ravi Srivatsava (2005) Universalisation of Elementary Education in India: Uncaging the ‘Tiger’ Economy, O U P, New Delhi.
Mishra, Lakshmidhar (1998) “National Literacy Mission: Retrospect and Prospect”, Economic and Political Weekly, Vol. 33, No. 44 (Oct. 31 - Nov. 6, 1998), pp. 2807-2815.
National Literacy Mission (1994) “Evaluation of Literacy Campaigns in India: Report of the Expert Group”,
NLM, Ministry of Human Resource Development, GOI, New Delhi.
Patnaik, Arun and D. Narasimha Reddy (1993) “Anti-Arrack Agitation of Women in Andhra Pradesh”,
Economic and Political Weekly, Vol. XXVIII, No. 21, May 21.