ISSN (Online) : 2319 - 8753
ISSN (Print) : 2347 - 6710
I
nternationalJ
ournal ofI
nnovativeR
esearch inS
cience,E
ngineering andT
echnologyAn ISO 3297: 2007 Certified Organization, Volume 2, Special Issue 1, December 2013
Proceedings of International Conference on Energy and Environment-2013 (ICEE 2013)
On 12th to 14th December Organized by
Department of Civil Engineering and Mechanical Engineering of Rajiv Gandhi Institute of Technology, Kottayam, Kerala, India
DEVELOPMENT OF GIS BASED DISASTER RISK
INFORMATION SYSTEM FOR DECISION MAKING
Gangapriya P, Indulekha K P
M.Tech Student,
Dept. of Civil Engineering,
College of Engineering Trivandrum, Kerala, IndiaAssistant Professor,
Dept. of Civil Engineering,
College of Engineering Trivandrum, Kerala, IndiaABSTRACT
Disasters can occur as a consequence of the impact of a natural or a human caused hazard. This study aims to analyze the multiple hazards of Thiruvananthapuram district. The disasters considered for the study are flood, forest fire, coastal erosion and drought. Separate methodology is developed for each of these disasters to analyze the severity of hazard. The results obtained from the study reveals that Thiruvananthapuram district is prone to flood, drought, coastal erosion and forest fire. The integration of individual disaster maps created the multi hazard map of the study area. It indicates some of the regions in study area prone to multiple hazards. By using these databases a risk information system for disaster management in Thiruvananthapuram district was developed. The web based disaster management systems can reduce the pressure of organizers to manage information and data directly after a disaster and in the midst of a time of crisis.
NOMENCLATURE
CVI
Coastal Vulnerability Index FR
Numerical index of fire risk
λNIR reflectance in the near infrared (NIR)
λRED reflectance in the red bands
NDVI
Normalized Vegetation Index SPI
Standard Precipitation Index
1. INTRODUCTION
and the behavior and patterns of particular hazards [1].
The field of disaster management has greatly benefited from recent advancements in computers and related technology. In particular, GIS, remote sensing, and the Internet have had a significant impact, and are currently being used in a variety of ways during all phases of disaster management. Integrating these technologies to create a spatial decision support system offers new possibilities for disaster management, particularly during the initial response phase of a disaster.
The State of Kerala is prone to a host of natural hazards such as coastal erosion, flood, drought, lightening, landslide and earthquake [5]. All most all districts of Kerala are multi-hazard prone. In Thiruvananthapuram district 12.23% of the total area is flood prone and 41.11% of the total coast is eroding.
The earlier studies of disasters in the study area mainly deal with single hazards and its management plans. This study brings out multiple hazards mapping of a particular area. The concept of a disaster information system is new for the study area.
1.1.Literature review
Cees J. van Westen (2008) studied about remote sensing and GIS for natural hazards assessment and disaster risk management. The use of earth observation (EO) products and geo information systems (GIS) has become an integrated, well developed and successful tool in disaster risk management. Hazard and risk assessments are carried out at different scales of analysis, ranging from a global scale to a community level.
Quan-guo LI, Ling KANG, Dong-qi TANG and Yun-long ZHU (2011) made a study on applications of spatial information technology in natural disasters. This paper analyzes the uses of spatial information technology in the field of investigation and identification, distribution and law, risk evaluation and zoning, loss assessment, forecasting and dynamic monitoring of the application in natural disasters.
1.2. Objective
The present study attempts to bring out the information about different disasters experiencing in Thiruvananthapuram district and develop a disaster information system which will be useful for disaster management practices.
1.1. Study area
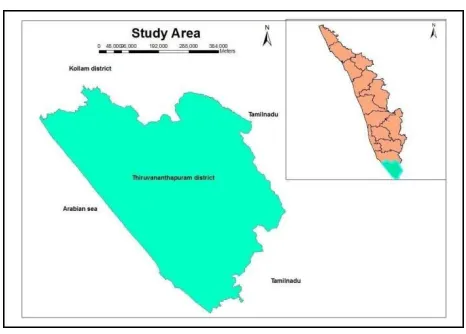
Thiruvananthapuram, the southernmost district of Kerala State is situated between north latitudes 8˚17 and 8˚54 and east longitudes 76˚ 4 and 77˚ 17. The district stretches 78 kms along the shores of the Arabian Sea on the west, Kollam district lies on the north, Thirunelveli and Kanyakumari districts of Tamil Nadu on the east and the south respectively. Location map of the study area is shown in figure1.
The State‘s geographical location, weather pattern and high population density makes it prone to
Fig 1: Location map of study area
2. METHODOLOGY
Multi hazards are identified from the literatures, past studies and enquiries to the experts. Methodology for the mapping of each single hazard is adopted from earlier researches and then developed a strategy to prepare multiple hazard maps. Each hazard mapped separately with the help of GIS techniques. Then a weighted overlay analysis had been carried out to obtain multi hazard map. By using this database a disaster information system were created.
2.1. Flood
Rainfall, elevation, slope, drainage density, road density and landuse type data layers that were selected as input data for assessing flood hazard. Selection of these factors was based on the previous studies. Flood hazard map was created by using the weighting and ranking technique. Risk refers to the threat to life or property that may result from the action of a hazard upon some structure, system, or population. Flood risk map was created by using the same weighting and ranking technique used for mapping flood hazard areas. Hazard, population, and landuse types were selected as the most influential factors in evaluating flood risk. A flood risk map then was created by overlaying the flood hazard map with the population density and then the land use maps.
The total estimated risk, obtained by adding the weighted risk rankings of all factors, also was classified in five categories; very low, low, moderate, high, and very high risk.
2.2. Coastal Erosion
To address the multi-faceted task of predicting sea-level rise impact, the USGS has implemented a methodology to identify areas that may be most vulnerable to future sea-level rise (Hammar-Klose and Thieler, 2001). This technique uses different ranges of vulnerability (low to very high) to
describe a coast’s susceptibility to physical change as sea level rises. The vulnerability determined
here focuses on six variables which strongly influence coastal evolution [3].
assigned a vulnerability value for each specific data variable, the CVI is calculated as the square root of the product of the ranked variables divided by the total number of variables.
CVI
a
b
c
d
e
f
(1)
6
Where,
a = geomorphology
b = shoreline erosion/accretion rate c = coastal slope d=relative sea-level rise rate
e= mean wave height f= mean tide range
2.3.Forest Fire
The most important factors leading to accidental fires in the Trivandrum reserve forest are the vegetation type and density, humidity of the area, proximity to settlements and distances from roads. Thematic maps were prepared separately based on their sensitivity to forest fire as very high, high, moderate or low. Then suitable weights were assigned.
The equation used in a GIS for the fire risk modelling and or mapping the fire risk areas is:
FR=10F
i=1–11
+ 2H
j=1–4
+2R
k=1–4
+3S
l=1–6 (2)
Where,
FR - Numerical index of fire risk,
F- Vegetation variable (with 1–11 classes ),
H- Indicates proximity to human habitation (with 1–4classes), R- The road factor (with 1–4 classes) and
S - Slope factor (with 1–6 classes).
The superscripts i , j, k, l indicate subclasses based on importance in determining the fire risk.
2.4. Drought
Calculation of drought is based on Standard Precipitation Index (SPI) and Normalized Vegetation Index (NDVI).
The SPI calculation is based on the long term precipitation record for a time period. This long term record is fitted to a probability distribution, which is transformed into a normal distribution where the mean SPI for the location and desired time period is zero[3].
Tucker in 1979 suggested NDVI as an index of vegetation health and density.
NDVI = (λNIR - λRED) / (λNIR + λRED) (3)
Where,
λNIR - reflectance in the near infrared band
λRED - reflectance in the near red band
2.5. Multi hazard map
The overlay analysis of flood hazard map, coastal erosion map, forest fire map and drought map created the multi hazard map of the particular study area. It provides the specific locations or areas that have a certain set of attribute values, that is, match the criterion which is specified. This approach is often used to find locations that are suitable for a particular use or are susceptible to some risk.
2.6 User interface
The web-based GIS used to design the web application interface in this work consist of two parts. The first part is the server side, which was developed using Geoserver open source software and Apache web server to augment point observations with other GIS data layers. This is the basic function of web-based GIS system which allows users to navigate and visualize areas of interest on maps at different scales according to the selected areas. The second part of the system is web client interface which is developed using JAVA and PostgreSQL which establishes a web database connection that enables users to integrate web-based map browsing, spatial query, data services, and map overlaying capabilities. Therefore, based on the selection of parameters by the user, a PostgreSQL could be built and sent to the database server for execution. As well as, the results of the execution can be obtained by the web application server and converted into JAVA format to display in the client-side web browser.
3. RESULT AND DISCUSSION
3.1 Flood
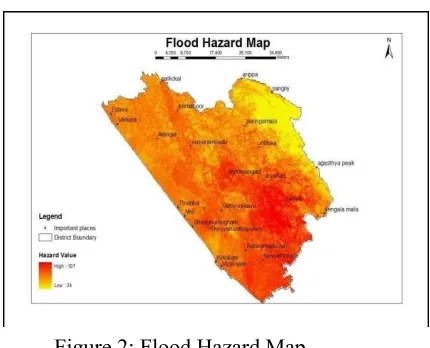
Figure 2: Flood Hazard Map
Flood is one of the most devastating natural hazards which lead to the loss of lives, properties and resources. In Thiruvananthapuram district a total area of 2172 km2 is affected by flood. In that 153.54 km2 is having very high flood risk and 1018.31km2 area having high flood risk.
Flood hazards are mainly located nearer to the water bodies especially rivers and the areas are having lower elevation values. Due to the type of use, certain areas on the flat relief such as coastal plains are having moderate high values.
3.2. Coastal Erosion
Fig 3: Coastal vulnerability map
The rate of shoreline change from the year 1973 to 2008 is calculated using DSAS tool. The coastal vulnerability of Thiruvananthapuram district is shown in figure3.
The calculated CVI value along the study area of Thiruvananthapuram coastline ranges from 1.73 to 8.66. The mean CVI value is 5.10. The 25th, 50th and 75th percentile of CVI value are 4.73, 6.03 and 9.39 respectively. Those grids having CVI value ranging from 0 to 4.73 is taken as low vulnerable area, grids having CVI value from 4.73 to 6.03 is taken as medium vulnerable area, grids having CVI value from 6.03 to 9.39 is taken as high vulnerable area and grids having CVI value greater than 9.39 is taken as very high vulnerable area.
The coastal vulnerability is lower at Kovalam, Edava, Kayikkara and pulinkudi and Puvar, Vettur etc are high vulnerable regions. Meenamkulam to Karikkakam and Puvar region shows higher erosion. The rate of shoreline change shows increments in every year. In this region observed a mean erosion rate of -6.38 and mean accretion rate of 10.39mm. Out of 78kms coastal stretch, 14.3 km is highly vulnerable, 21km is having low vulnerability and 42.7 km is moderately vulnerable.
3.3. Forest Fire
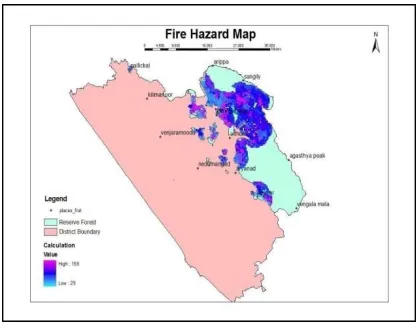
Thiruvananthapuram district have 498.61km 2 of forest area. In that a total area of 260.98km2 forest region is affected by forest fire. 42.38 km2 area of Thiruvananthapuram reserve forest is prone to very high forest fire risk and an area of 99.29 km2 prone to high forest fire risk.
The risk calculated based on the chances occurrence of fire near to the settlement. Palode, Kulathupuzha and neyyar ranges of Thiruvananthapuram reserve forest region is having higher hazard values. Peringamala, ponmudi, vithura, Chekkonam and Mylamudu sections of Thiruvananthapuram reserve forest is prone to higher forest fire risk. The forest fire hazard map of Thiruvananthapuram reserve forest is shown in figure 4.
3.4. Drought
Fig 5: Drought map
For this study the drought map was created from the agricultural drought map and meteorological drought map. Agricultural drought map was prepared from normalized vegetation index map of the study area. From the standardized precipitation index the meteorological drought map were prepared.
Most of the regions in Thiruvananthapuram district coming under the high drought hazard category. 3.92km2 area of Thiruvananthapuram district is prone to very high drought risk and 1266.62km2 area shows high drought risk. Very high drought is present in the places nearer to Veli and Shanghumugham and Places nearer to Thiruvananthapuram city. The forest region shows lower drought hazard values. The drought hazard map of Thiruvananthapuram is shown in figure 5.
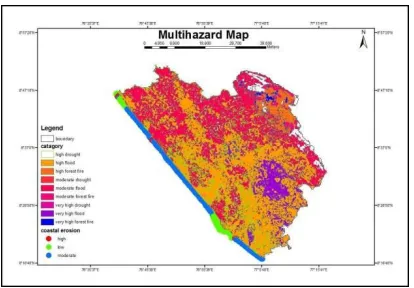
3.5 Multi hazard map
The union process of flood hazard map, coastal erosion map, forest fire map and drought map created the multi hazard map of the particular study area. The study area has an area of 2192km2. In that 200.20 km2 comes under very high hazard category and 1689.73 km2 area under the high hazard category. Most of the regions in Thiruvananthapuram district are affected by any one of the hazard or more than one hazard.
3.6. User Interface
A web application interface called Disaster Risk Information System was created. This provides information related to hazards, its severity, population, landuse and the administrative region. In the module for displaying the information of disasters, there is an option for the user to select the hazard. Then the details corresponding to that disaster, its severity, the administration region, landuse category and population density are displayed. It provides the facility to choose more than one hazard at a time.
4.
CONCLUSIONA disaster is comprised of three components; hazard, risk, and vulnerability. The hazard is the probability of the occurrence of a potentially damaging phenomenon within a given period of time and space. In this study the study area prone to four kinds of disasters. They are flood, coastal erosion, drought and forest fire.
Thiruvananthapuram district a total area of 2172 km2 is affected by flood. Flood hazards are mainly located nearer to the water bodies especially rivers and the areas are having lower elevation values. Due to the type of use, certain areas on the flat relief such as coastal plains are having moderate high values.
The rate of shoreline change shows increments in every year. In this region observed a mean erosion rate of -6.38 and mean accretion rate of 10.39mm. out of 78kms coastal stretch, 14.3 km is highly vulnerable, 21km is having low vulnerability and 42.7 km is moderately vulnerable.
The low and mid land regions of Thiruvananthapuram district have higher range of drought. The forest region shows lower drought hazard values.
In Thiruvananthapuram district a total area of 260.98km2 area of forest region is affected by forest fire. Most of the regions in Thiruvananthapuram district are affected by any one of the hazard or more than one hazard. A disaster risk information system is developed for Thiruvananthapuram district using Geoserver. It displays the hazard category, severity of hazard, panchayath, population and landuse. Internet based GIS could play a key role in the collection and dissemination of relevant information in a fast, relatively inexpensive and straightforward manner during various stages of a disaster life cycle. Computer based disaster management systems reduce some of the pressure of having to organize information and data directly after a disaster and in the midst of a time of crisis. They provide decision makers with the information that they require to develop and maintain their understanding of the spatial characteristics of a natural disaster, and its impacts over a range of time.
5. ACKNOWLEDGMENT
REFERENCES
[1] Alexander D (1991) “Information technology in real- time for monitoring and
managing natural disasters”, Process in Physical Geography 15 (3), pp 238-260.
[2] Cees J. van Westen(2008) “Remote Sensing and GIS for Natural Hazards Assessment and Disaster Risk Management”. Thesis report.
[3] Charlchai Tanavud, Chao Yongchalermchai, Abdollah Bennui and Omthip Densreeserekul (2004), “Assessment of flood risk in Hat Yai Municipality, Southern Thailand, using GIS” , Journal of Natural Disaster Science 20 04, pp1
[4] G.S.Dwarakish, S.A.Vijay, Usha Natesan, Toshiyuki Asano, Taro Kakinuma, Katta Venkataramana,
B.Jagadeesha Pai and M.K.Babitha (2009) “Coastal vulnerability assessment of the future sea level rise in Uduppi coastal zone of Karnataka state, west coast of India” ,Ocean & Coastal Management, pp 467- 478.
[5] Hasan Murad and A. K. M. Saiful Islam (2011) “drou ght assessment using remote sensing and gis in North-west region of bangladesh”, 3rd International Conference on Water & Flood Management (ICWFM-2011).
[6] Kerala State Disaster Management Plan Profile, Kerala State Disaster Management Authority, 2010.
[7] Rajeev Kumar Jaiswal, Saumitra Mukherjee, Kumaran D. Raju, Rajesh Saxena (2002) “Forest fire risk zone map ping from satellite