ISSN 2286-4822 www.euacademic.org
Impact Factor: 3.1 (UIF) DRJI Value: 5.9 (B+)
Relationship between Tiller Development and
Productivity with Yield and Its Components for
Wheat and Oat under the Influence of A.I.I and GA3
FAISAL M. M. AL-TAHIR
Field Crop Department College of Agriculture, University of Muthanna Iraq
Abstract:
The present studies aimed to investigate the effect of spraying with concentrations of IAA and GA3 (0, 40 and 80 mg. L-1) and the
interaction between them on Tiller Development and Productivity and relationship with Yield and Its Components for Wheat and Oat in Muthanna province in the southern of Iraq. Wheat cultivar (Ipa-95) and Oat cultivar (Wallaro) were planting in 2013/2014 season. Experiments were conducted in R.C.B. Design with three replicates.
The data indicated that the increasing in some studied characteristics (productive tillers number, tillers grain weight, grain/ spike, grain weight (g) and grain yield) related to increased concentrations of A.I.I and GA3 while, total number of tillers, surviving tillers and non productive tillers decreased continuously with increasing concentrations of A.I.I and GA3 during the growth period, . The concentrations of A.I.I and GA3 used, has non-clear effect on Tiller Straw weight (g).
Influence of A.I.I and GA3
and 41.19 % for wheat crop respectively and 39.11 and 39.01 for oat crop for respectively.
Key words: I.A.A, GA3, Tillering, wheat, oat, Grain yield
Introduction
The production of tillers from axillary buds in the Gramineae is of considerable scientific and practical importance. However, in contrast to the extensive literature on dicotyledons, there is general lack of clarity in the understanding of bud growth control in the ramineae. One of the main reasons for this is that the apical meristem in grasses is not readily accessible until after inflorescence emergence and the axillary buds are protected by their subtending leaf sheath (Johnston and Jeffcoat, 1977). Tillering is an important agronomic trait for grain and forage production (Li et al., 2003), and the number of tillers is dynamic and adjustable (Kariali and Mohapatra, 2007). Although moderate tillering contributes greatly to rice yields, excessive tillering leads to high tiller abortion, poor grain setting, and small panicle size and ultimately reduces grain yield (Peng et al., 1994). Rice tillers develop from tiller buds. Under normal conditions, as much as 70% of the grain yield comes from the tillers. Tillering also enables the plant to adapt to different conditions. Few tillers develop when moisture, nutrition, and other conditions are poor, whereas numerous tillers that increase the yield potential form when conditions are favorable (Thiry et al., 2002).
Influence of A.I.I and GA3
90 days (Vuorinen and Kangas, 2002 ; Matthew et. al, 2000) . PGR induced effects and the potential to manipulate cereal growth and yield formation may differ markedly according to growing conditions, especially daylength and management practices. The control of tillering in grasses has proven to be multi-factorial and very complex, and although recent research has provided insight into the contribution of many genetic and physiological factors and their interaction with the environment, there is still need for a unifying theoretical synthesis of known effects (McSteen, 2009 ; Silvia and Jorge, 2010). Weight of 100 grains and spikes weight increased with application (2 %) of A.I.I and GA3 and application of IAA and GA3 individually having no effect, while the addition of both together to the plant ecology, lead to significant synergistic effect on the elongation of phalangidae [12 ], who reported that GA3 depend on IAA in appearance of their effect (Gherroucha, 2011).
Influence of A.I.I and GA3
Gibberellins regulate seed germination, growth of the root and shoot (leaves and stem), the transition from the vegetative to the reproductive state, including floral apex induction, sex expression, organ growth within the developing flower and fruit set. Pollen germination and pollen tube growth are also controlled by GAs, as is fruit growth. generally, it can be concluded that gibberellins tend to cause less development of axillary buds, and also to promote the elongation of already initiated stems (including tillers) ( Jewiss 1972 ; Rajala and Peltonen-Sainio, 2001). On the other hand, there is quite clear evidence indicating that the application of gibberellins inhibitors promotes tiller initiation, in parallel with stunting of the main axis of the plant (Lee et al., 1998). Gibberellins are also important regulators of flowering in cereals and grasses.
The objective of the study was to investigate the relationships between IAA and GA3 in the regulation of tillering growth and its impact in yield and its components in wheat and oat crops.
Materials and Methods
Wheat cultivar (IPA-95) and Oat cultivar (WALLARO) were planting in 15 November 2013/ 2014 in soil its chemical and physical properties are shown in table (1) located in Muthanna province in the southern of Iraq. Experiments were conducted in R.C.B. Design with three replicates. Plot size of 1 x 1 meter with 20 cm row to row distance.
Influence of A.I.I and GA3
compounds A.I.I and GA3 were all applied at three concentrations (0, 40 and 80 mg. L-1).
In maturity measured number of tillers (total, Surviving, productive and non productive per meter square), weight of Productive tiller (straw and grain) per (g), grains per spike (mean of 20 spike), weight of grain (g), grain yield (ton. ha) and harvest index (calculated as the ratio of the weight of the grain to the total plant weight) .
Data were analyzed statistically and the regression coefficients using SPSS 14.0 for windows at probabilistic 0.05.
Table (1) Physical and Chemical properties of the experiment soil
Texture pH Ec.
des./m
Soil structure % Minerals % Sand Loam Clay N K P Salty clay 7.45 4.22 22 39 43 0.69 1.41 0.29
Result and discussion
Total Tillers No. (m2)
A.I.I concentrations had a significant effect on total tillers number in wheat and oat (Fig. 1 and 2). total tillers number in wheat and oat were the highest at 0 Mg A.I.I. L-1. where the averages 782.78 and 795.89 tillers/ m2 . Total tillers number gradual and linearly declined with an increase in concentration of A.I.I in wheat and oat. Total tillers number losses due to that the hormone A.I.I inhibits axillary bud growth and stem elongation. At the maximum limit of data set (120 Mg A.I.I. L-1) 23.20 % for wheat and 24.87 % for oat decline in tillering has been observed as compared to control treatment (0 Mg. L-1). The result was agreed with (Tomlinson and O Connor, 2004 ; Beveridge, 2006).
Influence of A.I.I and GA3
wheat and oat respectively, while minimum number of tillers was recorded at 80 and 120 Mg GA3. L-1. The decline in total tillers was because of role of gibberellins to inhibition promotes tiller initiation. Our findings are in a great analogy with the finding of ( Jewiss 1972 ; Rajala and Peltonen-Sainio, 2001).
The decline in the total tillers number per square meter with an increased concentration of A.I.I and GA3, due to the increasing role of auxins and gibberellins in the apical meristem and reduce root growth (Johnston and Jeffcoat, 1977), due to the onset of rapid stem elongation and leaf expansion (Jewiss, 1972), which leads to the total tillers number per square meter and that the disparity between the wheat and oats in the number tiller is due to the nature of each crop in growth and tillering.
Fig. 1. Regression of total tillers/ m2
with concentration of A.I.I
Fig. 2. Regression of total tillers/ m2
with concentration of A.I.I
Fig. 3. Regression of total tillers/ m2
with concentration of GA3
Fig. 4. Regression of total tillers/ m2
Influence of A.I.I and GA3
Surviving Tillers (m2)
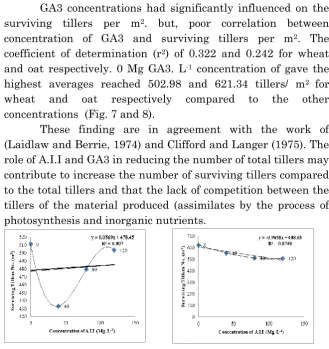
Fig. (5) and (6) shows that concentrations of A.I.I was also significant effect on surviving tillers umber in wheat and oat. The maximum mean of surviving tillers (511.34 tillers/ m2) in wheat with (0 Mg. L-1). But, at 40 Mg A.I.I. L-1 a drastic decline then increase with increasing of A.I.I concentrations to 80 and 120 Mg. L-1. In oat Total tillers number was the highest at 0 Mg. L-1 where the averages (623.56 tillers/ m2) compared to the concentration 120 Mg A.I.I. L-1 which arrived 509.11 tillers/ m2 . In general increasing concentrations of A.I.I decrease of surviving tillers number linearly in wheat but it was not linearly in oat .
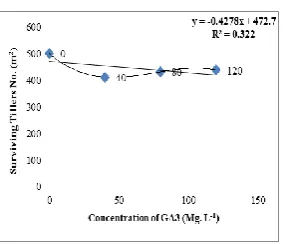
GA3 concentrations had significantly influenced on the surviving tillers per m2. but, poor correlation between concentration of GA3 and surviving tillers per m2. The coefficient of determination (r2) of 0.322 and 0.242 for wheat and oat respectively. 0 Mg GA3. L-1 concentration of gave the highest averages reached 502.98 and 621.34 tillers/ m2 for wheat and oat respectively compared to the other concentrations (Fig. 7 and 8).
These finding are in agreement with the work of (Laidlaw and Berrie, 1974) and Clifford and Langer (1975). The role of A.I.I and GA3 in reducing the number of total tillers may contribute to increase the number of surviving tillers compared to the total tillers and that the lack of competition between the tillers of the material produced (assimilates by the process of photosynthesis and inorganic nutrients.
Influence of A.I.I and GA3
Fig. 5. Regression of surviving tillers/
m2 with concentration of A.I.I
Fig. 6. Regression of surviving tillers/
m2 with concentration of A.I.I
Fig. 7. Regression of surviving tillers/
m2 with concentration of GA3
Fig. 8. Regression of surviving tillers/
m2 with concentration of GA3
Productive Tillers (m2)
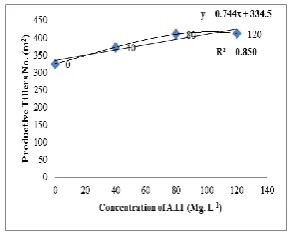
Fig (9) and (10) shows that concentrations of A.I.I had a strong impact on productive tillers (m2). The equation derived depicted that 120 Mg A.I.I. L-1 increase 32.85 and 29.54 % productive tillers (m2) compared to control treatment (0 Mg A.I.I. L-1 ) in wheat and oat respectively. The increasing in productive tillers (m2) will finally be reflected in grain yield of wheat and oat crops.
Concentrations of GA3 had almost no effect on productive tillers (m2) . There was a general spread in the data and no pattern of relationship of concentrations of GA3 and productive tillers (m2) could be detected (Fig 11 and 12). The data exhibit a very poor relationship of concentrations of GA3 and productive tillers (m2) in oat (R² = 0.100) but, strong relationship in wheat (R² = 0.779).
Influence of A.I.I and GA3
and between plants per unit area on assimilates that consider the major factor which limits tiller bud growth (Wheeler, 1972) and (Johnston and Jeffcoat, 1977).
Fig. 11. Regression of productive
tillers/ m2 with concentration of GA3
Fig. 12. Regression of productive
tillers/ m2 with concentration of GA3
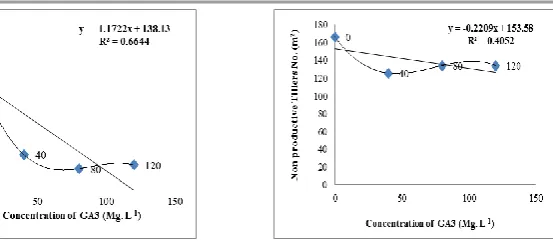
Non productive Tillers (m2)
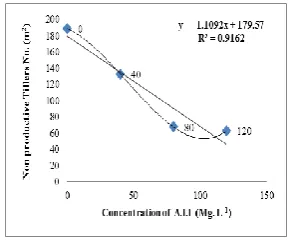
Fig. (13) and (14) that maximum non productive tillers (m2) were recorded 0 Mg A.I.I. L-1 for tow crops (wheat and oat). Number of non productive tillers (m2) started decreasing when concentrations of A.I.I went up. About 120 Mg A.I.I. L-1 dwindled the number of non productive tillers (m2) by 20.03 and 20.09 % compared to control treatment (0 Mg A.I.I. L-1) for wheat and oat respectively.
Fig. 9. Regression of productive
tillers/ m2 with concentration of A.I.I
Fig. 10. Regression of productive
Influence of A.I.I and GA3
Non productive tillers (m2) also shows a linear relationship with concentrations of GA3. Maximum non productive tillers (m2) were recorded 0 Mg GA3. L-1 178.64 and 166.56 for wheat and oat crops respectively. Minimum means were observed with 80 Mg GA3. L-1 (23.52 tillers/ m2) to wheat crop and 40 Mg GA3. L -1 (134.34 tillers/ m2) to oat crop (Fig. 15 and 16).
This result agreed with Peng et al. (1994), who noted that the excessive tillering leads to high tiller abortion. IAA treatment significantly increased the IAA levels in tiller nodes. These effects may be the basis of the IAA-induced inhibition of rice tiller bud growth (Yang et al., 2011). These results indicated that, similar to other plants (Li et al., 1995; Bangerth et al., 2000), Auxin acts in the stem to inhibit tiller bud growth. The reason is probably due decrease in the number of non productive tillers with the increasing concentration of A.I.I and GA3 in the role to increase the number of productive tillers As a result of the lack of competition between the case of these tillers on the one hand and reduce the total number of tillers on the other hand.
Fig.13. Regression of Non productive
tillers/ m2 with concentration of A.I.I
Fig. 14. Regression of Non productive
Influence of A.I.I and GA3
Fig.15. Regression of Non productive
tillers/ m2 with concentration of GA3
Fig. 16. Regression of Non productive
tillers/ m2 with concentration of
GA3
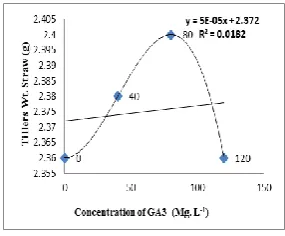
Tiller Straw weight (g)
Fig. (17) and (18) shows that maximum tiller straw weight were recorded at 40 Mg A.I.I. L-1 for wheat (2.40 g) and at 120 Mg A.I.I. L-1 for oat (2.91 g), while minimum at tiller straw weight was recorded at 0 Mg A.I.I. L-1 which arrived 2.08 and 2.39 g for wheat and oat respectively. The relationship between concentrations of A.I.I and tiller straw weight was very strong in oat (R2 = 0.931) and poor in wheat (R2 = 0.333).
Fig. (19) and (20) shows that maximum tiller straw weight were recorded at 120 Mg A.I.I. L-1 which arrived 1.19 and 1.43 g for wheat and oat respectively, while minimum at tiller straw weight was recorded at 0 Mg A.I.I. L-1 which arrived 1.01 and 1.12 g for wheat and oat respectively. The relationship between concentrations of GA3 and tiller straw weight could be detected. The coefficient of determination (R2) of 0.018 and 0.509 for wheat and oat respectively.
Influence of A.I.I and GA3
GA3, which means a lack of competition among them and thus grow better which increased from weighing.
Fig. 17. Regression of tiller straw weight (g) with concentration of A.I.I
Fig. 18. Regression of tiller straw weight (g) with concentration of A.I.I
Fig. 19. Regression of tiller straw weight (g) with concentration of GA3
Fig. 20. Regression of tiller straw weight (g) with concentration of GA3
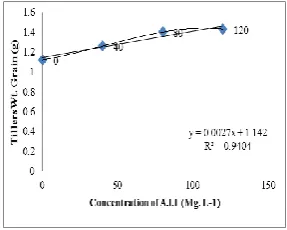
Tillers grain weight (g)
Influence of A.I.I and GA3
concentration of A.I.I from 0 to 120 Mg. L-1 for wheat and oat respectively.
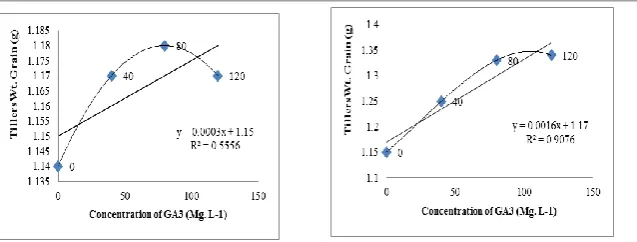
Fig. (23 and 24) shows that maximum tiller grain weight were recorded at 80 Mg GA3. L-1. Tiller grain weight started increasing when concentrations of GA3 went up. About 80 Mg GA3. L-1. increased the tiller grain weight 3.50 and 16.52 % for wheat and oat respectively. The coefficient of determination (R2) 0.555 and 0.907 for wheat and oat respectively.
These results are consistent with results obtained by (Gherroucha, et al. 2011) who noted the increasing of spikes weight in treated plant with (IAA and GA3). Also, the results showed that the use of GA3 sprayed on leaves, leads to increase the weight of 100 weight grain more than using of IAA. The reason is probably due to increase the weight of the grain in the productive tillers with increased concentrations of auxin and gibberellins to the limited number of total tillers and surviving tillers, which means better growth and transform materials resulting from vegetative growth (source) to grain (sink), which increased the weight of the grain in the spike.
Fig. 21. Regression of tiller grain weight (g) with concentration of A.I.I
Influence of A.I.I and GA3
Fig. 23. Regression of tiller grain weight (g) with concentration of GA3
Fig. 24. Regression of tiller grain weight (g) with concentration of GA3
Grains/ spike
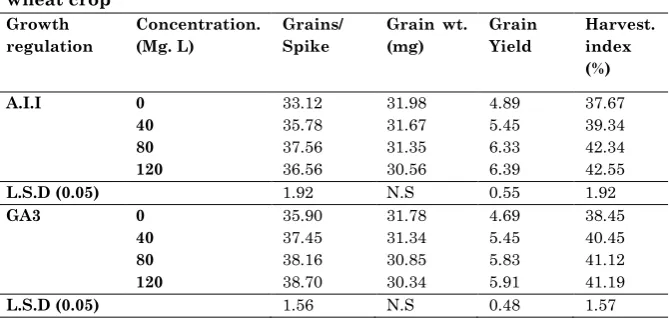
Number of grains\ per spike was increased with increase concentration of A.I.I to wheat and oat. Grain per spike was higher in wheat crop supplied with 80 mg A.I.I. L-1 (37.56 grains/ spike), While maximum grain per spike of oat was recorded at 120 mg A.I.I. L-1 (40.23 grains/ spike). The minimum of grain per spike was recorded at 0 mg A.I.I. L-1, Which arrived to 33.12 and 38.12 grain/ spike for wheat and oat respectively (table 2 and 3).
Results of GA3 had almost similarly to results of A.I.I. Table (2) and (3) shows that grain per spike was significant affected by the different concentrations of GA3. Maximum number of grains per spike was recorded at 120 mg GA3. L-1, Which arrived to 38.70 and 41.56 grains/ spike for wheat and oat respectively. The lower grains/ spike was recorded at 0 mg GA3. L-1. These finding are in a variance with the work of Peng et al. (1994).
Influence of A.I.I and GA3
Grain weight (mg)
Results showed that among treatments, concentrations of A.I.I had not significant effect on grain weight of wheat (table 2). grain weight of oat was significant affected by the different concentrations of A.I.I. maximum weight of grain recorded at 0 mg A.I.I. L-1 (32.98 mg). The data shows that weight of grain decreased 17.10 % comparing to 120 mg A.I.I. L-1 (table 3).
Results showed that among treatments, concentrations of GA3 had not significant effect on grain weight of wheat (table 2 and 3). These results are consistent with the results obtained by Gherroucha, et al. (2011), who noted the increasing of weight 100 grains in treated plant with (IAA and GA3), but the results showed that the plant treated with GA3 was surpassed in weight 100 grain than to treated with IAA.
The reason for the low grain weight with increasing concentrations of A.I.I and GA3 to increase the number of productive tillers (Fig. 9, 10, 11 and 12) and number of grains per spike (table 2 and 3) where the relationship between yield components of the increase, where one or more of these components negatively affects the other component and vice versa.
Grain Yield (ton. ha-1)
Results showed that grain yield was influenced significantly by A.I.I concentrations. These results indicate that, the highest grain yield (6.39 and 5.93 ton. ha-1) and the least grain yield (4.89 and 4.52 ton. ha-1) were obtained in 120 and 0 mg A.I.I. L-1 for wheat and oat respectively (table 2 and 3). Results showed that GA3 concentrations had significant effect on grain yield.
Influence of A.I.I and GA3
result agreed with results of Gherroucha, et al. (2011) and Peng et al. (1994).
Harvest Index(%)
Harvest index significantly affected the A.I.I concentrations. harvest index started increasing with increasing of concentration of A.I.I until 120 mg. L-1. Results shows that maximum harvest index (42.55 and 39.11 %) were recorded at 120 mg A.I.I .L-1, while minimum means of harvest index (37.67 and 33.34 %) were observed at 0 mg. L-1 for wheat and oat crops respectively.
Harvest index was also significantly affected by the different concentrations of GA3. Maximum means of harvest index ( 41.19 and 39.11 %) were recorded at 120 mg GA3. L-1 and minimum (38.45 and 32.12 %) at 0 mg GA3. L-1 for wheat and oat crops respectively (table 2 and 3). The reason for increased harvest index is to increase grain yield which is associated with the proportional relationship.
Table (2) Effect of growth regulation on yield and its components of wheat crop
Growth regulation
Concentration. (Mg. L)
Grains/ Spike
Grain wt. (mg)
Grain Yield
Harvest. index (%)
A.I.I 0 33.12 31.98 4.89 37.67
40 35.78 31.67 5.45 39.34
80 37.56 31.35 6.33 42.34
120 36.56 30.56 6.39 42.55
L.S.D (0.05) 1.92 N.S 0.55 1.92
GA3 0 35.90 31.78 4.69 38.45
40 37.45 31.34 5.45 40.45
80 38.16 30.85 5.83 41.12
120 38.70 30.34 5.91 41.19
L.S.D (0.05) 1.56 N.S 0.48 1.57
Influence of A.I.I and GA3
Table (3) Effect of growth regulation on yield and its components of oat crop
Growth regulation
Con. (Mg. L)
Grains/ Spike
Grain wt. (mg)
Grain Yield (ton. ha)
Harvest. index (%)
A.I.I 0 40.23 27.34 4.52 33.34
40 39.83 29.45 5.45 35.34
80 39.89 32.64 5.84 38.26
120 38.12 32.98 5.93 39.11
L.S.D (0.05) N.S 1.67 0.63 2.03
GA3 0 37.56 30.05 4.92 32.12
40 40.54 30.01 4.93 36.45
80 41.23 28.70 5.88 38.45
120 41.56 28.45 5.92 39.01
L.S.D (0.05) 2.12 N.S 0.65 2.18
Conclusion
From the results of experiments conclude the following:
1- in addition growth regulators of A.I.I and GA3 has led to an increase in most studied characteristics, especially of yield and its components.
2- The improvement of growth of tillers (productive tillers) and some yield components with increased concentration A.I.I and GA3 to 120 mg. L-1 has led to an increase in grain yield.
Recommendation
1- Foliar application of A.I.I and GA3 at concentration120 mg. L-1 on plants of wheat.
Influence of A.I.I and GA3
REFERENCES
Bangerth F ; Li C. J. and Gruber J. 2000. Mutual interaction of auxin and CKs in regulating correlative dominance. Plant Growth Regul. 32: 205-217
Beveridge, C. A. 2006. Axillary bud outgrowth: sending a message. current opiion in Plant Biology 9, 35-40.
Clifford, P. E. and Langer, H. M. 1975. Pattern and control of distribution of C-assimilates in reproductive plants of
Lolium multiflorum L. am.var.Westerwoldicum
.Ann.Bot., 39, 403.
Gherroucha, H., fercha, A and Ben mekhlouf, Z. 2011. Foliar application of Indol Acitic Acid (IAA) and Gebirilic acid (GA3) as well as interaction effect on growth yield and some physiological compositions of Triticum plant grown under salinity conditions. Agric. Biol. J. N. Am., 2011, 2(3): 512-521
Jewiss, O. R. 1972. Tillering in grasses –Its significance and control. Journal of the British. Grassland Society 27, 65-82.
Johnston, G. F. and Jeffcoat, B. 1977. Effect of some growth regulators on tiller bud elongation in cereals. New Phytol. 79: 239 - 245.
Kariali, E. and Mohapatra P. K. 2007. Hormonal regulation of tiller dynamics in differentially – tillering rice cultivars. Plant Growth Regul 53: 215-223.
Laidlaw, A. S. and Berrie, A. M. M. 1974. The influence of expanding leaves and the reproductive stem apex on apical dominance in Lolium multiforum L. Ann. appl. Biol, 78, 75
Influence of A.I.I and GA3
Li, C. J. ; Guevera, E. ; Herrera, J. and Bangerth, F. 1995 Effect of apex excision and replacement by 1- naphthyl aceticacid on cytokinin concentration and apical domince in pea plants. Physiol. Plant 94: 465-469
Li, X. Y. ; Qian, Q. ; Fuzm, W. Y. H. ; Xiong, G. S. Zheng, D. L. ; Wang, X. Q. ; Liu, X. F. ; Teng, S. ; Hiroshi, F. Yuan, M. ; Luo, D. ; Han, B. and Li, J. Y. 2003. Control of tillering in rice. Nature 422: 618-621.
Me Steen, P. 2009. Hormonal regulation of branching in grasses .Plant Physiology 149, 46-55.
Matthew, C. ; Assuero, S. G. ; Black, C. K. and Sackville H. N. R. 2000. Tiller dynamics of grazed
Peng. S. ; Khush G. S. and Cassman K. G. 1994. Evolution of the new plant ideotype for increased yield potential.In: Cassman KG (ed) Breaking the yield barrier. Proceedings of a workshop on rice yield potential in favourable environments .Internation Rice Research Institute , Philippines,pp 5-20
Rajala, A. Peltonen–Sainio, P. 2001. plant growth regulator effects on spring cereal root and shoot growth. Agronomy Journal 93, 936-943.
Silvia, G. A. and Jorge, A. T. 2010. Tillering regulation by endogenous and environmental factors and its agricultural management. The Americas J. of Plant Sci. and Biol. 4 (special issue 1): 35 - 48.
Thiry, D. E. ; R. G. Sears, J. P. Shroyer, and G.M. Paulsen. 2002. Planting date effects on tiller development and productivity of wheat. Kansas State University Agricultural Experiment Station and Cooperative Extension Service Manhattan, Kansas 66506.
Tomlinson, K. W and OConnor, T. G. 2004. control of tiller recruitment in bunchgrasses: Uniting physiology and ecology. Functional Ecology 18, 489-496.
Influence of A.I.I and GA3
Woodward, E. J. and Marshall, C. 1989. Effect of plant growth regulators on tiller bud outgrowth in uniculm cereals. Ann. appl. Biol. 114: 597 - 608.