Scholarship@Western
Scholarship@Western
Electronic Thesis and Dissertation Repository
10-28-2016 12:00 AM
Behavior of Fire-Exposed RC Frames Before and After Jacketing
Behavior of Fire-Exposed RC Frames Before and After Jacketing
M. Monir M. Ajan Alhadid
The University of Western Ontario
Supervisor Maged Youssef
The University of Western Ontario
Graduate Program in Civil and Environmental Engineering
A thesis submitted in partial fulfillment of the requirements for the degree in Doctor of Philosophy
© M. Monir M. Ajan Alhadid 2016
Follow this and additional works at: https://ir.lib.uwo.ca/etd
Part of the Civil Engineering Commons, and the Structural Engineering Commons
Recommended Citation Recommended Citation
Ajan Alhadid, M. Monir M., "Behavior of Fire-Exposed RC Frames Before and After Jacketing" (2016). Electronic Thesis and Dissertation Repository. 4300.
https://ir.lib.uwo.ca/etd/4300
This Dissertation/Thesis is brought to you for free and open access by Scholarship@Western. It has been accepted for inclusion in Electronic Thesis and Dissertation Repository by an authorized administrator of
i
Analysis and design of fire-exposed Reinforced Concrete (RC) frames before and after jacketing with concrete layers are commonly performed using prescriptive methods that rely on the concept of fire rating. These methods were developed based on empirical results on individual RC members subjected to certain fire conditions. In typical fire scenarios, the residual capacity, stiffness and thermal deformations affects not only the local performance of each fire-exposed member, but also the load redistribution and global behavior of the entire frame. In terms of fire safety, the philosophy of the new building codes considers objective-based design as an alternative of the current prescriptive methods. Unfortunately, performing full scale experiments and comprehensive numerical analysis on RC frames are expensive and time consuming. Therefore, this thesis aims at developing a simple yet robust analysis procedure for estimating the post-fire behavior of RC frames before and after repair using concrete jackets.
The study encompasses three main phases. Firstly, the influence of interfacial slip in jacketed RC members on the capacity, stiffness and deformation behavior is assessed. An analytical model is developed to analyze the jacketed sections using the sectional analysis method and considering nonlinear material behavior. The validated model is utilized to conduct a parametric investigation aiming at examining the effect of geometrical and mechanical properties on the performance of the jacketed members and to propose modification factors to account for interfacial slip.
In the next phase, the behavior of individual fire-exposed RC members is investigated. The influence of temperature-load history, support type, initial load conditions, material properties and geometrical characteristics on the complete deformation behavior is examined in view of a proposed comprehensive sectional analysis model. The significance of each parameter is captured by performing detailed statistical analysis on the results to determine the different residual characteristics of each member.
ii
in view of two fire scenarios. The results show the significance of considering the mutual interaction between members to determine load redistribution and residual deformations.
Keywords
iii
To My Wonderful Parents Makin and Sana
To My Beloved Wife Hala and Beautiful Daughter Ayla
and
iv
Co-Authorship Statement
v
Acknowledgments
First and foremost, praises and thanks to Allah, the Almighty, for his showers of blessings which he granted me in every step throughout my Doctoral research.
I would like to express my sincere gratitude to my advisor Prof. Maged Youssef for his contribution to a rewarding academic experience by reinforcing my attendance at various conferences, engaging me in new ideas and demanding a high quality of work in all my endeavors. His continuous support during my PhD study and related research has constantly forced me to remain focused on achieving my aspiration. His observations and comments helped me to establish the overall direction of the research and to move forward with investigation in depth. His mentorship was paramount in providing me with a great experience consistent with my long-term career goals.
Special thank also goes to my former supervisor Prof. Amr Sweedan for all the assistance and guidance he provided me with towards pursuing my Doctoral degree at Western University.
My gratitude extends to Mr. Maged Eissa for all the assistance he has provided me with to acquire Mitacs fellowship at INCON company. He has been very helpful, supportive and willing to share his invaluable experience with me from the first day I started my new job.
I would like to thank Ahmad Musa, Ahmad Al-Ansary, Mohammed Diab and all my friends whose encouraging words kept me going when coffee had lost its stimulating effect. My thanks also go to my research group Salah El-Fitiany, Aiham Adawi, Papia Sultana and Emad Ebreik for the constructive discussions we had throughout my study period.
I would like to gratefully thank my amazing family for the love, unending support, and constant encouragement I have gotten over the years. My thank also extends to wife’s family, who provided me with continuous inspiration and motivation to pursue my degree.
vi
Table of Contents
Abstract ... i
Co-Authorship Statement... iv
Acknowledgments... v
List of Tables ... xviii
List of Figures ... xx
List of Abbreviations, Symbols and Notations ... xxvi
Chapter 1 ... 1
1 INTRODUCTION ... 1
1.1 Research Objectives ... 2
1.2 Methodology ... 3
1.3 Outline of Thesis ... 4
1.3.1 Chapter 2 ... 4
1.3.2 Chapter 3 ... 4
1.3.3 Chapter 4 ... 5
1.3.4 Chapter 5 ... 5
1.3.5 Chapter 6 ... 6
1.3.6 Chapter 7 ... 6
1.3.7 Chapter 8 ... 7
vii
Chapter 2 ... 9
2 BACKGROUND AND LITERATURE REVIEW ... 9
2.1 Current Fire Design Practice in Canada... 9
2.2 Standard Fire ... 10
2.3 Thermal Analysis ... 13
2.4 Responses of Concrete to High Temperatures ... 18
2.5 Materials Residual Behavior ... 20
2.5.1 Concrete Residual Compressive Strength ( ′) ... 21
2.5.2 Concrete Residual Tensile Strength ( ) ... 22
2.5.3 Concrete Residual Initial Modulus of Elasticity ( ) ... 23
2.5.4 Concrete Residual Strain at Peak Stress ( ) ... 23
2.5.5 Concrete Residual Ultimate Strain ( ) ... 24
2.5.6 Steel Residual Yield Strength ( ) ... 25
2.5.7 Steel Residual Modulus of Elasticity ( ) ... 27
2.6 Literature Review on Residual Strength and Cooling Effects ... 28
2.7 Concrete Jacketing of Reinforced Concrete Members ... 34
2.7.1 Jacketing of Undamaged Reinforced Concrete Members ... 34
2.7.2 Jacketing of Fire-Damaged Reinforced Concrete Members ... 38
2.8 Summary and Conclusions ... 42
viii
Chapter 3 ... 49
3 ANALYSIS OF REINFORCED CONCRETE BEAMS STRENGTHENED USING CONCRETE JACKETS ... 49
3.1 Material Models ... 50
3.2 Typical Strain and Stress Distributions in Jacketed RC Beams ... 50
3.3 Interfacial Shear Stress (τ) and Slip (S) Relationship ... 52
3.4 Interfacial Shear Stress (τ) and Slip Strain (Δε) Relationships ... 54
3.5 Proposed Calculation Algorithm... 55
3.5.1 Iterations at Mid-Span Section ... 57
3.5.2 Obtaining Moment-Curvature Relationship at Other Beam Segments... 61
3.6 Validation ... 62
3.6.1 Chalioris and Pourzitidis [1] ... 62
3.6.2 Chalioris et al. [2] ... 63
3.6.3 Martinola et al. [3] ... 63
3.6.4 Hussein et al. [4] ... 65
3.6.5 Shehata et al. [5] ... 66
3.7 Parametric Study ... 67
3.8 Flexural Behavior of the Jacketed Beams ... 67
3.8.1 Effect of Beam Width (bc) ... 67
3.8.2 Effect of Jacket Thickness (hJ) ... 70
ix
3.8.4 Effect of Beam Span (L) ... 71
3.8.5 Effect of Concrete Compressive Strength ( ′) ... 72
3.8.6 Effect of Steel Yield Strength ( ) ... 72
3.9 Interfacial Slip Behavior ... 73
3.9.1 Slip Strain (Δε) Distribution ... 73
3.9.2 Slip (S) Distribution ... 74
3.9.3 Interfacial Shear Stress (τ) Distribution ... 75
3.9.4 Plastic Hinge Region... 77
3.10 Proposed Expressions for the Monolithic Factors ... 78
3.11 Conclusions ... 81
3.12 Appendix ... 83
3.13 References ... 85
Chapter 4 ... 88
4 ANALYSIS OF CONTINUOUS REINFORCED CONCRETE BEAMS STRENGTHENED USING CONCRETE JACKETS ... 88
4.1 Objectives and Scope of Work ... 89
4.2 Concrete Material Model ... 90
4.3 Steel Material Model... 90
4.4 Interfacial Shear Stress (τ) and Slip (S) Relationship ... 91
4.5 Assumptions ... 92
x
4.7 Proposed Calculation Algorithm... 95
4.7.1 Moment-Curvature at Maximum Moment Sections ... 96
4.7.2 Sectional Analysis in Jacketed Sections ... 98
4.7.3 Moment Redistribution in Continuous Beams ... 98
4.7.4 Load-Deflection Relationship and Equivalent Curvature Distribution .. 101
4.8 Validation ... 102
4.9 Parametric Study ... 104
4.10 Moment-Curvature Behavior ... 104
4.10.1 Effect of Jacket Thickness (hJ) ... 108
4.10.2 Effect of Beam Width (bc) ... 110
4.10.3 Effect of Existing Beam Depth (hc) ... 111
4.10.4 Effect of Beam Span (L) ... 111
4.10.5 Effect of Concrete Compressive Strength ( ′) ... 112
4.10.6 Effect of Steel Grade ( ) ... 113
4.11 Interfacial Slip Behavior ... 113
4.11.1 Slip Strain (Δε) Distribution ... 113
4.11.2 Slip (S) Distribution ... 115
4.11.3 Interfacial Shear Stress (τ) Distribution ... 117
4.12 Proposed Expressions for the Effective Stiffness ... 119
xi
4.14 References ... 125
Chapter 5 ... 129
5 SIMPLIFIED APPROACH TO ASSESS THE CAPACITY OF FIRE-DAMAGED REINFORCED CONCRETE BEAMS ... 129
5.1 Assumptions ... 130
5.2 Heat Transfer Analysis ... 130
5.3 Materials Residual Behavior ... 131
5.4 Strength Analysis ... 133
5.5 Validation ... 134
5.5.1 Kodur et al. [36] ... 134
5.5.2 Haddad et al. [37] ... 135
5.6 Parametric Investigation and Discussion ... 136
5.6.1 Influence of Fire Duration ... 137
5.6.2 Influence of Mechanical Properties ... 140
5.6.3 Influence of Geometrical Properties ... 141
5.7 Maximum temperature distribution along the cross-section ... 142
5.8 Stress distribution within the compression zone ... 143
5.9 Proposed Simplified Method ... 144
5.9.1 Evaluation of the Maximum Temperature (Tmax) Distribution in Concrete ... 145
xii
5.9.3 Evaluation of the residual stress-block parameters (α1R and β1R) ... 148
5.9.4 Evaluation of the residual concrete compressive strength (fcR') ... 150
5.9.5 Evaluation of the residual maximum strain at extreme compression fiber (εmaxR) ... 151
5.9.6 Evaluation of the residual flexural capacity (Mr) ... 152
5.10 Summary and Conclusions ... 153
5.11 References ... 154
Chapter 6 ... 159
6 RESIDUAL AXIAL BEHAVIOR OF RESTRAINED REINFORCED CONCRETE COLUMNS DAMAGED BY A STANDARD FIRE ... 159
6.1 Proposed Analytical Approach ... 160
6.2 Definition of Cross-Sections ... 164
6.3 Thermal Analysis ... 166
6.3.1 Rectangular Sections ... 166
6.3.2 Circular Sections ... 167
6.4 Material Models and Strain Components ... 172
6.5 Strength Analysis ... 173
6.6 Equivalent Residual Strain ... 173
6.7 Validation of the Proposed Analytical Model ... 176
6.7.1 Chen et al. [25] ... 177
xiii
6.7.3 Yaqub and Bailey [27] ... 179
6.7.4 Elsanadedy et al. [28] ... 179
6.8 Parametric Study ... 180
6.8.1 Effect of Fire Duration ... 183
6.8.2 Effect of Section Size... 183
6.8.3 Effect of Mechanical Properties... 184
6.8.4 Effect of Steel Reinforcement Ratio ... 184
6.8.5 Effect of Restraint Conditions ... 184
6.9 Proposed Simplified Expressions to Obtain Residual Axial Capacity and Stiffness ... 185
6.9.1 Rectangular Sections ... 186
6.9.2 Circular Sections ... 190
6.10 Application of the Proposed Procedure ... 192
6.11 Conclusions ... 195
6.12 References ... 196
Chapter 7 ... 200
7 RESIDUAL BEHAVIOR OF REINFORCED CONCRETE MEMBERS EXPOSED TO FIRE FROM 3 SIDES ... 200
7.1 Analysis Stages and Assumptions ... 201
7.2 Thermal Analysis ... 203
xiv
7.3.1 Axial Restraints and Thermal Expansion ... 205
7.3.2 Rotational Restraints and Thermal Bowing ... 207
7.4 Equivalent Residual Strain of RC Members Heated from 3 Sides ... 208
7.5 Strength Analysis ... 211
7.6 Validation ... 212
7.7 Parametric Study ... 213
7.8 Influence of Study Parameters ... 214
7.8.1 Concrete Compressive Strength ( ′) ... 216
7.8.2 Steel Yield Strength ( ) ... 216
7.8.3 Fire Duration (t) ... 217
7.8.4 Steel Reinforcement Ratio (ρ) ... 220
7.8.5 Width of Cross-Section (b) ... 220
7.8.6 Height of Cross-Section (h) ... 221
7.8.7 Restraints against Thermal Expansion ... 221
7.9 Regression Analysis and Proposed Expressions ... 223
7.9.1 Residual Flexural Stiffness of Fire-Exposed Beams-Column Elements 224 7.9.2 Residual Yield Moment of Fire-Exposed Beams ... 226
7.9.3 Residual Thermal Curvature (φi) of Fire-Exposed Beams ... 227
7.9.4 Residual Thermal Strain (εi) of Fire-Exposed Beams ... 229
xv
7.9.6 Residua Axial Capacity and Stiffness of Columns Heated from 3 Sides 230
7.9.7 Residual Thermal Strain in Columns Heated from 3 Sides ... 230
7.9.8 Residual Thermal Curvature in Columns Heated from 3 Sides ... 233
7.10 Proposed Procedure to Analyze Fire-Damaged RC Members ... 234
7.11 Conclusions ... 235
7.12 References ... 237
Chapter 8 ... 240
8 STRUCTURAL PERFORMANCE OF JACKETED FIRE-EXPOSED REINFORCED CONCRETE MEMBERS IN FRAME STRUCTURES CONSIDERING SLIP INFLUENCE ... 240
8.1 Applicability of the Proposed Method ... 242
8.1.1 Analysis Main Assumptions ... 242
8.1.2 Mechanical Characteristics Before, During and After Fire ... 242
8.1.3 Residual Strain Components ... 243
8.1.4 Temperature-Load Interaction ... 244
8.1.5 Description of the Frame System and Fire Scenarios ... 244
8.2 Local Behavior of the Affected Frame Members ... 247
8.2.1 Support Conditions of the Considered Members ... 248
8.2.2 Initial Load Level Acting on the Members ... 251
8.2.3 Residual Stiffness and Capacity of Columns Heated from 4 Sides ... 254
xvi
8.2.5 Maximum Temperature Distribution in Beams ... 256
8.2.6 Residual Flexural Capacity of the Fire-Exposed Beams ... 259
8.2.7 Residual Stiffness of the Fire-Exposed Beams ... 261
8.2.8 Residual Thermal Deformations in Beams ... 262
8.2.9 Residual Thermal Deformations in Columns ... 263
8.2.10 Behavior of Jacketed Beams ... 264
8.3 Global Structural Behavior of the Considered Frame... 266
8.3.1 Fire Scenario 1 ... 266
8.3.2 Fire Scenario 2 ... 269
8.4 Summary and Conclusions ... 273
8.5 References ... 274
Chapter 9 ... 277
9 SUMMARY AND CONCLUSIONS ... 277
9.1 Background and Literature Review ... 277
9.2 Analysis of Reinforced Concrete Beams Strengthened using Concrete Jackets 277 9.3 Simplified Approach to Assess the Capacity of Fire-Damaged Reinforced Concrete Beams ... 278
9.4 Residual Axial Behavior of Restrained Reinforced Concrete Columns Damaged by a Standard Fire ... 278
xvii
9.6 Structural Performance of Jacketed Fire-Exposed Reinforced Concrete Members in Frame Structures Considering Slip Influence ... 279
9.7 Recommendations for Future Work... 280
xviii
List of Tables
Table 2-1: Indicators values in Equations 4 and 5 ... 15
Table 3-1: Geometry of the Discussed Jacketed Beams ... 61
Table 3-2: Description of the examined experimental studies... 62
Table 3-3: Coefficients Used to Calculate αy,J , αy,c and αu in Equations 14 and 15 ... 80
Table 4-1: Geometry of the discussed jacketed beams ... 105
Table 5-1: Coefficients for Equations 6 through 7 ... 147
Table 5-2: Coefficients for Equations 10 and 11 ... 149
Table 5-3: Coefficients for Equations 15 ... 151
Table 5-4: Coefficients for Equations 16 ... 152
Table 6-1: Properties of the discussed rectangular and circular column sections ... 165
Table 6-2: Coefficient of Equation 4 for rectangular sections ... 187
Table 6-3: Coefficient of Equation 5 for rectangular sections ... 188
Table 6-4: Coefficient of Equation 6 for circular sections ... 191
Table 6-5: Coefficient of Equation 7 for circular sections ... 192
Table 7-1: Geometrical and mechanical properties of the discussed sections. ... 214
Table 7-2: Coefficients for Equation 8 ... 225
Table 7-3: Coefficients for Equations 13 and 14 ... 229
Table 7-4: Coefficient for Equation 15 ... 232
xix
Table 7-6: Coefficient of Equation 17 ... 234
Table 8-1: Axial spring stiffness and restraint ratios of the considered columns ... 249
Table 8-2: Axial and flexural spring stiffness and restraint ratios of the considered beams 251 Table 8-3: Initial load level and residual properties of the fire-exposed columns ... 252
Table 8-4: Initial load level and residual properties of the fire-exposed beams ... 254
Table 8-5: Initial load level and residual properties of the fire-exposed columns ... 256
Table 8-6: Temperature and residual yield strength in the beams reinforcement ... 259
Table 8-7: Residual thermal strains and curvatures in the considered beams ... 262
Table 8-8: Residual thermal strains and curvatures in the considered columns ... 263
xx
List of Figures
Figure 2-1: Standard fire curves with cooling at various fire durations. ... 12
Figure 2-2: Residual compressive strength of concrete ... 22
Figure 2-3: Residual compressive strength of concrete ... 24
Figure 2-4: Residual yield strength of steel bars ... 26
Figure 2-5: Residual modulus of elasticity of steel bars ... 27
Figure 3-1: Geometrical properties, strains and stresses of 1-side jacketed beam ... 51
Figure 3-2: Interfacial slip model ... 52
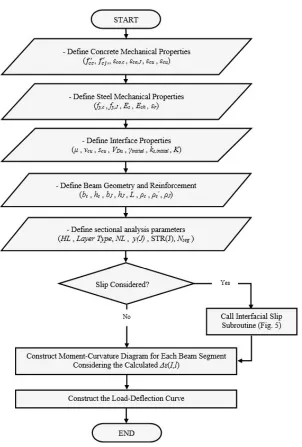
Figure 3-3: Definition of jacketed beam segments ... 56
Figure 3-4: Flowchart showing the calculation algorithm to analyze jacketed beams ... 57
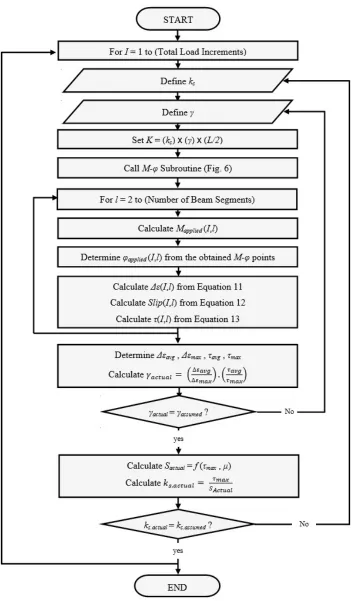
Figure 3-5: Interfacial slip calculation subroutine ... 58
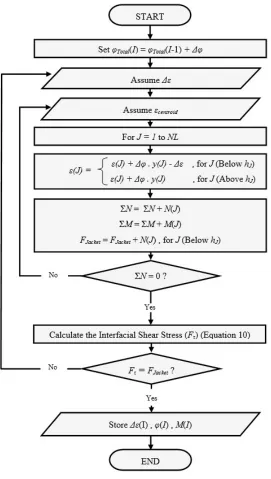
Figure 3-6: Moment-curvature (M-φ) subroutine ... 59
Figure 3-7: Validation of the proposed analytical model ... 64
Figure 3-8: Validation of the analytical model (Hussein et al. [4]) ... 65
Figure 3-9: Validation of the analytical model (Shehata et al. [5]) ... 66
Figure 3-10: Effect of varying bc on the M-φ relationship ... 68
Figure 3-11: Effect of varying bc on the P-Δ relationship jacketed along one side ... 69
Figure 3-12: Slip strain (Δε) distribution along beam B-5 jacketed along one side ... 73
Figure 3-13: Slip distribution (S) along beam B-5 jacketed from one side ... 75
xxi
Figure 3-15: Interfacial shear stress distribution (τ) along beam B-5 from one side ... 77
Figure 3-16: Stiffness reduction model for a typical jacketed beam ... 78
Figure 3-17: Statistical analysis for the proposed expressions for αy,J, αy,c and αu ... 81
Figure 4-1: Continuous beam loading scheme and reinforcement configuration ... 93
Figure 4-2: Propped cantilever analytical model ... 94
Figure 4-3: Moment-curvature diagrams for positive and negative moment sections ... 94
Figure 4-4: Bending moment and deflection profile of the propped cantilever model ... 96
Figure 4-5: Element forces and displacements ... 99
Figure 4-6: Longitudinal and cross-sectional views of the beams tested experimentally by Cheong and MacAlevey [15]. ... 102
Figure 4-7: Validation of the proposed model ... 103
Figure 4-8: Percent difference of initial stiffness by including and neglecting slip effect (sagging) ... 106
Figure 4-9: Percent difference of initial stiffness by including and neglecting slip effect (hogging) ... 106
Figure 4-10: Variation of sagging and hogging initial stiffness with various parameters .... 107
Figure 4-11: Effect of varying hJ on the M-φ relationship (sagging) ... 108
Figure 4-12: Effect of varying hJ on the M-φ relationship (hogging) ... 109
Figure 4-13: Slip strain (Δε) distribution along beam B-5 (μ = 0.4) ... 114
Figure 4-14: Slip strain (Δε) distribution along beam B-5 (μ = 1.0) ... 114
Figure 4-15: Slip distribution along beam B-5 (μ = 0.4) ... 116
xxii
Figure 4-17: Interfacial shear stress distribution along beam B-5 (μ = 0.4) ... 118
Figure 4-18: Interfacial shear stress distribution along beam B-5 (μ = 1.0) ... 118
Figure 4-19: Typical moment-curvature diagram for jacketed beams. ... 121
Figure 4-20: Statistical analysis for the proposed expressions ... 123
Figure 5-1: Development of strain components along the beam cross-section ... 133
Figure 5-2: Validation of the proposed model in view of load-deflection relationship... 136
Figure 5-3: Effect of fire duration on M-φ relationship ... 138
Figure 5-4: Influence of the parameters on the reduction ratios of capacity and stiffness ... 139
Figure 5-5: Temperature distribution and variation of η ... 139
Figure 5-6: Stress distribution of the examined RC beam ... 143
Figure 5-7: Validation of α1R and β1R for the sagging moment case ... 149
Figure 6-1: Influence of temperature-stress interaction on the concrete strains ... 161
Figure 6-2: Temperature-stress interaction ... 162
Figure 6-3: Isolation of Columns in Typical RC Frames ... 163
Figure 6-4: Geometry and Meshing of Rectangular Sections ... 165
Figure 6-5: Geometry and Meshing of Circular Sections ... 168
Figure 6-6: Temperature variation with time at different points along the cross-section ... 169
Figure 6-7: Temperature distribution within the rectangular cross-section of column (R3) at different time increments ... 170
xxiii
Figure 6-9: Development of various strain components along the cross-section ... 174
Figure 6-10: Influence of initial load level on the residual (P-ε) relationship ... 175
Figure 6-11: Residual and equivalent strains distribution along columns R3 and C3 cross-sections ... 176
Figure 6-12: Validation of the proposed analytical model with experimental data ... 177
Figure 6-13: Influence of varying the examined parameters on the axial capacity and stiffness of rectangular columns ... 181
Figure 6-14: Influence of varying the examined parameters on the axial capacity and stiffness of circular columns ... 182
Figure 6-15: Validation of the proposed Equations 4 and 5 for residual capacity ... 189
Figure 6-16: Validation of the proposed Equations 4 and 5 for residual axial stiffness ... 189
Figure 6-17: Validation of the proposed Equation 6 for equivalent residual strain ... 190
Figure 6-18: Description of the proposed analysis procedure ... 193
Figure 7-1: Flow chart summarizing the analysis procedure ... 202
Figure 7-2: A typical RC frame structure illustrating the isolated models ... 205
Figure 7-3: Restrained beam model after exposure to elevated temperatures ... 206
Figure 7-4: Strain distributions across a typical beam heated from 3 sides... 209
Figure 7-5: Validation of the proposed model in view the M-φ diagram obtained by Guo and Shi (2011)... 213
Figure 7-6: Ambient and residual M-φ diagrams for a typical member corresponding to different initial loads. ... 215
xxiv
Figure 7-8: Effect of the parameters on the average residual thermal strain (including transient strain)... 219
Figure 7-9: Variation of total axial load acting on member 1 during ASTM E119 fire exposure and (20%fc') initial axial load level. ... 222
Figure 7-10: Variation of M-φ diagram between ambient and post-fire conditions. ... 224
Figure 7-11: Validation of Equation 8 to predict (EI)R/(EI)g in fire-exposed beams... 225
Figure 7-12: Validation of Equations 9 and 10 to predict (My)R/(My) in beams. ... 227
Figure 7-13: Validation of Equations 11 and 12 to predict φi in fire-exposed beams. ... 228
Figure 8-1: Elevation view of the frame model showing load pattern ... 245
Figure 8-2: Cross-sectional views of the sections in the analyzed RC frame ... 245
Figure 8-3: Cross-sectional views of the jacketed sections in the RC frame... 246
Figure 8-4: Elevation view of the frame model showing load pattern ... 247
Figure 8-5: Isolated models of the different structural members in the frame ... 248
Figure 8-6: Isolated models of the different structural members in the frame ... 250
Figure 8-7: Deformation shape and straining actions in the intact frame ... 253
Figure 8-8: Temperature distribution along the beam cross-section ... 257
Figure 8-9: Strain profile and residual stress-block definition ... 261
Figure 8-10: Deformation shape and straining actions in the fire-exposed frame (scenario 1) ... 267
Figure 8-11: Deformation shape and straining actions in the jacketed frame (scenario 1) .. 269
xxv
xxvi
List of Abbreviations, Symbols and Notations
, area of the compression core reinforcement (mm2)
, area of the tension core reinforcement (mm2)
, area of the tension jacket reinforcement (mm2)
bc width of the existing beam section (m)
CcR residual resultant compressive force (N)
c compression zone depth (mm)
Db diameter of the steel bars (mm)
d distance measured from the bottom surface along the vertical axis (mm)
effective depth of the tension core reinforcement (mm)
effective depth of the compression core reinforcement (mm)
Es elastic modulus of steel (MPa)
Esh strain hardening modulus of steel (MPa)
compressive stress of concrete at a given strain εc (MPa)
compressive strength of concrete at 28 days (MPa)
fcR' residual compressive strength (MPa)
stress developed in steel bars at a given strain εs (MPa)
ultimate strength of steel (MPa)
yield strength of steel (MPa)
xxvii
Fτ interfacial shear force (N)
hc height of the existing beam section (m)
hJ thickness of the attached concrete jacket (m)
HL Layer height used in sectional analysis (mm)
K global interfacial slip coefficient (MPa)
ks secant interfacial stiffness (N/mm3)
kδ axial stiffness of the equivalent spring (N/mm)
L Beam Span (m)
Ls Shear Span (m)
Lp Plastic Hinge Length (m)
M bending moment (N.mm)
Mf moment corresponding to maximum curvature (failure moment) (N.mm)
Mr ultimate moment (flexural capacity) (N.mm)
Nseg Number of beam segments used in the proposed analytical model
NL Number of sectional analysis layers
P applied load (N)
Pi initial applied load (N)
r radius of circular cross-sections (mm)
RD axial restraint ratio
xxviii
Scu slip value at the onset of frictional mechanism failure (mm)
Tcold fire temperature at the end of the cooling phase (oC)
To room temperature (oC)
thot fire duration at the end of the heating phase (hr, min)
Thot fire temperature at the end of the heating phase (oC)
Tmax maximum temperature reached (oC)
vc interfacial shear stress resisted by concrete (MPa)
vcu ultimate frictional capacity at the interface (MPa)
VD resultant dowel force (N)
VDu ultimate dowel force (N)
x distance from support to the section under consideration (mm); or horizontal distance from the edge of the cross-section to the steel bar (mm)
α1 parameter representing the ratio of average stress in rectangular compression stress
block to the concrete compressive strength
β1 parameter representing the ratio of rectangular compression stress-block depth to the
distance between the extreme compression fiber and the neutral axis
y vertical distance measured from the beam soffit to the steel bar (mm)
γ factor representing the product of γ1 and γ2
γ1 ratio between the average and maximum values of interfacial shear stress
γ2 ratio between the average and maximum values of slip strain
Δε slip strain representing the drop in strain at the interface (mm/mm)
xxix
εc mechanical strain of concrete (mm/mm)
εcr creep strain (mm/mm)
εcu concrete crushing strain at ambient conditions (mm/mm)
εcuR residual concrete crushing strain (mm/mm)
εc,bot strain at the bottom fiber of the existing beam section (mm/mm)
εc,top strain at the top fiber of the existing beam section (mm/mm)
εeq equivalent thermal strain (mm/mm)
εJ,bot strain at the bottom fiber of the attached concrete jacket (mm/mm)
εJ,top strain at the top fiber of the attached concrete jacket (mm/mm)
εLITS load induced thermal strain (mm/mm)
εm mechanical strain (mm/mm)
εmax strain corresponding to ultimate moment (mm/mm)
εmaxR strain corresponding to residual ultimate moment (mm/mm)
εo strain at peak stress of concrete (mm/mm)
εoR residual strain at peak stress (mm/mm)
εR residual thermal strain (mm); total residual strain (mm/mm)
εs strain of steel (mm/mm)
εs,bot strain in the bottom core reinforcement (mm/mm)
εs,J strain in the jacket reinforcement (mm/mm)
xxx
εsh strain hardening strain of steel (mm/mm)
εt total strain (mm/mm)
εth free thermal strain (mm/mm)
εthR residual free thermal strain (mm/mm)
εtr transient strain (mm/mm)
εtrR residual transient strain (mm/mm)
εu strain at ultimate strength of steel (mm/mm)
εy strain at yield strength of steel (mm/mm)
εσ stress-related strain (mm/mm)
εσi residual stress-induced strain (mm/mm)
μ coefficient of shear friction at the interface
η ratio between Tmax to Thot
λ axial load level
ρs steel reinforcement ratio
τ interfacial shear stress (MPa)
φ curvature (rad/mm)
Chapter 1
1
INTRODUCTION
The statistics provided by the Council of Canadian Fire Marshals and Fire Commissioners [1] for the year of 2007 revealed that a total of 42,753 fires incidents across Canada resulted in 226 civilian victims and over $1.5 billion loss in property damage. These high figures of casualties and economical loss necessitate an inevitable reassessment of the current design philosophy to consider the fire as a loading case acting on the structure rather than just specifying descriptive information about the fire endurance of each element individually.
To the best of the authors’ knowledge, the first known steps in the realm of developing a full understanding of concrete behavior at elevated temperatures has been commenced by Lea and Stradling [2]. The structural fire protection legislations aim at maintaining the lives of people, controlling the spread of fire and protecting the surrounding environment. Most concrete structures exposed to fire conditions are not fully deteriorated and their structural integrity and mechanical properties can be restored by applying suitable repair methods. According to the European Concrete Platform [3], a statistical study revealed that only 9% of all burned houses made of reinforced concrete should be demolished and the remaining 91% can be put back to use after repair. The detailed assessment of the structural performance after fire events is an essential key to satisfy the current construction practices by choosing suitable repair and strengthening techniques that conform to the current regulations and provide sufficient fire resistance for other possible fire scenarios.
The objective-based approach has been introduced by the International Code Council [5] and the National Fire Protection Association [6] as a different alternative to the current prescriptive standards for fire safety [7]. In 2005, objective-based design philosophy was first introduced in the National Building Code of Canada as a supplement to the still commonly used prescriptive methods [8]. Other countries are also implementing the same approach in shifting towards objective-based design.
1.1 Research Objectives
Current methods of considering fire safety are considered in view of prescriptive methods that were derived for individual RC members subjected to fire. However, changes in capacity and stiffness affects not only the fire-exposed members, but also the global behavior of the entire frame they are composing. This study is a continuation of a research work that has been ongoing since 2004 at Western University under the supervision of Dr. Maged Youssef to examine the behavior of RC members exposed to elevated temperatures. The proposed research work encompasses the following:
1) Determine the influence of interfacial slip on the flexural behavior of structurally determinate and continuous jacketed RC beams.
2) Evaluate the maximum temperature distribution along a concrete cross-section. 3) Evaluate the flexural capacity of fire-exposed RC beams.
4) Evaluate the residual capacity of axially loaded rectangular and circular RC columns. 5) Determine the residual axial capacity of RC members exposed to fire from three or
four sides.
1.2 Methodology
The proposed research work is performed analytically using MATLAB numerical computing environment to examine the behavior of both intact and fire-damaged RC members before and after jacketing with concrete layers. The current study encompasses three main stages as follow:
1) Develop an analytical model to capture the influence of various parameters on the flexural behavior of jacketed reinforced concrete beams. These parameters include interfacial slip, materials’ mechanical properties, beams’ geometrical characteristics, initial applied load level and steel reinforcement ratio. The model is first developed to analyze structurally determinate RC beams subjected to either sagging or hogging moments. The additional concrete layers are applied either from one side or three sides to account for the commonly adopted jacketing practices. The proposed analytical model is then extended to account for jacketing of continuous RC beams. The results are validated against relevant experimental data found in literature to ensure the accuracy and applicability of the proposed analytical model.
proposing a calculation procedure to evaluate the residual behavior of both beams and columns in typical RC frames after exposure to fire.
3) Propose a practical approach to analyze fire-exposed RC frames before and after repair with concrete jackets. A case study that accounts for two commonly encountered fire scenarios in frame structures is presented. A procedure to evaluate the residual capacity, stiffness and thermal deformations of the individual members is described. The influence of applying concrete jackets on the stiffness and capacity of repaired sections is then discussed. Finally, the global behavior of the entire fire-exposed frame before and after fire is investigated in terms of the deformed shape and the developed straining actions.
1.3 Outline of Thesis
This thesis is prepared in an “Integrated-Article Format” following the guidelines described in Western University – School of Graduate and Postdoctoral Studies (SGPS), General Thesis Regulations.
1.3.1
Chapter 2
A literature review is presented in this chapter to present background pieces of information and part of the ongoing research related to the proposed research work. The topics discussed in Chapter 2 include the current design practice commonly used in Canada, the concept of standard fire, the procedure of thermal analysis in concrete sections and the residual properties of concrete and steel bars after exposure to fire. In addition, discussions concerning the residual behavior of RC members and the structural performance of jacketed intact and fire-damaged RC members are presented.
1.3.2
Chapter 3
predict the actual behavior of jacketed RC beams. This chapter provides a simplified method to analyze jacketed RC beams taking into account the interfacial slip distribution and the actual nonlinear behavior of both concrete and steel. An iterative calculation algorithm is developed to determine the moment-curvature and load-deflection curves of the jacketed beams. The developed method provides an evaluation of the slip and shear stress distributions, which allow assessing the influence of surface roughness conditions. The developed method is utilized to conduct an extensive parametric study, which resulted into modification factors to calculate the capacity and deformations of strengthened beams while accounting for interfacial slip.
1.3.3
Chapter 4
Analysis of continuous jacketed Reinforced Concrete (RC) beams requires accounting for the nonlinear behavior of the interface and the materials as well as redistribution of moments. This kind of analysis is complex and could only be conducted by academic researchers. Engineers need simplified yet robust tools to predict the actual behavior of jacketed RC beams. In the current practice, slip is neglected in the analysis and monolithic behavior is assumed for the jacketed section, which result in higher estimates of stiffness and/or capacity. This chapter provides a simplified method to analyze continuous jacketed RC beams taking into account the interfacial slip distribution and the actual nonlinear behavior of both concrete and steel. An iterative calculation algorithm is developed to determine the moment-curvature curves of a jacketed beam at different sections. The developed method allows the evaluation of interfacial slip and shear stress distributions. The developed method is utilized to conduct an extensive parametric study, which resulted into modification factors that can be used to calculate the capacity and deformations of a strengthened beam considering the interfacial slip.
1.3.4
Chapter 5
finite difference heat transfer method and sectional analysis. The influence of the cooling phase, on the temperature distribution and residual mechanical properties, is considered in the analysis. The ability of the proposed model to predict the flexural behavior of fire-exposed beams is validated using experimental studies by others and shown to be in very good agreement. A parametric study is then conducted to determine the influence of geometrical and mechanical properties on the Moment-curvature (M-φ) relationship assuming different fire durations. The study has led to proposing a procedure to determine the critical temperature distribution within the section and to calculate the equivalent stress-block parameters taking into account the residual properties.
1.3.5
Chapter 6
A simplified procedure to predict the residual axial capacity and stiffness of both rectangular and circular Reinforced Concrete (RC) columns after exposure to a standard fire is considered. The development of an analytical procedure during the design phase provides engineers with flexibility to come up with better designs that ensures safety. In this chapter, finite difference heat transfer and sectional analysis models are combined to determine the axial behavior of such columns with various end-restraint conditions at different standard fire durations. The influence of cooling phase on temperature distribution and residual mechanical properties are considered in the analysis. The ability of the model to predict the axial behavior of the damaged columns is validated in view of related experimental studies and shown to be in very good agreement. A parametric study is then conducted to assess the axial performance of fire-damaged RC columns. A procedure is proposed to determine the residual strength and stiffness of fire-damaged RC columns in typical frame structures.
1.3.6
Chapter 7
heat transfer during the cooling phase are explicitly considered. The validated model is implemented to conduct an extensive parametric study that culminated in proposing simplified equations based on regression analysis.
1.3.7
Chapter 8
1.4 References
[1] Wijayasinghe, M. “Fire Losses in Canada,” Association of Canadian Fire Marshals and Fire Commissioners, 2011, Calgary, AB.
[2] Lea, F. “The resistance to fire of concrete and reinforced concrete,” Journal of Chemical Technology and Biotechnology, 1922, Vol. 41, No. 18, pp. 395-396.
[3] European Concrete Platform ASBL. “Comprehensive Fire Protection and Safety with Concrete,” 2007, Brussel, Belgium.
[4] Lataille J.I., “Factors in Performance-Based Design of Facility Fire Protection,” 2008,
http://magazine.sfpe.org/fire-protection-design/factors-performance-based-design-facility-fire-protection,Last, accessed: 27/9/2012.
[5] International Code Council (ICC), “ICC performance code for buildings and facilities,” 2001, Falls Church, VA.
[6] National Fire Protection Association (NFPA). “Building Construction and Safety Code,” 2002, Quincy, MA.
[7] Johann, M.A., Albano, L.D., Fitzgerald, R.W. and Meacham B.J. “Performance-Based Structural Fire Safety,” Journal of Performance of Constructed Facilities, ASCE, 2006, Vol. 20, No. 1, pp. 45-53.
Chapter 2
2
BACKGROUND AND LITERATURE REVIEW
The production of concrete as a superior building material led to a consequent civilian renaissance in construction. Unfortunately, despite the enormous advantages of Reinforced Concrete (RC) structures, they deteriorate and loose part of their strength when exposed to fire. The mechanical properties of concrete and reinforcing steel as well as the interfacial behavior between them pass through several significant changes during the heating and cooling stages as a result of material breakdown and thermal cracks formation. Fortunately, most concrete structures subjected to fire scenarios are not fully damaged and their structural performance can be regained or even increased by applying suitable repair and strengthening methods.
2.1 Current Fire Design Practice in Canada
scenario [1]. When obtaining these ratings, it is important to determine whether it applies to a thermally restrained or unrestrained assembly. Concrete is considered as one of the most highly efficient materials to withstand fire and to provide protection from fire. Thus, the current structural design practices regarding fire recommended by NBC [1] focus on increasing the size of the RC elements and adding more concrete cover to protect the embedded steel bars. Seven various concrete types and the thickness requirements for different structural members are classified Appendix D of the NBC [1] in view of their fire-resistance requirements.
2.2 Standard Fire
point, continuous ventilation into the burning area is mandatory to keep the fire alive. For instance, fire is unlikely to reach severe temperatures if it occurs in a certain enclosure with high fuel load but low ventilation levels. The temperature produced in the growth period is usually neglected in fire analysis as it does not form any significant risk on the structural members. Thus, standard fire curves typically focus on depicting the fully developed period in which temperature reaches extremely high values that could result in severe damage to the structural elements.
The variation of fire severity with time can be simulated numerically depending on many factors such as the type and amount of combustible materials and the presence of oxygen. However, these parameters are hard to predict accurately as they are time dependent and usually vary from one enclosure to another in the building. This implies the unlikelihood of having two real fires sharing the same thermal properties within any enclosure at any given time. Also, the behavior of each structural members is unique when exposed to a single fire based on their location relative to the developed heat flux. This unpredictable nature of fire and its interaction with the structural and non-structural elements assembling the building makes it necessary to rely on statistical data and engineering judgment to predict such severe behavior conservatively. This prediction is performed in view of a standard fire that describes the temperature variation with time for any given enclosure taking into account the little chance it will be exceeded by a real fire scenario during the building lifetime. Tabulated data for temperature increase with time are given in many standards such as the International Organization for Standardization [4] and the American Society for Testing and Materials [5]. Analytical expressions are also proposed to fit these tabulated data such as the ISO 834 [4] and ASTM E119 [5] standard fire curves as shown in Equations 1 and 2, respectively.
− = 345 (480 + 1) (1)
− = 750 1 − . √ + 170.41√ (2)
where T is the fire temperature in (oC), T
o is the initial temperature in (oC) and t is the
In the cooling phase, temperature decreases gradually with different rates depending on the fire type and cooling method. The ASTM E119 [5] standard fire curve lacks a cooling phase after reaching the peak fire temperature. The ISO [4] standards specify cooling rates as functions of the maximum fire duration reached (thot) as given by Equation 3. The
temperature is assumed to decrease gradually approximating the behavior of natural fires.
∆ =
−10.417 , < 30 min −4.167 3 −
60 , 30 ≤ < 120 min −4.167 , ≥ 120 min
(3)
Figs. 2-1(a) and 2-1(b) illustrate the ASTM E119 [5] and ISO 834 [4] standard fire curves obtained from Equations 1 and 2, respectively. The curves terminate at the maximum burning duration specified by the corresponding standard. The cooling phase commences at various pre-defined peak fire temperatures according to Equation 3 as shown in the dashed lines in both figures.
(a) ASTM E119 (b) ISO 834
Figure 2-1: Standard fire curves with cooling at various fire durations.
0 200 400 600 800 1000 1200 1400
0 1 2 3 4 5 6 7
F ir e T em p er at u re ( oC )
Time from Initiation of Fire (hr)
0 200 400 600 800 1000 1200 1400
0 1 2 3 4 5 6 7
F ir e T em p er at u re ( oC )
2.3 Thermal Analysis
Temperature distribution within a reinforced concrete section subjected to elevated temperatures can be predicted experimentally or theoretically. The theoretical method implies the analysis of a structural member analytically or numerically based on the knowledge of fire behavior at different scenarios and the response of those members to external temperature variation depending on their thermal properties. The finite difference method [8, 9] is an analytical process which possesses the capability of predicting the temperature variation within a cross-section taking into account the temperature dependence of thermal material properties. It provides relatively accurate predictions for monolithic structural members exposed to fire from one or more sides. However, this process is not practical to be used in design offices as it is laborious and requires enormous amount of time to build and execute an iterative procedure for the analysis.
The calculation procedure is carried out by dividing the concrete section into many interior right angle rhombus elements and boundary right angle triangle elements. The temperature is represented for each rhombus element by its center and for each triangular element by the hypotenuse mid-point. The steel bars are considered as excellent conductors due to their significantly higher thermal conductivity relative to the surrounding concrete material. Thus, the temperature in each steel bar is considered equal to the temperature of the adjacent concrete elements. The heat analysis is carried out in time steps with the aid of a chosen standard fire relationship. At any given time, the temperature in each element is calculated by solving a corresponding heat equation with the knowledge of the temperature at the previous time increment. Under normal environmental conditions, concrete may hold about 3% moisture by volume. The influence of moisture is considered by assuming that at a temperature of 100oC, heat flow
to the element is used to evaporate the water rather than increasing its temperature.
rising the temperature of the surrounding objects based on their thermal properties [10]. Convection is the transfer of thermal energy by mass motion of gases or liquids. In this process, fire increases the surrounding air temperature causing it to flow upward towards the ceiling resulting in a heat transfer to the adjacent structural members in contact with this hot air [11]. The heat transferred by convection represents not more than 10% of that transferred by radiation [12]. Conduction, on the other hand, is the transfer of internal energy by diffusion and collision of adjacent molecules, atoms and electrons within an element. The heat flows from the hotter to the colder part of the body until thermal equilibrium is achieved.
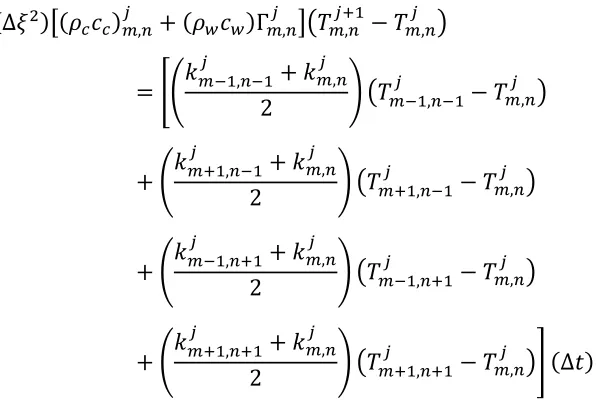
The temperature (T) in each element is derived by ensuring heat balance within the section. For the outer concrete elements, the temperature at time t = ( j+1) Δt is given by Equation 4. In this equation, the left hand term represents the sensible heat absorbed by the element during the specified time increment (Δt). The first term on the right hand side of the equation represents the heat transferred from fire to a boundary element during a time increment of (Δt); whereas the second term represents the heat transmitted by conduction during the same period of time from the neighboring elements to the element under consideration.
Δ
2 ( ) , + ( )Γ , , − ,
= √2 Δ + 273 − , + 273 (∆ )
− , + ,
2 , − ,
+ , + ,
2 , − , (∆ )
(4)
transferred by conduction during the same period of time from the neighboring elements to the element under consideration.
(Δ ) ( ) , + ( )Γ , , − ,
= , + ,
2 , − ,
+ , + ,
2 , − ,
+ , + ,
2 , − ,
+ , + ,
2 , − , (∆ )
(5)
In Equations 4 and 5, Tf is fire temperature (oC); Δt is time increment (s); ρc and ρw are
densities of concrete and water (kg/m3), respectively; c
c and cw are the specific heats of
concrete and water (J/kg-oC), respectively; ω
f and ωc are the emissivity coefficients of
fire and concrete, respectively; Bo is Stefan-Boltzmann constant (W/m2-K4); Γ is the
concentration of moisture as a volume fraction; κ is thermal conductivity of concrete (W/m-oC); Δξ is mesh width (m); M is the total number of mesh points along the
horizontal axis; N is the total number of mesh points along the vertical axis; m is the layer number along the horizontal axis; n is the layer number along the vertical axis; j is the time increment number; and the values of A, B, C1, C2, D1 and D2 are given in Table
2-1 as a function of the surface location.
Table 2-1: Indicators values in Equations 4 and 5
Value Bottom Surface Top Surface Left Surface Right Surface
A m m 1 N
B 1 M n n
C1 m−1 m−1 2 M−1
C2 m+1 m+1 2 M−1
D1 2 N−1 n−1 n−1
The moisture content (Γ) in each element is calculated using equations 4 and 5 by replacing the left hand term with the expressions shown in Equations 6 and 7 for boundary and interior elements, respectively. In these expressions, λw is the heat of
vaporization of water (2.3×10⁶ J/kg).
( ) Γ , − Γ , (6)
( )(Δ ) Γ , − Γ , (7)
The thermal properties of concrete are irreversible and do not restore their initial values [13-15]. Thus, during the cooling phase, thermal properties are assumed to be have a constant value corresponding to the maximum temperature reached in concrete. This assumption is valid for temperatures above 100oC when most moisture is evaporated and
its influence on temperature distribution becomes negligible [13].
Regarding circular sections, the increase in temperature (T) in each layer is derived by applying the heat balance principles between them. For the outer exposed concrete layer of the column, the temperature at time t = (j+1)Δt is given by Equation 8.
= + 2( − 1)∆
( − 1.25) ( ) + ( )Γ Δ
× + 273 − + 273
+ ( − 1.5) + ∆
( − 1.25) ( ) + ( )Γ (Δ ) −
(8)
For the center concrete layer, the change in temperature at the next increment is determined by Equation 9.
= + 2 ∆
For all other internal layers in the concrete column, the temperature variation with time is given by Equation 10.
= + ∆
2( − ) ( ) + ( )Γ (Δ )
× ( − + 0.5) + −
− ( − − 0.5) + −
(10)
Where Δξ is mesh width (m); M is the total number of layers in the column; m is the layer number; and j is the time increment number. The other parameters are defined in a similar manner to Equations 4 and 5.
The initial volume of moisture in the outer concrete layer (V1) and the corresponding
evaporated moisture volume per unit length (ΔV1) occurring during a time interval of Δt
are given in Equations 11 and 12, respectively.
= ( − 1.25)(∆ ) Γ (11)
Δ = 2 Δ ( − 1)(Δ ) + 273 − + 273
− ( − 1.5) +
2 −
(12)
The initial volume of moisture in the center concrete layer (VM) and the corresponding
evaporated moisture volume per unit length (ΔVM) occurring during a time interval of Δt
are given in Equations 13 and 14, respectively.
= 0.25 (∆ ) Γ (13)
Δ = Δ +
For any other concrete layer, the initial volume of moisture (Vm) and the corresponding
evaporated moisture volume per unit length (ΔVm) occurring during a time interval of Δt
are given in Equations 15 and 16, respectively.
= 2 ( − )(∆ ) Γ (15)
Δ = 2 Δ ( − + 0.5) +
2 −
− ( − − 0.5) +
2 −
(16)
where λw is the heat of vaporization of water (J/kg).
2.4 Responses of Concrete to High Temperatures
instance, when concrete is heated up to 120oC, the physically adsorbed water particles
gain sufficient energy to undergo hydrothermal reactions resulting in loss of bound water from the CSH gel due to evaporation. The mitigation of water particles in both the liquid and gaseous phases results in increasing the porosity and breaking down the hardened cement matrix. Increasing the temperature to 300oC initiates the decomposition of the
hydrated calcium silicate and the release of the chemically bonded water particles. The aggregate thermal expansion increases the formation of microcracks as a consequence of the increased internal stresses. Raising the temperature further to 600oC stimulates the
decomposition reaction of Portlandite (CH) and the inversion of α-quartz into β-quartz which is accompanied by an expansion of 0.45%. This new phase results in strength reduction and shrinkage of concrete due to the formation of cracks and voids in the cement matrix [16]. Subjecting the concrete to higher temperatures up to 900oC results in
the destruction of the CSH gel and the dissociation of calcium carbonate (CaCO3). At this
point, concrete loses its structural usefulness due to the severe strength and stiffness losses. When temperature approaches 1200oC, concrete melts and glassy materials form
[13]. The moisture content is the free and absorbed water particles but not the chemically bonded water particles. Its presence in concrete at the time of fire may have a substantial effect on enhancing its fire endurance [1].
The variation in thermal expansion between the aggregate and the cement paste plays another major role in causing damage to concrete subjected to fire. The hardened cement matrix expands when subjected to temperatures up to 200oC and then shrinks. The
aggregates, on the other hand, keep expanding with temperature with different expansion rates depending on the type of aggregates used [17]. This strain difference is compensated by the transient creep phenomenon [13, 16] that occurs in loaded concrete subjected to elevated temperature. Concrete subjected to temperature of up to 300oC is
capable of restoring its strength after a long period of time (between 1 and 2 years) provided that no large temperature gradient caused by rapid heating occur within the section [18].
concrete section after a fire incident. The concrete color after cooling provides a visual indication of the maximum temperature reached during the fire scenario. The color variation is caused by the cement paste gradual dehydration and the internal aggregate transformations [19]. Although the type of aggregate affects the intensity of the concrete color variation, the same changes occur to some extent for all types used in typical constructions. For fire temperatures below 300oC, concrete retains its original color but
its surface may be blackened as a result of the generated gases from the combustion process. On heating above 300oC to just under 600oC, its color turns into pink or red as a
result of changes in the limestone and/or the dehydration or oxidation of the iron compounds presented in the fine or coarse siliceous aggregate. This change in color is a useful indicator in practice to the onset of substantial loss in concrete strength. Increasing the temperature to 900oC turns the cement matrix color into whitish grey and it becomes
buff at about 1000oC [20, 21].
2.5 Materials Residual Behavior
procedure of the stressed test except that the initial load level is zero indicating that no internal stresses are developed in the concrete before loading. This test is convenient for modeling structural elements developing small straining actions at ambient conditions and loaded when subjected to high temperatures. The unstressed residual strength test is performed by subjecting the structural element to one or more heating cycles before bringing its temperature back to the initial ambient conditions. The load is then applied to the cooled specimen until failure takes place. The observations obtained from this test is suitable for determining the residual properties and post fire performance of concrete members.
2.5.1
Concrete Residual Compressive Strength (
)
There are several factors affecting the residual strength of concrete resulting in additional strength loss relative to the minimum strength attained during the heating phase. For instance, post-fire rehydration process results in more deterioration up to one or two months from the time of fire incident as a result of the volume expansion caused by the formation of calcium hydroxide. However, for long durations (a year or more), concrete reaches partial or full strength recovery due to rehydration of the unhydrated cement particles. Moreover, interior temperature in concrete is found to keep increasing after reaching the peak fire temperature due to heat redistribution from the exterior hot surfaces towards both the inner colder concrete core and the surrounding air which results in additional drop in strength. Furthermore, thermal incompatibility between the hardened cement matrix and the embedded aggregates causes more deterioration to concrete during the cooling phase compared to the heating stage. This happens due to the fact that transient creep strain component becomes permanent at the maximum temperature reached and does not alleviate the thermal incompatibility problem as opposed to the first heating phase.
on the strength reduction rate of concrete provided that explosive spalling is not governing.
Figure 2-2: Residual compressive strength of concrete
The model proposed by Cheng et al. [26], Equation 17, is adopted in this study to predict the residual compressive strength of concrete in terms of the maximum temperature reached.
= 1.008 +
450 ln 5800 ≥ 0.0 (17)
2.5.2
Concrete Residual Tensile Strength (
)
Studies concerning the residual tensile strength of concrete are limited in literature. The experimental study performed by Chang et al. [26] revealed that the residual tensile strength of concrete decreases as the temperature increases according to the empirical expressions in Equation 18 as functions of the original tensile strength (ft) and maximum
temperature reached.
0.0 0.1 0.2 0.3 0.4 0.5 0.6 0.7 0.8 0.9 1.0 1.1
0 100 200 300 400 500 600 700 800 900 1000 1100 1200 1300
fcR ' / fc
'
Maximum Temperature Reached (oC)
Chang et al., 2006 Lie et al., 1984 Jau and Lie, 2001
=
(1.05 − 0.0025 ) , 20℃ < ≤ 100℃
(0.80) , 100℃ < ≤ 200℃
(1.02 − 0.0011 ) ≥ 0.0 , 200℃ < ≤ 800℃
(18)
2.5.3
Concrete Residual Initial Modulus of Elasticity (
)
Exposing concrete to elevated temperature reduces its residual compressive strength and increases its strain at peak stress causing the material to soften. The experimental investigation conducted by Chang et al. [26] showed that the residual elastic modulus of concrete decreases in a higher rate than the reduction in compressive strength. The experimental results for normal weight concrete obtained by Felicetti et al. [25] are in good agreement with Equation 19.
=
−0.00165 + 1.033 , 20℃ < ≤ 125℃
1
1.2 + 18(0.0015 ) . , 125℃ < ≤ 500℃
1 − 0.4 − 500200
1.2 + 18(0.0015 ) . , 500℃ < ≤ 700℃
0.6 + 0.4 − 700100
1.2 + 18(0.0015 ) . , 700℃ < ≤ 800℃
(19)
2.5.4
Concrete Residual Strain at Peak Stress (
)
The permanent increase in strain at peak stress is attributed to the cracks developed during the heating-cooling cycle resulting from the thermal incompatibility between the cement matrix and the embedded aggregates. Chang et al. [26] observed the formation of a visible cracks network after heating the concrete specimens to 300oC below which
levels resulting in larger values of strain at peak stress. The original compressive strength of concrete was shown to have a substantial impact on the strain at peak stress when the temperature exceeds 200oC. Both observations were also detected by Felicetti et al. [25]
at temperatures beyond 250oC. The residual strain at peak stress is determined in this
study in view of Change et al. [26] model, Equation 20, as a function of concrete compressive strength and maximum temperature reached.
=
1.0 , 20℃ < ≤ 200℃
−
10 + 7.7
( . . )
1 + ( . . )− 0.0219 + 1.0 , 200℃ < ≤ 800℃
(20)
2.5.5
Concrete Residual Ultimate Strain (
)
The ultimate compressive strain (εcu) of concrete at failure is taken as 0.0035 at ambient
conditions according to CSA A23.3-14 [27]. Unfortunately, few information is available in literature regarding the residual ultimate strain of concrete (εcuR). In this study, the
value of εcuR is proposed as εcu in addition to the difference between the residual strain at
peak stress (εoR) and its counterpart at ambient conditions (εo) as given in Equation 21.
= + ( − ) (21)
By comparing the value of εcuR obtained from the proposed equation with the
experimental data obtained by Felicetti et al. [25], an excellent match is detected especially at temperatures beyond 350oC as shown in Fig. 2-3.
Figure 2-3:Residual compressive strength of concrete
0.000 0.002 0.004 0.006 0.008 0.010 0.012
0 200 400 600 800 1000
εcuR
Maximum Temperature Reached (oC)
2.5.6
Steel Residual Yield Strength (
)
When reinforced concrete structures are subjected to fire scenarios, part of the steel reinforcement may be exposed to extremely high temperatures especially if spalling of the concrete cover takes place. The temperature of these bars may be brought back to the ambient conditions by slow cooling in the air or rapid cooling caused by the water jet used to extinguish the fire. The cooling method of these heated bars dictates the extent of mechanical behavior variation and strength loss with respect to the original intact reinforcement. Also, the cross-sectional properties of the steel bars and the reinforcement distribution may play a significant role in determining the cooling rate of the steel mass [28]. In the case of slow cooling, a greater increase in the rupture strain and a decrease in the tensile strength are witnessed indicating a shift towards a more ductile behavior. On the other hand, using water jet to cool steel specimens at temperatures above 700oC
resulted in a reduction in rupture strain and consequently a shift towards the brittle behavior. The variation in ductility level relative to the original steel bars becomes more pronounced for the small diameter specimens. A metallographic analysis on steel bars with different diameters and subjected to different cooling techniques was performed by Neves et al. [28] to examine the changes that occur to the microstructure of these bars. The examinations revealed that the gradually cooled specimens in the air exhibited an increase in the proeutectoid ferrite grain size relative to the unheated specimens. The rapid cooling performed by water jet resulted in a formation of a Widmanstätten patterns associated to bainite which results from the decomposition of the iron crystal structure after exceeding a critical temperature of 727oC [29].
A complete heating-cooling cycle does not alter the intrinsic shape of steel stress-strain curve including the well-defined yielding plateau and strain hardening behavior. The residual yield strength of mild steel starts to drop when the temperature exceeds 500oC
and becomes much more significant beyond 700oC [25, 28, 29]. In this study, the residual
yield strength (fyR) is proposed in Equation 22 based on Neves et al. [28] and Felicetti et


![Figure 3-8: Validation of the analytical model (Hussein et al. [4])](https://thumb-us.123doks.com/thumbv2/123dok_us/1985992.1262601/96.612.112.528.382.702/figure-validation-analytical-model-hussein-et-al.webp)

