© 2014, IJCSMC All Rights Reserved 35 Available Online at www.ijcsmc.com
International Journal of Computer Science and Mobile Computing
A Monthly Journal of Computer Science and Information Technology
ISSN 2320–088X
IJCSMC, Vol. 3, Issue. 10, October 2014, pg.35 – 40
RESEARCH ARTICLE
Performance Analysis of Cloud
Infrastructure Using Linpack Benchmark
1
Navdeep Kaur,
2Harinderpal Singh,
3Vikas Gupta
1
M.Tech Student, IT, Adesh Institute of Engg., & Technology, Faridkot
2Assistant Professor, CSE, Adesh Institute of Engg., & Technology, Faridkot 3H.O.D, ECE, Adesh Institute of Engg., & Technology, Faridkot 1
[email protected]; 2 [email protected]; 3 [email protected]
Abstract—A scientific computing application and well known synthetic benchmark, the Linpack numerical library has been used to evaluate the performance of cloud infrastructure. Using this application the performance of several key factors in cloud computing such as the influence of the number of virtual machines employed per host, as well as the I/O operations were evaluate . Linpack benchmark was executed under different configuration of the physical host, with different problem sizes and with or without hyper-threading, and with the virtual machines managed using the VMWare hypervisor.
Keywords— Virtual Machine, Hypervisor, KVM, LinPack
I. INTRODUCTION
Cloud computing as discussed in [16] is useful to reduce costs, reduce resources and simplified maintenance .it has ability to run multiple operating system at same time. VMware's software allows users to create multiple virtual environments, or virtual computer systems, on a single computer or server. To evaluate the performance of the Cloud infrastructure, a scientific computing application and well known synthetic benchmark, the Linpack numerical library is used. This paper is organized as follows: Section II discuses the literature survey. Section III explores objective of research Section IV describes the Methodology .Section V list and explores the performance analysis metrics . Section VI describes the performance comparison between three benchmarks: Drhystone, Whetstone and Linpack Benchmarks, Drhystone and Whetstone benchmarks were used in the base paper for calculating performance of cloud infrastructure but in this paper Linpack benchmark has been used. The LINPACK (LINear system PACKage) is a collection of FORTRAN subroutines for solving various systems of linear equations and linear least-squares problems. Section VII presents the conclusion.
II. LITERATURESURVEY
© 2014, IJCSMC All Rights Reserved 36
floating point operations in million for single precision. J.J. Dongarra et.al.[7] Describes the Linpack Benchmark and some of its variations commonly used to assess the performance of computer systems. J.J. Dongarra, P. Luszczek and A. Petitet [15] describes the past, present and future of Linpack benchmark.
III. OBJECTIVEOFTHERESEARCH
Number of projects aimed at developing solutions for managing virtualized enterprise data centers and cloud infrastructures have been proposed earlier by various researchers as discussed in Section II but certain limitations are highlighted as follows:
1. How to run multiple operating systems on the same machine at the same time?
2. How to overcome the problem of data transfer bottlenecks?
IV. METHODOLOGY
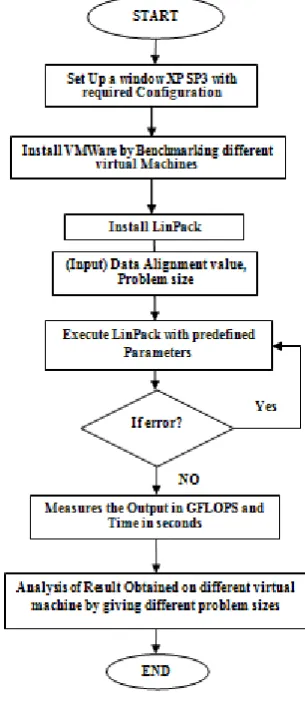
Fig. 1 shows the flow chart of the steps that are followed to calculate the performance of cloud infrastructure using a benchmark. First of all install Window XP with required configurations and then install the VMWare software which manages the virtual machine service. Then install Linpack, a benchmark or simulation tool for performing the desired simulations. To calculate the performance inputs given are: problem size and data alignment value and outputs are: times that it takes to solve the equation and number of GFLOPS.
© 2014, IJCSMC All Rights Reserved 37
V. PERFORMANCE ANALYSIS METRICS
Three performance analysis metrics are: -I/O Performance
-Number of Virtual Machine -HyperThreading Influence
A. I/O performance
This parameter monitors the performance of I/O when Linpack is run concurrently with processes that make an intensive use of the hard disk. This work uses the NFS as file system. A Network File System (NFS) allows remote hosts to mount file systems over a network and interact with those file systems as though they are mounted locally.
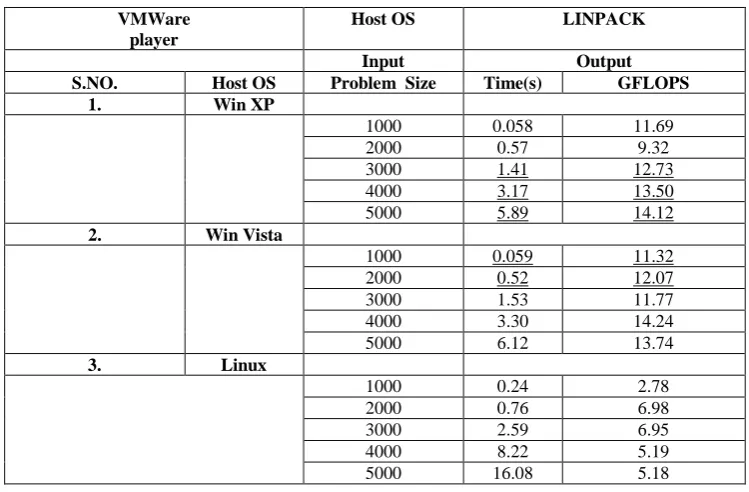
As shown in the table the input is problem size and output is GFLOPS. In the Table I there are different outputs in GFLOPS at different problem sizes while using 3 virtual machines.
Table I I/O PERFORMANCE VMWare
player
Host OS LINPACK
Input Output
S.NO. Host OS Problem Size Time(s) GFLOPS
1. Win XP
1000 0.058 11.69
2000 0.57 9.32
3000 1.41 12.73
4000 3.17 13.50
5000 5.89 14.12
2. Win Vista
1000 0.059 11.32
2000 0.52 12.07
3000 1.53 11.77
4000 3.30 14.24
5000 6.12 13.74
3. Linux
1000 0.24 2.78
2000 0.76 6.98
3000 2.59 6.95
4000 8.22 5.19
5000 16.08 5.18
As shown in Table I. The input to the LINPACK tool was the problem size. The output is time that it takes and the number of GFLOPS.
0 2 4 6 8 10 12 14 16
1000 2000 3000 4000 5000
Win XP
Win vista
Linux
© 2014, IJCSMC All Rights Reserved 38
In the Fig.2 1000, 2000, 3000, 4000, 5000 are problem sizes and 0-15 shows GFLOPS value.
B. Number of Virtual Machine
This parameter evaluates the impact on the performance of the number of virtual machines. Virtual Machine technology enables multiple OS environments to coexist on the same physical computer in strong isolation from each other.
TABLE II
LinPack Performance on Diff. Virtual Machines
On Real OS
Time(s) GFLOPs
3.2 13.09
No. of virtual machines
VM Environment
Time GFlop
1 Win XP 3.2 12.18
2 WinXP
Win vista
5.86 7.31
3 Win xp
Win vista Linux
3.51 13.26
In Table II the performance of real OS on physical hardware and performance of virtual machines is shown. In this table performance is calculated on the basis of increasing no. of virtual machines.
C. Hyper-Threading Influence
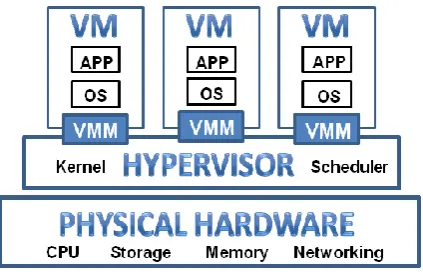
Hyper-Threading is a technology used by some Intel microprocessors that allows a single microprocessor to act like two separate processors to the operating system and the application programs that use it. With Hyper-Threading, a microprocessor's core processor can execute two concurrent threads of instructions sent by the operating system. Having two threads of execution units to work on allows more work to be done by the processor during each clock cycle. To the operating system, the Hyper-Threading microprocessor appears to be two separate processors. Because most of today's operating systems are capable of dividing their work load among multiple processors, the operating system simply acts as though the Hyper-Threading processor is a pool of two processors. As shown in Fig.3 there are 3 virtual machines working on a single physical hardware
Fig.3 Hyper-threading Overview
© 2014, IJCSMC All Rights Reserved 39
VI. PERFORMANCE COMPARISON
TABLE III
Performance of Drhystone and Whetstone Benchmark
VMWare Player
Host OS Dhrystone
(Billions of operations / second) Whetstone (Million operations / second) Only integer operations Single precision Floating point operations
1 Win7-32 5.3 535
2 Win7-64 5.7 518
3 Win08 64 5.6 518
4 redhat-64 5.3 524
5
fedora13-64
5.6 510
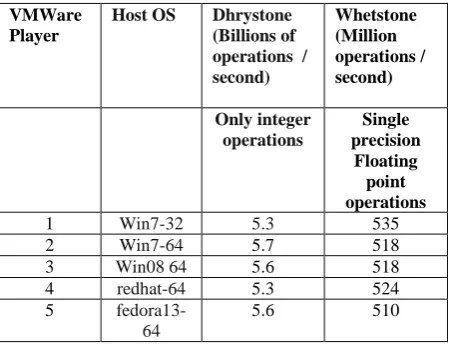
In Table III performance of Dhrystone and Whetstone is shown: The Dhrystone 2 benchmark measures that
how many billion integer operations can be performed per second. The Whetstone is a similar metric for floating
point performance in millions of operations per second. But in this paper Linpack benchmark is used and result are in GFLOPS as in Table I .
VII.CONCLUSION
In the base paper they have used the Dhrystone and whetstone benchmarks to calculate performance but out of these Dhrystone benchmark cannot calculate floating point operations and whetstone benchmark used for only single precision and not for super computers but in this paper Linpack benchmark which calculate performance in GFLOPS for single and double precision both, has been used . The effect of the I/O operations on the performance is even more noticeable as shown in Table II with increases in the simulation time when 2 virtual machines are used. For 4 cores we obtain lower simulation times than for 2 cores but just when 1 or 2 VMs are used per host. The influence of enabling the hyper-threading is imperceptible for 1 or 2 virtual machines per host, but for a 3 VMs there is a noticeable drop in the simulation time when the hyper-threading is ON, that is more substantial when there is I/O or in the Linpack benchmark. Furthermore, there is a clear deterioration in the performance when the number of VMs is increased
VIII. FUTURE SCOPE
This environment currently supports providers offering Amazon EC2-compliant interfaces, which I plan to extend for other Cloud providers. I also plan to investigate more sophisticated multi-criteria scheduling strategies such as the effect of the resource class granularity on the execution time, resource allocation efficiency, and the overall cost. I also intend to use the Cloud simulation framework presented for validating various scheduling and optimization strategies at a larger scale.
REFERENCES
[1] Steve G. Langer & Todd French: “virtual machine performance benchmarking”, society for imaging informatics in medicine, 2011
[2] L. J. Zhang, J. Zhang, J. Fiaidhi and J. M. Chang, “Hot Topics in Cloud Computing”, IEEE IT
Professional, Vol. 12, No. 5, PP: 17-19, 2010.
[3] Langer S, Charboneau N, French T: DCMTB: a virtual appliance DICOM toolbox. J Digit Imaging
2009 Aug 25. [Epub ahead of print] PMID:19705204. doi:10.1007/s10278-009-9230-8
[4] Smith JE, Nair R: The architecture of virtual machines.Comput IEEE Comput Soc 38(5):32–38, 2005.
doi:10.1109/MC.2005.173
[5] VMWare :http://www.vmware.com/files/pdf/VMware_paravirtualization.pdf Last viewed May 2010
[6] M. T. Jones, “Discover- Linux Kernel Virtual Machine”, EMULEX Corp. IBM-Developer Works,
© 2014, IJCSMC All Rights Reserved 40
[7] I. Habib , “Virtualization with KVM”, Linux Journal,2008
[8] F. Gomez-Folgar, J. L´opez Cacheiro, C. Fern´andez S´anchez, A. Garcia-Loureiro and R. Valin, “An e-Science infraestructure for nanoelectronic simulations based on Grid and Cloud technologies”,
Spanish Conference Electron Devices (CDE), PP: 1-4, 8-11, 2011
[9] A.J. Garc´ıa Loureiro, T.F. Pena, J.M. L´opez Gonz´alez and Ll. Prat, “Parallel implementation of a simulator for hetero junction bipolar transistors, VIII Symp. on Parallelism”, C´aceres, pp. 41-50, 1997
[10] J. J. Dongarra, C. B. Moler ,J. R. Bunch and G.W. Stewart, “LINPACK Users’ Guide”, SIAM publishing, 1979.
[11] Natalia Seoane, Raul Valin, Antonio J. Garcia-Loureiro, Tom´as F., Pena, “Performance of OpenMP simulations on the Cloud”, Department of Electronics & Computation, University Santiago de
Compostela, Supercomputing Center of Galicia (CESGA), 2013.
[12] S. Selberherr, “An Analysis and Simulation of Semiconductor Devices”, Springer, 1984
[13] D.L. Scharfetter and H.K. Gummel, “Large-Signal Analysis of a Silicon Read Diode Oscillator” , IEEE
Trans. On Electron Devices, pp. 64-77, 1969
[14] R.E. Bank and D.J. Rose, “Parameter Selection for Newton-Like Methods Applicable to Nonlinear Partial Differential Equations”, SIAM J. Num. Anal., Vol. 17, No. 6, pp. 806-822, 1980
[15] J.J. Dongarra, P. Luszczek and A. Petitet . “The LINPACK Benchmark: past, present and future”,
Concurrency and Computation Practice and Experience, vol: 15 issue: 9, PP: 803−820, 2003.
[16] Navdeep Kaur, Harinder Singh, “ A Review on how to measure cloud performance using linpack in cloud environment”IJARSE, Vol.03, Isuue 07, july 2014