Toward an XP Evaluation Framework
Laurie Williams
1,
William Krebs
2, Lucas Layman
1, Annie I. Antón
1 1North Carolina State University, Department of Computer Science
{lawilli3, lmlayma2, aianton}@ncsu.edu
2IBM Corporation
[email protected]
Abstract
Software organizations are increasingly adopting the software development practices associated with the Ex-treme Programming (XP) methodology. Most reports on the efficacy of these practices are anecdotal. This paper provides a benchmark measurement framework for re-searchers and practitioners to assess concretely the extent to which an organization has adopted XP practices and the result of this adoption. We present the initial valida-tion of our XP evaluavalida-tion framework based upon a year-long study in which an IBM team successfully adopted a subset of XP practices that was appropriate for their team culture and their project parameters. The XP practices adopted by the team enabled them to improve productivity and to achieve a two-fold improvement in the quality of new code when compared with an earlier release. The results of such case studies in various contexts are ex-pected to constitute a body of knowledge of systematic, empirical evaluations of XP and its practices.
1. Introduction
As a relatively young methodology in the software engineering community, Extreme Programming (XP) [7] and its development practices are becoming increasingly popular, but its value is still confounded by hype and im-plicit, yet-to-be validated knowledge. Anecdotes of in-dustrial teams experiencing success with partial or full implementations of XP are abundant [24, 25, 43]. How-ever, organizations need a framework that empirically assesses XP’s efficacy.
Permission to make digital or hard copies of all or part of this work for personal or classroom use is granted without fee provided that copies are not made or distributed for profit or commercial advantage and that copies bear this notice and the full citation on the first page. To copy otherwise, or republish, to post on servers or to redistribute to lists, requires prior specific permission and/or a fee.
Sims et al. challenged the software engineering community to create benchmarks, or a set of tests used to compare the performance of alternative techniques [39]. In this paper, we provide a benchmark for assessing the extent to which an organization has adopted XP practices and the result of this adoption. The benchmark, called the XP Evaluation Framework (XP-EF), has three parts: XP Context Factors (XP-cf), XP Adherence Metrics (XP-am) and XP Result Metrics (XP-rm). The framework was designed for use throughout development by agile teams. The metrics are focused, concise and can be collected by a small team without a dedicated metrics specialist.
In XP-EF, researchers and practitioners record essen-tial context information about their project via the XP Context Factors (XP-cf). Recording factors such as team size, project size, criticality, and staff experience can ex-plain differences in the results of applying the methodol-ogy. Through repetition of case studies and a set of uni-fying principles, results can be integrated and combined [5].
The second part of the XP-EF is the XP Adherence Metrics (XP-am). Many software development teams do not exercise all the XP practices to their full extent; some employ only a few practices. Moreover, those that do adopt all 12 practices may not strictly apply the practices at all times for a variety of reasons. For example, some team members may be resistant to a particular practice. Yet, XP originator Kent Beck purports that the set of 12 practices support each other, suggesting that all 12 must be applied [7]. The XP-am enables one to express con-cretely and comparatively the extent to which a team fol-lows XP. XP-am also alfol-lows researchers to investigate the interactions and dependencies between the XP prac-tices and the extent to which the pracprac-tices can be sepa-rated or eliminated. Because many of the XP-am metrics have not been previously established, they must be vali-dated via case studies.
par-tial set of XP practices. XP-rm consists of traditional external software development metrics, such as produc-tivity and quality. Ideally, a team performing a case study will have a baseline product to be used for comparison.
In this research, we utilized the “industry-as-laboratory” [33] approach in which software engineering researchers worked closely with industry to create and evaluate solutions [33]. In the year-long case study dis-cussed herein, the XP-EF was applied within an IBM software development team. This seven-person IBM team develops Servlet/XML applications for a toolkit that other IBM teams utilize to create products for external customers. The team adopted a subset of XP practices deemed appropriate for their team, corporate culture and project parameters. This case study represents the first effort in a family of XP-EF case studies to validate the XP-am metrics. Additionally, it demonstrates how an XP assessment is conducted utilizing the XP-EF framework.
The remainder of this paper is as organized as fol-lows. Section 2 discusses measurement frameworks and surveys related XP research. Section 3 sets the context for our IBM case study. Section 4, presents the results of the case study, employing our adherence and results measurement framework to structure the discussion. Sec-tion 5 presents the analysis of our results and our plans for future work.
2. Background and related work
In this subsection, we discuss software measurement and assessment strategies, frameworks and metrics. We then provide a survey of prior XP studies.
2.1. Strategies and frameworks
Software measurement is imperative for companies competing in a rapidly-changing environment. McGarry proposes several project management strategies to estab-lish a customized measurement framework [26]. Grady offers similar strategies tailored toward customer satis-faction, defect prevention, analysis, and removal [16]. The ISO/IEC 14598 standard [18] establishes guidelines for measuring and assessing software quality.
Several frameworks for planning the collection of software metrics exist, including the Goal-Question-Metric (GQM) approach [1, 4], the Quality Improvement Paradigm (QIP) [3], the Model, Measure, and Manage Paradigm (M3P) [29], and the Measurement Information Model (MIM) [26]. These models are process-independent and may be used to establish systems of software measurement tailored to individual projects.
Efforts have been made to integrate XP with existing frameworks. For example, Paulk examined XP from the perspective of the Software Capability-Maturity Model
(SW-CMM) [31], observing that XP either largely or par-tially addresses most of the SW-CMM’s Key Process Areas (KPA) at Level 2 and 3. However, the Level 4 and 5 KPAs are virtually unaddressed, including the Quanti-tative Process Management KPA, which is important for assessment [30]. An examination of XP requirements engineering (RE) practices in a CMM context reveals that XP satisfies many CMM conditions [42]. However, more rigorous RE approaches may be necessary early in devel-opment when the project is less well-defined [42].
Turner and Jain investigated differences between ag-ile and the Capability Maturity Model – Integrated (CMMI) concepts. They conclude that, while significant differences exist, the two paradigms do share some simi-larities and that their strengths and weaknesses are often complimentary [41]. As Reifer observes, however, find-ing a common means for integratfind-ing XP into a CMM set-ting can be difficult largely due to cultural conflicts [36].
Williams et al. [46] suggest a metric suite for empiri-cal assessment of an agile methodology’s effectiveness. Several hypotheses and metrics are proposed for produc-tivity; cycle time; externally-visible pre- and post-release quality; responsiveness to customer change; internal code structure; and job satisfaction. This prior work serves as a foundation for the framework proposed herein.
2.2. Metrics and comparisons
XP-EF is a compilation of validated and proposed metrics. The validation of metric relevance requires con-vincing demonstration that (1) the metric measures what it purports to measure and (2) the metric is associated with an important external metric, such as field reliability, maintainability, or fault-proneness [14]. The XP-rm util-izes the CK suite of object-oriented metrics as defined by Chidamber and Kemerer [12]. These metrics have been repeatedly correlated with fault proneness in industrial projects. The consistency of these findings varies de-pending on the programming language under study [40] and is still open to criticism [13]. Several of the XP-am metrics require validation via repeated use of the XP-EF.
In empirical studies, comparisons are informative. For example, a new project’s measures can be compared against a prior project’s measures within the same organi-zation. Alternatively, comparisons can be made to indus-try standards and/or benchmarks. Jones has compiled data from many software organizations and provides benchmarks, best practices, and statistics for a range of software development topics [19].
2.4. XP studies
Ras-mussen describes a successful partial-adoption of XP at TransCanada Pipelines Limited, a leading energy com-pany, in the development of a new, web-based software product and rewriting a legacy system [34]. Schuh de-scribes a study in which XP was adopted to recover an ailing project [38] at Thoughtworks. Grenning provides lessons learned from the introduction of XP into a proc-ess-intensive organization [17] at a large company devel-oping safety-critical systems. Lippert et al., suggest ways to successfully adapt and extend XP for complex projects based on experiences from five projects [23] at IT Work-place Solutions. While practical and informative, these experience reports offer little formal validation to support claims of high customer satisfaction, higher quality pro-jects, and steady or improved schedules by XP projects.
Murru et al., describe a corporate research study in which a team of developers adopted different subsets of XP practices on two separate projects [28]. In the first project, the team eliminated the planning game practice and partially adopted the simple design paradigm; the project lacked process control and coordination. Com-paratively, in the second project, the team adopted both the planning game and simple design, resulting in a suc-cessful project. This study was conducted in an industrial research setting, but, no quantitative data is available.
In a XP case study conducted in a university envi-ronment, Müller et al. found that pair programming, it-eration planning, and test-driven development had mixed benefits and implementation difficulties. XP was best suited for small teams [27]; quantitative data and a replic-able study will aid in substantiating these claims.
Reifer summarizes the results of an industrial survey conducted to determine if agile methods/XP reduces costs, improves development time, and improves quality [35]. Results from 14 firms spanning 31 projects were collected. Most projects were characterized as small pilot studies, for internal use only, and of generally low risk. The study reported that most projects had average or bet-ter than average budget performance and schedule adher-ence. Projects in the software and telecommunications industry reported product quality on par with nominal quality ratings; e-business reported above par quality rat-ings; and the aerospace industry reported a below par quality rating for their agile/XP project.
Poole and Huisman integrated several XP practices into an organization’s maintenance effort on a middle-ware project [32]. They observed a steady increase in the average of closed bugs a few weeks after adoption of the XP practices. XP helped improve process visibility and discipline, and gathering metric results proved important. While their quantitative results are limited, Poole et al. offer important first steps toward assessing the impact of XP practices.
Wood and Kleb analyzed the productivity of an XP product in a quantitative manner [47]. They performed an experiment as part of a pilot study at NASA to assess XP in a mission-critical environment. The team used a new programming language and the XP practices to produce a project that evaluated the performance of a model for solving a mathematical problem. Taking into account reduction in code size due to refactoring and the use of a more concise programming language, the XP approach was approximately twice as productive as past similar projects. The results are intriguing, but data from larger teams in a less unique context will be necessary before general conclusions can be drawn.
Bowers et al. describe a study at Motorola where XP was partially adopted for developing mission-critical software [10]. The team used an object-oriented language to develop a new release of a product, which entailed sig-nificant changes to a legacy code base. They observed increased productivity, higher velocity, and lower defect density compared to company averages. It is our hope that results such as these can be analyzed in the common framework the XP-EF provides.
3. IBM case study
Experimentation in software engineering is chal-lenging. Formal, controlled experiments, such as those conducted with students or professionals, over relatively short periods of time are often viewed as “research in the small” [15]. These experiments offer the ability to pro-duce statistically significant results yet may suffer from external validity limitations (or perceptions of such).
Alternatively, “industry-as-laboratory” case studies can be viewed as “research in the typical” [15]. Concerns with case studies involve the internal validity of the re-search [11] because the baseline and new treatments gen-erally are not identical projects and/or teams. Finally, case studies seldom yield statistically significant results due to a small sample size. Nonetheless, case studies are valuable because they involve factors that staged experi-ments generally do not exhibit, such as scale, complexity, unpredictability, and dynamism [33].
Researchers become more confident in a theory when similar findings emerge in different contexts. By per-forming multiple case studies and/or experiments and recording the context variables of each case study, re-searchers can build up knowledge through a family of experiments. Replication of experiments addresses threats to experimental validity. [5]
we refer to the second release as the “old release” and the third release as the “new release”. In the old release, the team had begun their initial adoption of XP practices. The team then increased their XP adoption in the new release. This case study will be described in terms of the XP-EF and its sub categories, XP-cf, XP-am, and XP-rm. Detailed instructions and templates for measuring and reporting the XP case study data via XP-EF Version 1.1 have been documented by the authors of this paper [22].
3.1. XP-cf: Context factors
Drawing general conclusions from empirical studies in software engineering is difficult because the results of any process largely depend the relevant context variables. We cannot assume a priori that a study’s results general-ize beyond the specific environment in which it was con-ducted [5]. Therefore, recording an experiment’s context factors is essential for comparison purposes and for fully understanding the similarities and differences between the case study and one’s own environment.
Jones [19] states that software projects can be influ-enced by as many as 250 different factors, but that most projects are affected by 10-20 major issues. He organizes key factors to be accounted for in every assessment into six categories: software classification, sociological, pro-ject-specific, ergonomic, technological, and interna-tional. The XP-EF framework templates are corre-spondingly organized into these five categories, though we modify the last factor (international) to geographical. We also include developmental factors that use a risk-driven approach for determining whether a project would be most successful using an agile or plan-driven ap-proach. In this subsection, we complete the XP-cf tem-plates with data from the IBM case study.
Software classification. According to Jones, pro-jects are classified as one of six software types: systems [used to control physical devices]; commercial [leased or marketed to external client]; information systems [for business information]; outsourced [developed under con-tract]; military; or end user [private, for personal use]. The IBM team developed software under contract for another IBM organization that ultimately marketed the product to external customers. We thus classify this pro-ject as outsourced software.
Sociological. Team conditions for both releases are shown in Table 1. As shown, the new release had a smaller team. XP and all agile methodologies rely upon tacit knowledge transfer to alleviate the challenges of personnel turnover. The turnover rate was calculated by adding the number of people who joined or left the team and dividing by the team size at the end of the release. In the old product, turnover consisted of one intern returning to school and a new intern joining the team. In the new
release, two agile veterans with high domain knowledge left the team for a new project, though one was available part time for questions. Three student interns returned to school. The table below classifies their years of experi-ence. The team members are comparable because four left but the remaining people are the same individuals.
Table 1: Sociological factors
Context Factor Old New
Team Size (Develop) 11 7
Team Education
Level All: BachelorsTwo: Masters All: BachelorsTwo: Masters Experience Level of
Team 20 years: 210 years: 3 <5 years: 2 Interns: 4
20 years: 1 10 years: 3 <5 years: 1 Interns: 1
Domain Expertise High
Language Expertise High
Experience Proj Mgr High
Specialist Available GUI Designer
Personnel Turnover 22% 36%
Morale Factors Manager change
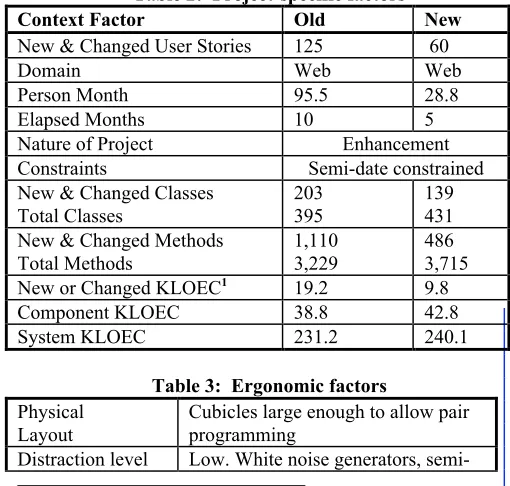
Project-specific. Table 2 compares the project-specific factors for the two releases. The language and domain were the same for both releases. Based upon the number of new classes, methods, and lines of code (LOC), the new release is approximately half the size of the old release. LOC in the Table 2 (KLOEC) are non-blank non-comment lines.
Table 2: Project-specific factors
Context Factor Old New
New & Changed User Stories 125 60
Domain Web Web
Person Month 95.5 28.8
Elapsed Months 10 5
Nature of Project Enhancement
Constraints Semi-date constrained
New & Changed Classes
Total Classes 203395 139431
New & Changed Methods
Total Methods 1,1103,229 4863,715
New or Changed KLOEC1 19.2 9.8
Component KLOEC 38.8 42.8
System KLOEC 231.2 240.1
Table 3: Ergonomic factors
Physical
Layout Cubicles large enough to allow pairprogramming Distraction level Low. White noise generators,
of office space private cubicles Customer
Communication E-mail, chat programs, phone, anddatabases
Ergonomic. Table 3 documents the projects’ ergo-nomic factors. Because both the old and new releases had the same conditions, no comparison is made. Ideally, XP is implemented in an open space office landscape. The team sat in one aisle of cubicles with room for two people pair program. A white noise generator masked distrac-tions (and information) between sets of pairs.
Technological. During the three years prior to the old release, the team had used successfully a blend of waterfall phases and informal small team practices that resembled those of XP. The team culture was small, in-formal, skilled, and adverse to heavy process. Due to their past success and their aversion to heavy process, the team often omitted heavyweight waterfall-development practices, including formal UML design documents and formal code inspections. In the new release, the team was more agile and adopted more of the XP practices. The project environment was marked by constraints that lim-ited the team’s ability to adopt all 12 XP practices to their full extent as discussed in Section 4.1. The team’s tech-nology factors are summarized in Table 4.
Table 4: Technology factors
Context Factor Old New
Software
Develop-ment Methodology Waterfall, withXP practices Primarily XP Project Management Planning Game
Gantt charts Planning Game Defect Prevention &
Removal Practices Design Reviews Pair Program.Customer Test Unit Testing
Language Java Java
Reusable Materials XML test data XML test data, IDE techniques
Geographical. Table 5 documents the geographical factors. Because both the old and new releases had the same conditions, no comparison is made.
Table 5: Geographic factors
Team location Collocated Customer
cardi-nality and loca-tion
Multiple; remote; multi-national, several time zones, some very far away
Supplier cardi-nality and loca-tion
Multiple; both remote and local; two time zones
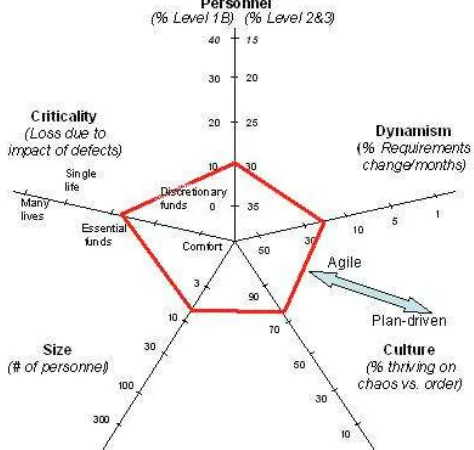
Developmental. Boehm and Turner acknowledge that agile and plan-driven methodologies each have a role in software development and suggest a risk-based method for selecting an appropriate methodology [8, 9]. Their five project factors (team size, criticality, personnel under-standing, dynamism, and culture) aid in selecting an agile, plan-driven, or hybrid process. Criticality is an indication of the magnitude of loss due to a defect, ranging from loss of many lives to loss of comfort. Personnel indicates the team’s ability, ranging from ability to perform procedural methods to ability to revise a method in an unprecedented situation. Dynamism is a measure of requirements vola-tility, and culture indicates how willing the team is to change and whether they thrive on order or chaos.
These factors are graphed on a polar chart’s five axes as shown in Figure 1. The agile risk factors appear toward the graph’s center and the plan-driven risk factors appear toward the periphery. When a project’s data points for each factor are joined, shapes distinctly toward the graph’s center suggest using an agile method. Shapes dis-tinctly toward the periphery suggest using a plan-driven methodology. More varied shapes suggest a hybrid method of both agile and plan-driven practices. As an industry, it would be beneficial to run as many case stud-ies with varying polar chart shapes to validate the risk-based approach of Boehm and Turner [8, 9].
The IBM development team’s factors are shown in Figure 1. The shape indicates that a hybrid “mostly agile, somewhat plan-driven method” is appropriate, which is what the team followed. The developmental factor that appears to necessitate plan-driven practices is criticality.
3.2. Case study limitations
One of the authors of this paper tested, coded, led, and measured the IBM team. This intimate knowledge potentially introduces bias into the study. However, his direct involvement significantly aided the research be-cause his detailed project knowledge provided qualitative details. The team knew the study was occurring so a Hawthorne effect was a concern. However, the team was more concerned about completing the project and was generally ambivalent about the case study results. A peer team participated in part of the product test, which should help remove some bias.
The period of post-release defect collection differs. The old release was available for 11 months before the new release was made available in April 2003. A propor-tion of the defects the discovered in field use of the new release can be attributed to the untouched code of old release and were counted as old release defects.
The new release was approximately half the size of the old release and had a smaller development team. Smaller projects with smaller teams are often considered to be less complex. However, the new release involved understanding and updating the larger code base.
4. Framework/Results
This section explains the adherence and results metric suites. The suites consist of both subjective and objective measures for cross-checking and substantiation.
4.1. XP-am: Adherence metrics
Teams often do not uniformly adopt all XP practices for various reasons. Determining and recording the subset of practices employed by a team is essential for several reasons. First, organizations may be interested in the ad-herence to certain practices. For example some practices, such as pair programming and test-driven development, have been shown to improve quality [44, 45] and may thus be deemed high-priority practices. Adherence met-rics also enable case study comparison, the study of XP practice interaction, and the determination of contextu-ally-based, safe XP practice subsets. The XP-am does not advocate high adherence as a universal benefit for all projects.
This case study provides initial validation of the XP-am metrics. The specific metrics are likely to change with future research and XP-EF releases. We now pro-vide subjective and objective measures as well as qualita-tive analysis about the team’s use of XP practices.
4.1.1. Subjective adherence survey. The Shodan Adherence Survey (described fully in [22] and adapted from [21]) is an in-process, subjective means of gathering XP adherence information from team members. The sur-vey, answered anonymously via a web-based application, contains 15 questions gauging the extent to which each individual uses XP practices. A survey respondent re-ports the extent to which he/she uses each practice on a scale from 0% (never) to 100% (always). The results of the survey can be used by team leaders to see how much a practice is used, the variation of use between team mem-bers, and trends of use over time. In the IBM case study, the survey was administered to the team every two months. Tracking Shodan survey results for a team is useful. However, since the Shodan survey is subjective, it is not advisable to compare survey results across teams. Table 7 reports the mean values for each of the practices for the old and the new release.
4.1.2. Objective adherence metrics. Table 6 por-trays the quantifiable adherence to XP practices for the old and new releases. An active continuation of our re-search is refining our suite of objective metrics, focusing on metrics that can be automated.
Some of the metrics warrant clarification:
• Test-run frequency measures how frequently the automated tests are run. The data shown was manually calculated and partially estimated. Ideally, the measure should be automated, and the value should be at least 1.0, indicating that each team member runs the automated test suite at least once per day.
• Test coverage was calculated for the entire com-ponent under study, including code that was not modified or added.
• The automated test classes per user story metric allows the team to examine adherence to their goal of a test class for every user story.
• Pairing frequency was calculated by examining file headers. The developers indicated in the program comment banner who worked on any file creation or modification, and pairing fre-quency was manually calculated based on these comments.
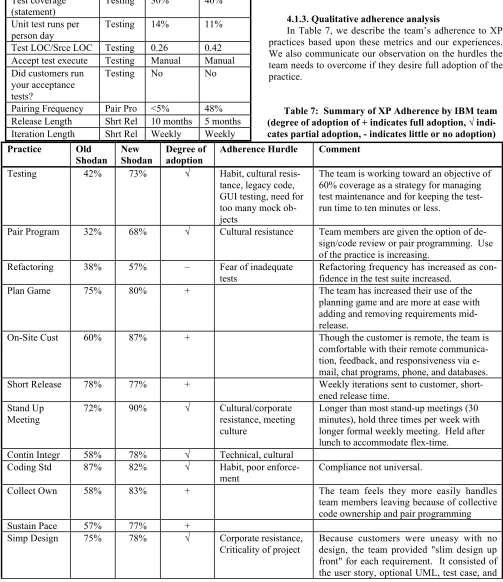
4.1.3. Qualitative adherence analysis
In Table 7, we describe the team’s adherence to XP practices based upon these metrics and our experiences. We also communicate our observation on the hurdles the team needs to overcome if they desire full adoption of the practice.
Table 7: Summary of XP Adherence by IBM team (degree of adoption of + indicates full adoption, √ indi-cates partial adoption, - indiindi-cates little or no adoption) Practice Old
Shodan NewShodan Degree ofadoption Adherence Hurdle Comment
Testing 42% 73% √ Habit, cultural
resis-tance, legacy code, GUI testing, need for too many mock ob-jects
The team is working toward an objective of 60% coverage as a strategy for managing test maintenance and for keeping the test-run time to ten minutes or less.
Pair Program 32% 68% √ Cultural resistance Team members are given the option of de-sign/code review or pair programming. Use of the practice is increasing.
Refactoring 38% 57% – Fear of inadequate
tests Refactoring frequency has increased as con-fidence in the test suite increased.
Plan Game 75% 80% + The team has increased their use of the
planning game and are more at ease with adding and removing requirements mid-release.
On-Site Cust 60% 87% + Though the customer is remote, the team is
comfortable with their remote communica-tion, feedback, and responsiveness via e-mail, chat programs, phone, and databases.
Short Release 78% 77% + Weekly iterations sent to customer,
short-ened release time. Stand Up
Meeting 72% 90% √ Cultural/corporateresistance, meeting culture
Longer than most stand-up meetings (30 minutes), hold three times per week with longer formal weekly meeting. Held after lunch to accommodate flex-time.
Contin Integr 58% 78% √ Technical, cultural
Coding Std 87% 82% √ Habit, poor
enforce-ment Compliance not universal.
Collect Own 58% 83% + The team feels they more easily handles
team members leaving because of collective code ownership and pair programming
Sustain Pace 57% 77% +
Simp Design 75% 78% √ Corporate resistance,
Criticality of project Because customers were uneasy with nodesign, the team provided "slim design up front" for each requirement. It consisted of the user story, optional UML, test case, and standards checklist (performance, logging).
XP-am Metric Practice Old New
Automated test class
per user story Testing 0.11 0.45 Test coverage
(statement) Testing 30% 46%
Unit test runs per
person day Testing 14% 11%
Test LOC/Srce LOC Testing 0.26 0.42 Accept test execute Testing Manual Manual Did customers run
your acceptance tests?
Testing No No
standards checklist (performance, logging). Customer indicating increased confidence in SDUF.
Metaphor 32% 43% – Lack of
understand-ing Difficulty in understanding metaphor.
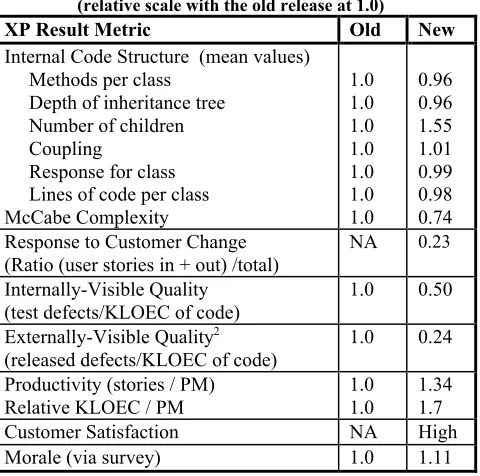
4.2 XP-rm: Result Metrics
Of utmost importance to decision makers is whether or not adopting XP practices helps their business. The IBM business-related results are shown in Table 8, using a relative scale to protect proprietary information as needed.
Table 8: XP result metrics (relative scale with the old release at 1.0)
XP Result Metric Old New
Internal Code Structure (mean values) Methods per class
Depth of inheritance tree Number of children Coupling
Response for class Lines of code per class McCabe Complexity
1.0 1.0 1.0 1.0 1.0 1.0 1.0
0.96 0.96 1.55 1.01 0.99 0.98 0.74 Response to Customer Change
(Ratio (user stories in + out) /total) NA 0.23 Internally-Visible Quality
(test defects/KLOEC of code) 1.0 0.50 Externally-Visible Quality2
(released defects/KLOEC of code) 1.0 0.24 Productivity (stories / PM)
Relative KLOEC / PM 1.01.0 1.341.7 Customer Satisfaction NA High Morale (via survey) 1.0 1.11
Internal Code Structure. Since “big design up front” (BDUF) is not emphasized with XP, software developers can be concerned with the resulting design of the imple-mented code. We utilize CK metrics (as discussed in Section 2.2) to assess the code structure. Table 8 displays the difference of the CK metrics between releases. With the exception of Number of Children, the internal code structure stayed relatively constant. In all cases, the mean values for these metrics did not exceed industry-standard thresholds [20, 37]. The cohesion metric of the CK suite was not computed due to lack of support for the validity of this metric [6]. Moreover, the McCabe Complexity decreased. Additionally, the CK metrics of three repre-sentative, frequently-modified classes were compared between releases on a relative scale. For these classes,
2The period of collection differs. The old project had 11 months of post release use and the new release has four months.
Methods per Class dropped on average to 60%, coupling to 86%, Response for Class to 83%, and lines of code to 66% (the refactoring effort had reduced the lines of code).
Response to Customer Change. The number of user stories added and removed based on customer prior-ity/preference change is important because it relates to an XP team’s degree of flexibility or agility. Response to Customer Change was not computed for the old release. However, anecdotally, fewer requirements were added during the old release than the new release.
Internally-visible Quality. Internal (pre-release) qual-ity, which concerns the rate of defects found in the new code, improved by a factor of two. The defects were identified by an external IBM testing organization. For the old release, 65 scenarios were tested. For the new release, 96 were tested. We assess that the testing effort for the new release was at least as thorough as that of the old release
Externally-visible Quality. To date, the new release’s post-release defect density of new code has improved by a factor of four. However, the collection period differs, and it is likely that more bugs may be reported for the new release. Based upon historical defect reporting trends, we expect the post-release quality to be superior with the new release.
The severity distribution of the pre- and post-release defects (faults) was similar between releases as shown in Table 9.
Table 9: Defect severity distribution
Se-verity d Ol New
Critical 4% 3% High 36% 42% Medium 50% 40%
Low 10% 15%
Productivity. The productivity calculation was based upon user stories rather than lines of code (LOC) because the customer does not pay for LOC, but for features or billable output3. However, for comparison to traditional
data, it is still useful to gather LOC/person-month (PM) as a cross check to the uncalibrated user stories/PM metric. A benefit of the user stories/PM metric is it creates no
extra work for the team. Function points were not used in this metric because they require use of a trained specialist. Function points can be estimated from LOC, but this process is often inaccurate [19].
Customer satisfaction. Proponents of XP profess that customers are more satisfied with the resulting project because the team produced what they actually wanted, rather than what they had originally expressed they wanted. In the future, we plan to author and validate a customer satisfaction survey instrument. For the IBM project, anecdotally the customer was very satisfied with the team’s work.
Morale. Morale was assessed via an additional tion placed on the Shodan Adherence Survey. The ques-tion read, “How often can you say you are enjoying your work?” The results of the survey indicated an overall increase in morale as the team utilized more XP practices.
5. Discussion and Future Work
The XP-EF framework provides informative feed-back utilizing streamlined process and project metrics appropriate for a lightweight software process. Software measurement is a challenging and time-consuming task. Small software development teams require a smaller, more manageable metrics set that provides constructive feedback about their development process. The IBM team members checked their adherence metrics bimonthly to determine if they were falling behind in pairing or test adherence. By immediately addressing or fixing identi-fied problems in key practices, they were better able to observe the benefits of their development process. Also, having a team member collecting the data enabled them to identify any misleading subjective survey information that was not apparent from the raw numbers. The availability of XP-rm metrics during development allowed the team to focus their efforts on improving code modules with poor structure. They were also able to calculate and improve their productivity (termed velocity in XP), an important item for team motivation and management acceptance. Our proposed metrics were comprehensive enough for this software development team to evaluate the efficacy of their XP practices, while not imposing excessive burden.
Practitioners can adopt a “safe” subset of XP prac-tices despite warnings of XP advocates of the essential dependencies between practices. With the IBM team, some practices were used more than others. Variations occurred due to individual preference and corporate cul-ture and constraints. We observed a steady increase in XP use by the team as they began to see the benefits of the process, due in part to feedback from the XP-EF framework. The hybrid process was both agile and suc-cessful.
Our findings suggest that agile/XP methodologies can be adopted in environments reliant on traditional software methods. While the team members already con-sidered themselves to be “lightweight” and less formal, the traditional process at IBM was not and could not be totally abandoned.XP was adapted to provide prescriptive process guidance to the team while allowing them to maintain their desired informal culture. The consequent compromise between XP practices and existing methods generated a process that met project deadlines and pro-duced a higher quality product. This case study advances the growing body of XP knowledge and suggests that the hybridization of agile and traditional methodologies is a viable middle ground for companies who do not fit into either archetype.
For new code, internal code quality improved by a factor of two and external quality improved by a factor of four as XP usage increased. Given the small sample size in our study, it is not possible to say that the improvement was due to XP alone. However, it is likely that quality was influenced by the increased adoption of the XP prac-tices. The improvement in quality was the likely result of test-first design, pair programming, customer acceptance tests, and customer access used in conjunction with qual-ity assurance practices already in place at IBM. Other factors, such as project complexity and size, may have influenced the results. These findings point to areas of further research into the effectiveness of XP quality as-surance practices.
We plan to replicate this study with multiple projects to compare the results. We welcome participation by other researchers to do the same. This family of experi-ments can be used to create an Experience Factory [2] of XP efficacy knowledge. Such research will also enable further validation of the XP-EF framework and its evolu-tion and will expand the benchmark metric suite of the XP-EF. We also plan to create a framework visualization that will be used to display, at a high level, the results of the spectrum of case studies that have been examined with the XP-EF.
Acknowledgements
References
[1] V. Basili, G. Caldiera, and D. H. Rombach, "The Goal Question Metric Paradigm," in Encyclopedia of Software Engi-neering, vol. 2: John Wiley and Sons, Inc., 1994, pp. 528-532. [2] V. Basili, G. Caldiera, and H. D. Rombach, "The Ex-perience Factory," in Encycopedia of Software Engineering, J. C. Marciniak, Ed.: John Wiley, 1994.
[3] V. Basili and S. Green, "Software Process Evolution at the SEL," IEEE Software, vol. 11, pp. 58-66, July 1994.
[4] V. Basili and D. Weiss, "A Methodology for Collect-ing Valid Software EngineerCollect-ing Data," IEEE Transactions on Software Engineering, vol. 10, pp. 728-738, Nov. 1984.
[5] V. Basili, Shull, F.,Lanubile, F., "Building Knowledge through Families of Experiments," IEEE Transactions on Soft-ware Engineering, vol. Vol. 25, No.4, 1999.
[6] V. R. Basili, L. C. Briand, and W. L. Melo, "A Vali-dation of Object Orient Design Metrics as Quality Indicators," IEEE Transactions on Software Engineering, vol. 21, pp. 751-761, 1996.
[7] K. Beck, Extreme Programming Explained: Embrace
Change. Reading, Massachusetts: Addison-Wesley, 2000.
[8] B. Boehm and R. Turner, Balancing Agility and
Dis-cipline: A Guide for the Perplexed: Addison Wesley, 2003. [9] B. Boehm and R. Turner, "Using Risk to Balance Agile and Plan-Driven Methods," IEEE Computer, vol. 36, pp. 57-66, June 2003.
[10] J. Bowers, J. May, E. Melander, M. Baarman, and A.
Ayoob, "Tailoring XP for Large System Mission-Critical Soft-ware Development," Extreme Programming/Agile Universe, Chicago, IL, 2002.
[11] D. T. Campbell and J. C. Stanley, Experimental and
Quasi-Experimental Design for Research. Boston: Houghton Mifflin Co., 1963.
[12] S. R. Chidamber and C. F. Kemerer, "A Metrics Suite for Object Oriented Design," IEEE Transactions on Software Engineering, vol. 20, 1994.
[13] N. I. Churcher and M. J. Shepperd, "Comments on 'A Metrics Suite for Object-Oriented Design'," IEEE Transactions on Software Engineering, vol. 21, pp. 263-5, 1995.
[14] K. El Emam, "A Methodology for Validating Software Product Metrics," National Research Council of Canada, Ot-tawa, Ontario, Canada NCR/ERC-1076, June 2000 June 2000. [15] N. E. Fenton and S. L. Pfleeger, Software Metrics: A Rigorous and Practical Approach: Brooks/Cole Pub Co., 1998. [16] R. Grady, Practical Software Metrics for Project Man-agement and Process Improvement. Englewood Cliffs, NJ: Prentice Hall, 1992.
[17] J. Grenning, "Launching Extreme Programming at a Process-Intensive Company," IEEE Software, vol. 18, pp. 27-33, 2001.
[18] ISO/IEC, "DIS 145981 Information Technology -Software Product Evaluation," 1996.
[19] C. Jones, Software Assessments, Benchmarks, and Best Practices. Boston, MA: Addison Wesley, 2000.
[20] S. Kan, Metrics and Models in Software Quality Engi-neering: Addison Wesley, 2003.
[21] W. Krebs, "Turning the Knobs: A Coaching Pattern for XP Through Agile Metrics," Extreme Programming/Agile Universe, Chicago, IL, 2002.
[22] W. Krebs, L. Layman, and L. Williams, "The Extreme Programming Evaluation Framework Version 1.1," North Caro-lina State University Department of Computer Science TR-2003-17, 2003.
[23] M. Lippert, P. Becker-Pechau, H. Breitling, J. Koch, A. Kornstädt, S. Roock, A. Schmolitzky, H. Wolf, and H. Zül-lighoven, "Developing Complex Projects Using XP with Exten-sions," IEEE Computer, vol. 36, pp. 67-73, June 2003.
[24] M. Marchesi and G. Succi, "Extreme Programming Examined," in XP Series, K. Beck, Ed. Boston: Addison Wesley, 2001.
[25] M. Marchesi, G. Succi, D. Wells, and L. Williams, "Extreme Programming Perspectives," in XP Series, K. Beck, Ed. Boston: Addison Wesley, 2002.
[26] J. McGarry, D. Card, C. Jones, B. Layman, E. Clark,
J. Dean, and F. Hall, Practical Software Measurement: Objec-tive Information for Decision Makers. Boston, MA: Addison Wesley, 2002.
[27] M. M. Muller and W. F. Tichy, "Case Study: Extreme Programming in a University Environment," 23rd International Conference on Software Engineering (ICSE2001), May 2001. [28] O. Murru, R. Deias, and G. Mugheddue, "Assessing XP at a European Internet Company," IEEE Software, vol. 20, pp. 37-43, May-June 2003.
[29] R. Offen and R. Jeffery, "Establishing Software Measurement Programs," IEEE Software, pp. 45-53, March/April 1997.
[30] M. Paulk, "Extreme Programming from a CMM
Per-spective," IEEE Software, vol. 18, pp. 19-26, 2001.
[31] M. C. Paulk, B. Curtis, and M. B. Chrisis, "Capability Maturity Model for Software Version 1.1," Software Engineer-ing Institute CMU/SEI-93-TR, February 24, 1993 1993.
[32] C. Poole and J. W. Huisman, "Using Extreme Pro-gramming in a Maintenance Environment," IEEE Software, vol. 18, pp. 42-50, Nov/Dec 2001.
[33] C. Potts, "Software Engineering Research Revisited," IEEE Software, pp. 19-28, September 1993.
[34] J. Rasmussen, "Introducing XP into Greenfield Pro-jects: Lessons Learned," IEEE Software, vol. 20, pp. 21-28, May-June 2003.
[35] D. J. Reifer, "How to Get the Most out of Extreme Programming/Agile Methods," 2nd XP and 1st Agile Universe Conference, Chicago, IL, August 2002.
[36] D. J. Reifer, "XP and the CMM," IEEE Software, vol. 20, pp. 14-15, May/June 2003.
[37] L. Rosenberg, "Applying and Interpreting Object Ori-ented Metrics," NASA Software Assurance Technology Center April 1998.
[38] P. Schuh, "Recovery, Redemption, and Extreme Pro-gramming," IEEE Software, vol. 18, pp. 34-41, Nov/Dec 2001. [39] S. E. Sim, S. Easterbrook, and R. C. Holt, "Using Benchmarking to Advance Research: A Challenge to Software Engineering," International Conference on Software Engineer-ing, Portland, 2003.
[41] R. Turner and A. Jain, "Agile Meets CMMI: Culture Clash or Common Cause?," 2nd XP and 1st Agile Universe Conference, Chicago, IL, August 2002.
[42] L. Wagner, "Extreme Requirements Engineering,"
Cutter IT Journal, vol. 14, pp. 34-38, December 2001.
[43] D. Wells and L. Williams, "Extreme Programming and Agile Methods -- XP/Agile Universe 2002," in Lecture Notes in Computer Science. Berlin: Springer-Verlag, 2002. [44] L. Williams, R. Kessler, W. Cunningham, and R. Jef-fries, "Strengthening the Case for Pair-Programming," in IEEE Software, vol. 17, 2000, pp. 19-25.
[45] L. Williams, E. M. Maximilien, and M. Vouk, "Test-Driven Development as a Defect-Reduction Practice," IEEE International Symposium on Software Reliability Engineering, Denver, CO, 2003.
[46] L. Williams, G. Succi, M. Stefanovic, and M. Marchesi, "A Metric Suite for Evaluating the Effectiveness of an Agile Methodology," in Extreme Programming Perspectives, M. Marchesi, G. Succi, D. Wells, and L. Williams, Eds. Boston, MA: Addison Wesley, 2003.