90 | P a g e
STUDY OF CHALCOGENIDE MATERIAL AND THEIR
USE IN OPTICAL STORAGE DEVICES
Satendra Singh
1, Satish Kumar
21,2
Department of Physics, OPJS University, Churu, Rajasthan 331303, (India)
ABSTRACT
Present paper report the effect of silver (Ag) content on optical properties of amorphous chalcogenide glasses Se 40-xTe60Agx ( x = 0, 2, 4, 6, 8). Thin films of a-Se40-xTe60Agx glassy alloys have been synthesized by thermal evaporation
technique under high vacuum conditions (~ 10-4 Pa). The optical spectra of amorphous Se40-xTe60Agx (x = 0, 2, 4,
6, 8) thin films have been measured by a double beam UV-VIS-NIR computer controlled spectrophotometer in the wavelength range 400-3300 nm.Swanepole technique has been used to calculate the optical constants [refractive index (n), extinction coefficient (k), and absorption coefficient (α)] and optical band gap of amorphous Se 40-xTe60Agx thin films. Absorption coefficient (α) increases with incident photon energy (hν) for all the samples. The
optical band gap decreases with increase of the silver (Ag) content. The decrease in optical band gap with increase of the Ag content has been explained on the basis of Mott and Davis Model.
Keywords: Thin Films, Chalcogenide Glasses, Optical Constants, Optical Band Gap.
I INTRODUCTION
91 | P a g e
necessary to increase their softening temperature and mechanical strength. The interest in these materials arises particularly due to their ease of fabrication in the form of bulk and thin films.
The effect of an impurity in an amorphous semiconductor material may be widely different, depending on the conduction mechanism and the structure of material [15]. The impurity may either destroy the dangling bond centres of one sign or form charged centres which are compensated by centers of opposite sign. In the present study work Ag has been chosen as an additive element in Se-Te alloys. The third element behaves as chemical modifier as it is reported to expand the glass forming region. The addition of third element like Ag in Se-Te binary alloy is expected to change the optical and electrical properties of host alloy. A typical chalcogenide has a relatively sharp optical absorption edge, single electrical activation energy, efficient photo excited conductivity and luminescence. The study of the optical properties of chalcogenide glasses is important for the determination of the electronic band structure as well as other optical parameters, such as optical energy gap and refractive index. The aim of present paper is to study the effect of Ag incorporation on the optical properties of Se-Te alloys. The optical transmission spectra of the amorphous thin films of a-Se40-xTe60Agx are measured by spectrophotometer. Optical parameters like
refractive index, extinction coefficient, real and imaginary dielectric constants, absorption coefficient and optical band gap have been calculated for a Se40-xTe60Agx glassy system.
II EXPERIMENTAL PROCEDURE
Glassy alloys of a-Se40-xTe60Agx ( x= 0, 2, 4, 6, 8) were prepared by melt-quenching technique. High purity 99.999%
Se, Ag and Te granules were weighted according to the formula of a-Se40-xTe60Agx (x = 0, 2, 4, 6, 8). The powder
mixture was loaded into quartz ampoule and sealed under vacuum at 10-4 Pa. The sealed quartz ampoules was loaded in a furnace and heated to 950oC at a rate of 3-4 0C/minute for 20 hours to ensure the composition homogeneity and quenched in liquid nitrogen. The ingots were crushed, separated, grounded and characterized. The glassy nature of alloys was checked with the help of X-ray diffraction technique using Cu-Kα radiation.
The thin films of chalcogenide were synthesized by thermal evaporation technique under high vacuum conditions (~ 10-4 Pa) using a small piece of bulk alloy as a source material and glass as a substrate. The films were kept inside the deposition chamber for 24 hours to achieve the metastable equilibrium. The optical transmission spectra of amorphous Se40-xTe60Agx (x = 0, 2, 4, 6, 8) thin films have been measured by a double beam UV-VIS-NIR computer
controlled spectrophotometer as a function of wavelength.
III RESULT AND DISCUSSION
3.1 Determination of Optical Constants
By Swanepole's method [16], the optical parameters are deduced from the fringe patterns in the transmittance
92 | P a g e
n = [N + (N2 - s2)1 / 2]1 / 2 (i)
Where N = (2s / T
m) - (s2 + 1) / 2, s is the refractive index of the substrate and Tm is the envelope function of the
transmittance minima.
Where (α ≠ 0), in the region of weak and medium absorption, the refractive index n is given by
n = [N + (N2 - s2)1/2]1/2 (ii)
where N = {2s(TM - Tm) / }TMTm + (s2 + 1) / 2 and Tm is the envelope function of the transmittance maxima.
In the region of strong absorption, the transmittance decreases drastically and refractive index (n) can be estimated by extrapolating the values in the other regions.
If n1 and n2 are the refractive indices at two adjacent maxima and minima at λ1 and λ2 then the thickness of the film
(d) is given by
d = λ1λ2 / 2[λ1n2 - λ2n1] (iii)
The extinction coefficient (k) can be calculated by relation (iv)
k = α λ / (4π) (iv) = (λ / 4πd) ln (1/x)
where x is the absorbance and d is the film thickness.
In the region of weak and medium absorption, absorbance (x) can be calculated from the transmission minima Tm
and given in equation (v)
x = [Em - {Em - (n2 -1)3 (n2 - s4)1/2] / [(n - 1)3 (n - s2)] (v)
where Em = [(8n2s/Tm)-(n2-1)(n2-s2)]
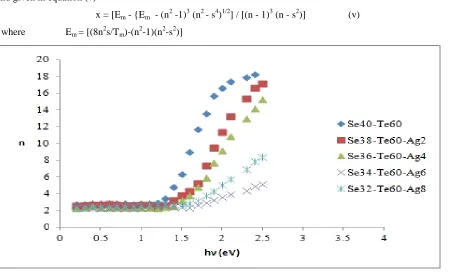
Fig 1. Variation of refractive index (n) with photon energy (hν) for amorphous Se
40-xTe
60Ag
xthin
93 | P a g e
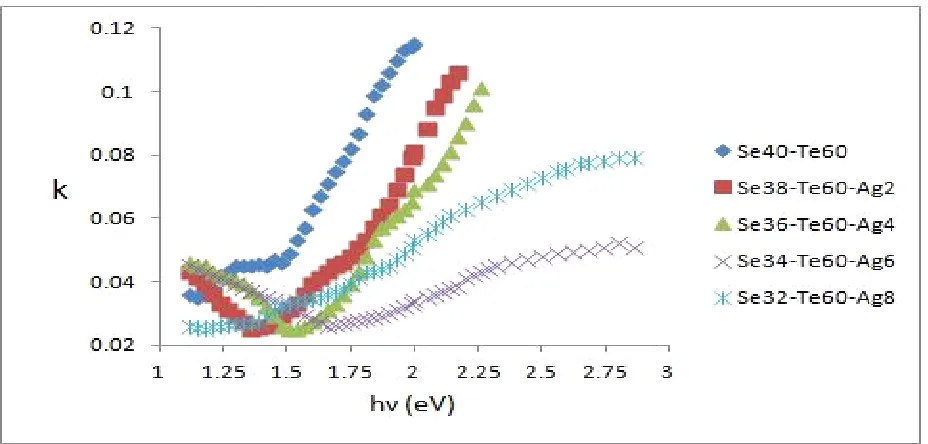
The obtained values of refractive index and extinction coefficient are given in Table 1 The variation of refractive index with photon energy (hν) is shown in Fig. 1 and the variation of extinction coefficient with photon energy is shown in Fig. 2. It is observed that the value of refractive index and extinction coefficient show an overall increasing trend with the increase in photonic energy. From Table 1, it is observed that the values of refractive index (n) and extinction coefficient (k) increases with the increase of Ag content for a-Se40-xTe60Agx thin films. This
spectral and dopant dependence of optical constants with the photonic energy will be helpful in deciding on the suitability of this system for application in optical data storage devices.
Fig 2. Variation of extinction coefficient (k) with photon energy (hν) for amorphous Se
40-xTe
60Ag
xthin films.
Table 1: Optical parameters for amorphous Se
40-xTe
60Ag
xthin films at 1600 nm
Material
Refractive
Index (n)
Extinction
Coefficient(k)
Absorption
Coefficient
(α)(m
-1) x 10
3Optical
Band
Gap Eg (eV)
Se
40Te
6016.65
0.115
27.50
1.36
Se
38Te
60Ag
211.35
0.081
14.00
1.45
Se
36Te
60Ag
49.15
0.069
10.10
1.47
Se
34Te
60Ag
63.55
0.034
4.10
1.31
94 | P a g e
These are found to increase with the increase in photon energy and also with addition of Ag impurity in the present system of a-Se40-xTe60Agx thin films.
3.2 Absorption Coefficient and Optical Band Gap
The absorption coefficient (α) of amorphous Se40-xTe60Agx thin films have been calculated by using relation
α = 4πk / λ
(vi)
Fig 3. Variation of absorption coefficient (α) with photon energy (hν) for amorphous Se
40-xTe
60Ag
xthin films.
Here an increase in the value of absorption coefficient (α) with the increase in photon energy for a-Se40-xTe60Agx
thin films and it is also observed that the value of absorption coefficient increases with the increase of Ag content. Due to the large absorption coefficient these materials may be suitable for optical memory storage devices.
The optical band gap is calculated from absorption coefficient data as a function of energy (hν) by using Tauc
relation [17].
α = A(hEg)n/h (xii)
Here A is a constant, Eg is the optical band gap of the material and the exponent n depends on the type of transition and have values 1/2, 2, 3/2 and 3 corresponding to the allowed direct, allowed indirect, forbidden direct and forbidden indirect transitions, respectively.
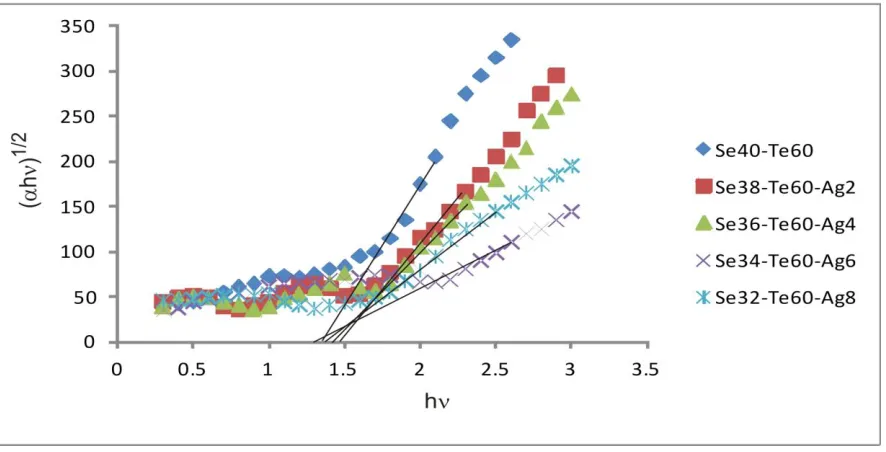
The present system of a-Se40-xTe60Agx obeys the rule of allowed indirect transition. The values of optical band gap
(Eg) is calculated by extrapolating the straight line portion of (αhν) 1/n vs. hν by taking n = 2 as shown in Fig. 4. The
95 | P a g e
(Eg) decreases with increase of the Ag content. The decrease in optical band gap with increase of the Ag content can be explained on the basis of Mott and Davis Model [16]. According to this technique, chalcogenide thin films contain a high concentration of defect states and these defects are responsible for the presence of localized states in the band gap. The decrease in optical band gap indicates an increase in the density of defect states. The decrease in optical band gap along with the increase in the density of defect states may also be correlated with electronegativity of the elements involved. The electronegativity of Se, Te and Ag are 2.4, 2.1 and 2.05 respectively and Ag has lower electronegativity than Se. The valance band of chalcogenide glasses contains the loan pair p-orbital and addition of electropositive element (Ag) to electronegative element (Se) may raise the energy of loan pair states, which is further responsible for the broadening of the valance band inside the forbidden gap and leads to band tailing and hence band gap shrinkage
Fig 4. Variation of (αhν)
1/2with photon energy (hν) for amorphous Se
40-x
Te
60Ag
xthin films
.
These indirect band gap materials may have potential applications in optical recording media, infrared spectroscopy, laser fibers, xerography, fiber optical telecommunication and electrographic applications. Moreover, their refractive index and transparency in the infrared region are good indicators for integrated optics and detection in the near-infrared spectral domain.
IV CONCLUSION
Thin films of a-Se40-xTe60Agx glassy alloys have been synthesized by thermal evaporation method by using
96 | P a g e
optical transmission spectra of amorphous Se40-xTe60Agx (x = 0, 2, 4, 6, 8) thin films have been measured by a
double beam UV-VIS-NIR computer controlled spectrophotometer. Swanepole method has been used to calculate the refractive index, real and imaginary dielectric constants, extinction coefficient, absorption coefficient and optical band gap.
The refractive index (n), extinction coefficient (k),and absorption coefficient (α) increase with increase of photon
energy and also increase with the Ag concentration. The optical band gap (Eg) decreases with increase of the Ag
content. The decrease in optical band gap with increase of the Ag content may be due to increase in the density of defect states. The decrease in band gap could also be explained in terms of electronegtivity difference between the elements. On the basis of above reported values of optical parameters, one may decide the suitability of these materials for optical devices.
REFERENCES
[1] J. S. Sanghera, J. Heo, J. D. Mackenize, J. Non-Cryst. Solids 103, 155 (1988). [2] V. Pandey, S.K. Tripathi, A. Kumar, Journal of Ovonic Research 2, 67-76 (2006). [3] M. Saxena, S. Gupta, A. Agarwal, Adv. Appl. Sci. Research 2(2), 109-116 (2011). [4] G. Kaur, T. Komatsu, J. Mater. Sci. 36, 453 (2001).
[5] Z. Abdel-Khalek Ali, G.H. Adel, A.S. Abd-rbo, Chalc. Lett. 6, 125 (2009). [6] V. Trnovcona, I. Furar, D. lezal, J. Non-Cryst. Solids 353, 1311 (2007). [7] A. Kumar, P. B. Barman, R. Sharma, Adv. Appl. Sci. Research 1(2), 47 (2010). [8] A. Kumar, M. Lal, K. Sharma, S. K. Tripathi, N. Goyal, Chalc. Lett. 9, 275 (2012).
[9] V. K. Saraswat, V. Kishore, K. Singh, N. S. Sexana, T. P. Sharma, Chalc. Lett. 3, 61Non-Cryst. Solids 286, 89 (2001).(2006).
[10] R. M. Mehra, G. Kaur, P. C. Mathur, J. Mater. Sci. 26, 3433 (1991).
[11] A. A. Manshina, A. V. Kurochkin, S. V.Degtyarev, Ya. G. Grigoriev, A. S. Tverjanovich, Yu. S. Tveryanovich, V. B. Smirnov, Proc. SPIE 4429, 80 (2001).
[12] A. S. Tverjanovich, Ya. G. Grigoriev, S. V. Degtyarev, A. V. Kurochkin, A. A.Manshina, Yu.S. Tveryanovich, J.
[13] A. B. Seddon, J. Non-cryst. Solids 44, 184 (1995).
[14] J. S. Sanghera, I. D. Agrwal, J. Non-cryst. Solids 6, 256-257 (1999). [15] N. F. Mott, Philos. Mag.19, 835 (1969).