Classification and Regression Analysis of the
Prognostic Breast Cancer using Generation
Optimizing Algorithms
Rafaqat Alam Khan
University of Eng. & Tech.Peshawar, Pakistan
Nasir Ahmad
University of Eng. & Tech.Peshawar, Pakistan
Nasru Minallah
University of Eng. & Tech.Peshawar, Pakistan
ABSTRACT
Breast cancer is one of the main causes of female fatality all over the world and is the major field of research since quite a long time with lesser improvement than expected. Many institutions and organizations are working in this field to lead to a possible solution of the problem or to lead to more understanding of the problem. Many previous researches were studied for better understanding of the problem and the work done already to remove redundancy and contribute to the field, Wisconsin-Madison prognostic Breast cancer (WPBC) data set from the UCI machine learning repository was used for training of 198 individual cases by selecting best features out of 34 predictors. Feature selection algorithms were used with machine learning algorithms for feature reduction and for better classification. Different feature selection and generation algorithms were used to improve the accuracy of classification. Many improvements in accuracies were found out by using different approaches than the earlier studies conducted in the same field. The Naïve Bayes and Logistic Regression algorithms showed 8.28-12.32% and 0.82-1.52% accuracy via 10 fold cross validation analysis improvement accordingly by using different feature selection and generation algorithms with these classifiers and gave better result than the best results known for these classification algorithms.
General Terms
Pattern Recognition, Classification, Cancer.
Keywords
Naïve Bayes, Feature Selection, Logistic.
1.
INTRODUCTION
Motivation:Breast Cancer is considered as one of the most occurring cancers [13], by the number of new cases diagnosed. Two major subtypes of breast cancer are basal and luminal respectively. Luminal is the most common type and it has higher rate of occurrence and prognosis than basal [4]. Differentiation between these two is vital for Doctor.
In this paper, different types of classification algorithms to differentiate between good and bad prognosis i.e. Recurrent and Non Recurrent have been applied. We have given the result of classification before feature selection and after feature selection. 11 classifiers were used in this study with 4 feature selection and generation algorithms. The result of the majority of the classification and Regression algorithms improved after feature selection and generation algorithms
different from those of the earlier studies. In some cases it improved a lot like in Rule induction with feature selection and without feature selection the accuracy increase twice of the original one as shown in table 3. While in some cases the accuracy of the classifier remained constant.
Related Work: Researchers [1] have measured the accuracy of classification algorithms on Wisconsin Madison Breast Cancer Data set. We shall discuss those problems which are related to pattern recognition techniques for classification problems and specially related to prognosis of breast cancer data taken from Wisconsin Madison Breast Cancer.
Neighbors, Decision Tree and Best Z-Score (Slightly modified version of Naïve Bayes) are compared. They are applied to two cancer datasets i.e. Breast Cancer and Colorectal. The technique used for the classification was done in Python version 2.7.The experimental result shows that Best Z-Score and Decision Tree performed best result for the classification of the cancer data. In [10], through fine needle aspiration (FNA) is applied to breast masses and 10 features were extracted. They get 96.2% accuracy for logistic Regression and 97.5% accuracy for inductive machine learning. In [11] performed in 2011 Decision Tree Classifier-CART is applied to three Wisconsin breast cancer datasets taken from UCI Machine learning Repository. CART is used with and without feature selection algorithms for finding the accuracy of the three datasets. They get lot of improvement in the accuracy and also in the reduction of features by using CART classifiers with different feature selection algorithms such as Genetic, Greedy-Stepwise, Best-first, Subset size Forward selection Linear Forward Selection, Random, Exhaustive, Rank, and Scatter. In latest study [1] performed in 2012 Shomona Gracia Jacob and R.Geetha Ramani proposed efficient classifiers by using different feature selection algorithms on WPBC Breast cancer data set. In this paper 20 different classifiers were used for classification of Wisconsin Prognostic Breast Cancer (WPBC) dataset with and without feature selection algorithms. The feature selection algorithms used with these classifiers are Forward Logistic Regression (FLR), Fisher Filtering (FF), Stepwise Discriminant Analysis, Backward Logistic Regression, ReliefF Filtering and Runs Filtering. They have first find out the accuracy of 20 classifiers without feature selection, in which C4.5 and Random Tree accuracy were to be found out 100%. Further on the 20 classifiers were used with these feature selection algorithms. However improvement was noticed in only 2 of the classifiers, KNN and Naïve Bayes.
2.
DATA ANALYSIS
The dataset for the required analysis was taken from the website [5] [3] WPBC (Wisconsin prognostic Breast Cancer Dataset.
The data is for 198 instances using 34 attributes. The data was organized by Dr. Wolberg [6][11][12][13] since 1984. This data is widely used for classification and regression. This dataset has the instances from patients with both recurrent and non-recurrent cancer types.
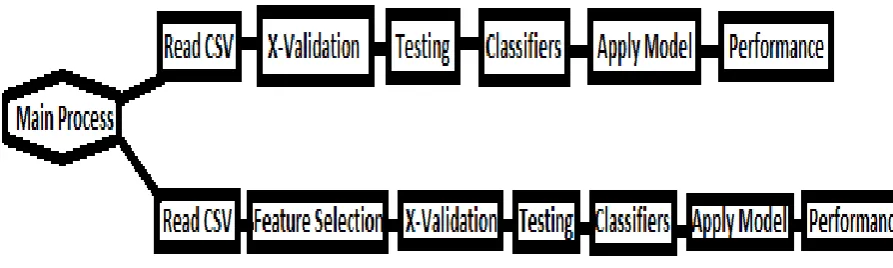
The tool used for the analysis of data is Rapid miner 5.2 [7]. The tool takes the data as CSV input and produces the result as table. The tool helps you classify the data using different classifiers and also using different feature selection techniques for each classification.
The data earlier mentioned is used to predict the accuracy of the detection using different classifier. For the earlier analysis the feature selection is not used and just classifiers are used to get the required accuracy for each of the classifiers. The data is then again classified but this time different feature selection techniques are used for the enhancement of the results or to check for any possible improvements. The use of feature selection techniques also help in dimensionality reduction as feature reduction. This further on improves memory optimization and time latency. The classifiers tested for accuracy were the same as those used in an earlier study [1]. This approach was followed as to make improvement to the accuracy of the classification as done in the earlier study. The classification algorithms were then tested for improvement as a result in improvement in the accuracy, by using different feature selection techniques from the ones used in the study being followed. Some tests resulted in the same results as earlier with no improvements to the accuracy however some of the results had improved with the use of different feature selection techniques from the one used earlier. These improvements are mentioned on later in the paper.
Different feature selection techniques from the ones earlier used were tested here for improvement in accuracy. The classification accuracy in some cases was different from the one specified in the earlier study so in that case the improvement was treated as a percentage improvement in accuracy to check for betterment. The Naïve Bayes and logistic regression classification showed improvements from the earlier study [1].
[image:2.595.57.504.578.712.2]This study used the GGA, AGA, YAGGA and YAGGA2 as the feature selection and generation algorithms. The classifiers used were Naïve Bayes, Logistic Regression, ID3, KNN, Decision Tree, Decision Tree (Weight Based), Decision Stump, Random Tree, Random Forest, Rule Induction and Linear Regression. The Characteristics of feature selection algorithms are that they select the best features on the basis of attributes weights.
Table 1. WPBC Dataset Description
Attribute Name Attribute ID
Patient id A1
Outcome B1
TTR C1
RADIUS1 D1
TEXTURE1 E1
PERIMETER1 F1
AREA1 G1
SMOOTHNESS1 H1
COMPACTNESS1 I1
CONCAVITY1 J1
CONCAVEPOINTS1 K1
SYMMETRY1 L1
FRACTALDIMENSION1 M1
RADIUS2 N1
TEXTURE2 O1
PERIMETER2 P1
AREA2 Q1
SMOOTHNESS2 R1
COMPACTNESS2 S1
CONCAVITY2 T1
CONCAVEPOINTS2 U1
SYMMETRY2 V1
FRACTALDIMENSION2 W1
RADIUS3 X1
TEXTURE3 Y1
PERIMETER3 Z1
AREA3 AA1
SMOOTHNESS3 AB1
COMPACTNESS3 AC1
CONCAVITY3 AD1
CONCAVEPOINTS3 AE1
SYMMETRY3 AF1
FRACTALDIMENSION3 AG1
TUMOUR AH1
Lymph node AI1
2.1
Feature Selection Algorithms
The genetic algorithms for optimization i.e. feature selection and generation on WPBC dataset are discussed below.
2.1.1
Generating Genetic Algorithm (GGA)
GGA Algorithm is used for feature selection and generation on WPBC data set. The GGA produces new attributes due to which length of each individual changes and therefore used unique mutation and crossover operators. Boolean parameters are used with generator list to select randomly generators. As there is no algorithm for operator so in example set it is restricted to single attribute for extraction of features from value series. For automatic feature selection Ingo Mierswa written value series is used.
This algorithm takes the data set which is to be classified as an input example set in (exa) i.e. the dataset from which we want to generate and select features. In the output we have three parameters i.e. exa, att and per. Exa is used for the output of exa set in, att is used to find the weight of the attributes and per is used for performance i.e. accuracy of the data.
2.1.2
Another Genetic Algorithm (AGA)
AGA is the improved version of genetic algorithm for feature selection and generation (GGA). It use same operator as GGA but this algorithm adds additional generators and some basic intron prevention techniques are used to enhance basic GGA. This operator gives prominent result as the previous one but generally lower as contrast to YAGGA2.
2.1.3
Yet another Generating Genetic Algorithm
(YAGGA)
Another genetic generating algorithm (YAGGA) in which the length of the individual not changed unless the longer or shorter ones of them prove to be better in fitness. This algorithm is different from the above the two approaches used by generating new attributes with different probabilities for generating mutation does the following things.
New generated attributes are added to the feature vector
Randomly selected original attributes are added to the feature vector
Randomly selected attributes are removed fromfeature vector
From this it reflects that feature vectors length will grow and diminish. On mediocre the original length will remain, until shorter or longer individual’s exhibit to be better fitted.
2.1.4
Yet another Generating Genetic Algorithm
(YAGGA2)
This algorithm is same as YAGGA algorithm but improved version of feature selection and generation. This feature selection and generation algorithm grants more option for generating of features and render considerable techniques for the prevention of intron. This in turn results in to the less example sets and reduction of features.
3.
Classification Algorithms
The algorithm which showed noticeable improvement in the results is discussed here.
3.1
Naïve Bayes
Here Laplace correction is used to minimize the high influence of zero probabilities. It returns the classification model using estimated normal distributions.
Bayesian Rule
)
(
)
(
)
(
)
(
N
P
M
P
M
|
N
P
N
|
M
P
Evidence
Prior
Likelihood
Posterior
3.2
Logistic Regression
Logistic regression in rapid miner take input as an example set and return Boolean as an output. The default value for the output is false. Here an add intercept is used which determines whether to include an intercept and also the performance model to determine their performance. The population is start and stop after that much evaluation i.e. (integer; 1-+1; default: 10000), if no improvement is found then generation is stopped.
In logistic Regression keep example set: Shows that input object should acknowledged improvement (-1: optimize until
max iterations). (Integer; -1-+1 default: 300). The other parameters that are used are given as mutation, selection, crossover, and local random seed, apply count, loop time and time.
4.
EXPERIMENTAL RESULTS
[image:4.595.49.558.352.472.2]The data was first trained and tested using the classification algorithms to find their accuracy and to classify them in to recurrent/nonreccurent. After this feature selection and generation algorithms were used with classification algorithms to select best features to reduce the dimensionality of the data keeping accuracy in to account. The features selected by feature selecting algorithm for classification algorithms are given in table 2 and table 3 respectively. The table 2 has the features set for the Naïve Bayes classifier. The table contains four feature selection and generation algorithm used in this study. Each feature selection classifiers has selected different number of attribute values according to the weights of the attribute. As seen from the table that the feature selection algorithms has selected the best features. For Naïve Bayes the best features selected are as low as 3 features.
Table 2. Feature set on WPBC dataset for Naïve Bayes Classifier w.r.t Table 1
S.No Feature Selection Algorithm Attribute Ids of Feature Selected By Feature Selection Algorithms
1 GGA M1, Z1 ,AB1
2 AGA C1,H1,O1
3 YAGGA M1 ,V1,X1,Y1
4 YAGGA2 C1, K1,O1 ,U1,Y1
The Table 3 has the data for the Logistic regression classification algorithm. The same four feature selection and generation algorithms are used on this classifier as was done
[image:4.595.51.551.548.669.2]for Naïve Bayes. The feature selection algorithms has selected the features whose number is relatively high than that for the Naïve Bayes algorithm.
Table 3. Feature set on WPBC dataset for Logistic Regression Classifier w.r.t table 1
S.No Feature Selection Algorithm Attribute Ids of Feature Selected By Feature Selection Algorithms
1 GGA C1, E1,AB1,T1,AF1,Z1
2 AGA C1,T1,AD1,AI1,M1,O1,G1,Z1
3 YAGGA C1,U1,D1,X1,AB1,AC1,AD1,AF1,AH1,J1,K1,M1,O1
4 YAGGA2 C1,F1,U1,AB1,AC1,D1,S1,Z1,AF1,Y1
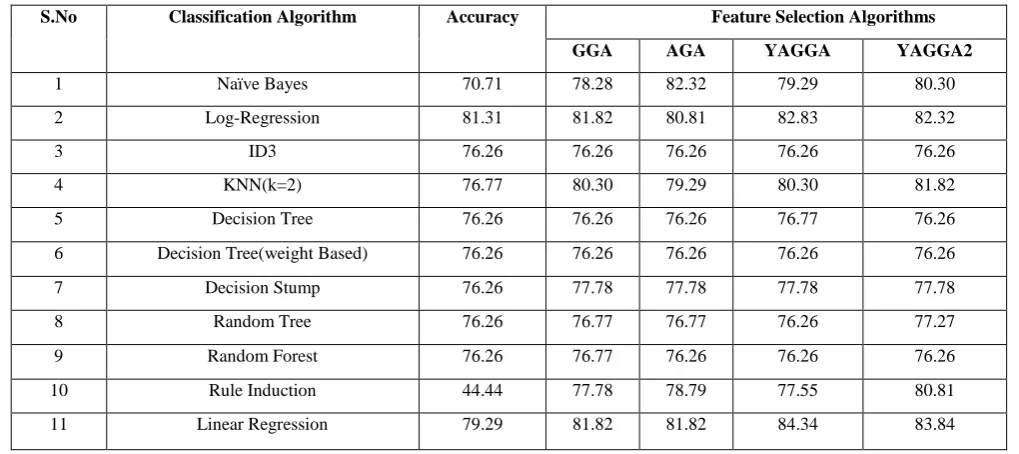
The Table 4 has the data for the 11 classifiers used in this study. This shows us the accuracies of the classifiers being used before and after the feature selection algorithm applied. The feature selection algorithms selected were GGA, AGA, YAGGA and YAGGA2. This can be noted from this table that the accuracy for some of the classifiers is lower than the original research data but this is only because of the four
Table 4. Classification Results with Feature Selection Algorithms
S.No Classification Algorithm Accuracy Feature Selection Algorithms
GGA AGA YAGGA YAGGA2
1 Naïve Bayes 70.71 78.28 82.32 79.29 80.30
2 Log-Regression 81.31 81.82 80.81 82.83 82.32
3 ID3 76.26 76.26 76.26 76.26 76.26
4 KNN(k=2) 76.77 80.30 79.29 80.30 81.82
5 Decision Tree 76.26 76.26 76.26 76.77 76.26
6 Decision Tree(weight Based) 76.26 76.26 76.26 76.26 76.26
7 Decision Stump 76.26 77.78 77.78 77.78 77.78
8 Random Tree 76.26 76.77 76.77 76.26 77.27
9 Random Forest 76.26 76.77 76.26 76.26 76.26
10 Rule Induction 44.44 77.78 78.79 77.55 80.81
11 Linear Regression 79.29 81.82 81.82 84.34 83.84
5.
ANALYSIS AND CONCLUSION
Eleven different classifiers were used. Many of these had been used in previous studies with different feature selection algorithms. All the classifiers tested for the required data for the classification and regression algorithm are in the above Table 4. All the accuracies are stated. Put in end some of the classifier used in the earlier studies showed different accuracies from that of this research. This could be because of the 4 unknown attribute values that were estimated using the neighboring values. However the accuracy improvement percentage was better than that of the earlier study. KNN showed this problem and its accuracy improvement percentage was more than that of the earlier study. Some of the classifiers showed improved accuracy which is because of the fact that the feature selection techniques used were changed from that of the earlier paper followed. The improvement in the accuracy ranged up to 12 % which is noteworthy.
If the features are selected to be less than the total features selected then the classification is done with more accuracy and better results.
The feature selector and generation algorithms used are YAGA, AGA, YAGAA2 and GGA. These feature selection techniques improved the feature selection by selection of the better features and they resulted in improvement in the overall accuracy of the classification.
This research was carried out for feature reduction in the dimensionality reduction. Further on in future the results could be further improved by selecting other dimensionality reduction areas such as time constraint
6.
SUMMARY
Dataset from Wisconsin Breast Cancer was taken with 198 instances. This dataset had both recurrent and non-recurrent cancer types. Eleven classifiers and four feature selection algorithms were used. The feature selection algorithms were selected to be different from earlier studies to improve the accuracy of the classification. Noticeable improvement was seen in many classifiers which gave a good base for further
research in the field. Furthermore, out of these classifiers like Rule induction, Random forest, Linear Regression, Random forest and Decision Stump takes lot of time in training of data then the other classifiers which takes less time in training and testing of the data.
7.
REFERENCES
[1] Shomona Gracia Jacob and R.Geetha Ramani.2012 “Efficient Classifier for Classification of Prognostic Breast Cancer Data through Data Mining Techniques” [2] J.D.Malley, J.Kruppa, A.Dasgupta, K.G.Malley and
A.Ziegler. 2012 Probability Machines; Consistent Probability Estimation Using Non Parametric Learning Machines, Methods Inf Med. 2012; 51:74–81. doi: 10.3414/ME00-01-0052,2012.
[3] William H. Wolberg, Olvi Mangasarian, UCI Machine Learning Repository [http://archive.ics.uci.edu/ml]. Irvine, CA.
[4] Abraham Karplus.2012 “Machine Learning Algorithms for Cancer Diagnosis, Santa Cruz County Science Fair”.
[5] Wisconsin-Madison prognostic Breast cancer
Repositoryftp:ftp.cs.wisc.edu/math-prog/cpo-dataset/machine-learn/cancer/WPBC/WPBC.dat [6] W.H. Wolberg, W.N. Street, D.M. Heisey, and O.L.
Mangasarian.1995 “Computerized breast cancer Diagnosis and prognosis from fine needle aspirates”. Archives of Surgery 1995; 130:511-516
[7] Mierswa, Ingo and Wurst, Michael and Klinkenberg, Ralf and Scholz, Martin and Euler, Timm: YALE: Rapid Prototyping for Complex Data Mining Tasks, in Proceedings of the 12th ACM SIGKDD International Conference on Knowledge Discovery and Data Mining (KDD-06), 2006.
[9] Gouda I. Salama1, M.B.Abdelhalim2, and Magdy Abd-elghanyZeid3.2012 “Breast Cancer Diagnosis on Three Different Datasets Using Multi-Classifiers” International Journal of Computer and Information Technology (2277 – 0764) Volume 01– Issue 01, September 2012
[10] William H. Wolberg, W. Nick Street, Dennis M. Heisey and Olvi L. Mangasarian.1995 “Computer-Derived Nuclear Features Distinguish Malignant from Benign Breast Cytology” volume 26, No 7.
[11] D.Lavanya, Dr.K.Usha Rani.2011 “ANALYSIS OF FEATURE SELECTION WITH CLASSFICATION: BREAST CANCER DATASETS” ISSN: 0976-5166 Vol. 2 No. 5 Oct-Nov 2011
[12] W.H. Wolberg, W.N. Street, and O.L. Mangasarian, Image analysis and machine learning applied to Breast cancer diagnosis and prognosis, Analytical and Quantitative Cytology and Histology, Vol. 17, No. 2, pages 77-87, April 1995.
[13] W.H. Wolberg, W.N. Street, D.M. Heisey, and O.L. Mangasarian.1995 “Computer-derived nuclear ``grade'' and breast cancer prognosis, Analytical and Quantitative Cytology and Histology”, Vol. 17, Pages 257-264, 1995.