Improving Classification Accuracy based on Random
Forest Model with Uncorrelated High Performing Trees
S. Bharathidason
Department of Computer Science Loyola College, Chennai -34
C. Jothi Venkataeswaran,
Ph.D Department of Computer Science Presidency College, Chennai -05ABSTRACT
Random forest can achieve high classification performance through a classification ensemble with a set of decision trees that grow using randomly selected subspaces of data. The performance of an ensemble learner is highly dependent on the accuracy of each component learner and the diversity among these components. In random forest, randomization would cause occurrence of bad trees and may include correlated trees. This leads to inappropriate and poor ensemble classification decision. In this paper an attempt has been made to improve the performance of the model by including only uncorrelated high performing trees in a random forest. Experimental results have shown that, the random forest can be further enhanced in terms of the classification accuracy.
General Terms
Random forest, Classification Accuracy, Uncorrelated trees.
Keywords
Strength, Correlation, Tree Performance, Decision trees.
1.
INTRODUCTION
Random forest (RF) methodology is a machine learning technique useful for prediction problems. The RF algorithm, developed by Leo Breiman [1], applies bootstrap aggregation (bagging) [2] and random feature selection [3, 4] to individual classification or regression trees for prediction. There are many studies showing that RFs have impressive predictive performance in regression and classification problems in various fields, including financial forecasting, remote sensing, and genetic and biomedical analysis [5 -13]. Random Forest classifiers [1] attract increasing attention within the computer vision community. Variants like Random Ferns [14] and extremely randomized trees [15] are also well known. The research work in the area of random forest aims at either improving accuracy, or reducing time required for learning and classification or both. This research work aims to improve the accuracy of random forest.
Random forest is now known to be one of the most efficient classification methods [16 -18]. However, owing to the complexity of data distribution in high dimensional future space, a random forest may include bad tree classifiers which can result in wrong classification results. The vote of all the trees to make an ensemble classification decision, it will make a wrong decision when there are a large proportion of bad trees included in random forest. To make optimization in the random forest deduct and exclude bad trees so as to reduce their negative effects on the performance of the random forest [19].
In random forest, randomization would cause occurrence of correlated trees which may affect the performance of random
forest. By minimizing the correlation among these trees, the classification accuracy of the random forest can be improved. This paper aims to optimize, large number of decision trees in a random forest through the selection of only uncorrelated and good trees with high classification accuracies.
2.
RANDOM FOREST ALGORITHM
Random forest is an ensemble classification method by voting the result of individual decision trees. In the past decade, various methods have been proposed to grow a random forest [1, 3, 19 & 20]. Among these methods, Breiman’s method [1] has gained increasing popularity because it has higher performance against other methods [21].
Let D be a training dataset in an M-dimensional space X, and let Y be the class feature with total number of c distinct classes. The method for building a random forest [1] follows the process including three steps:
Step 1: Training data sampling: use the bagging method to generate K subsets of training data {D1, D2, ..., DK} by randomly sampling D with replacement;
Step 2: Feature subspace sampling and tree classifier building: for each training dataset Di (1≤ i ≤ K), use a decision tree algorithm to grow a tree. At each node, randomly sample a subspace Xi of F features (F << M), compute all splits in subspace Xi, and select the best split as the splitting feature to generate a child node. Repeat this process until the stopping criteria is met, and a tree hi(Di, Xi) built by training data Di under subspace Xi is thus obtained;
Step 3: Decision aggregation: ensemble the K trees {h1(D1, X1), h2(D2, X2), ... , hK(DK, XK)} to form a random forest and use the majority vote of these trees to make an ensemble classification decision.
The algorithm has two key parameters, i.e., the number of K trees to form a random forest and the number of F randomly sampled features for building a decision tree. According to Breiman [1], parameter K is set to 100 and parameter F is computed by F= [ log2 M + 1]. For large and high dimensional data, a large K and F should be used.
3.
HIGHLY UNCORRELATED TOP
PERFORMING TREES
3.1
Tree Importance and Correlation
Evaluation
27 the accuracy of each component learner; the other is the
diversity among these components.
This paper is concerned with both accuracy and diversity factors among trees. First, evaluate the accuracy of individual trees with AUC accuracy as a measure of the importance of a tree. Then select good trees based on AUC high accuracies from a large number of trees. The selected good trees are clustered based on the correlation among the trees. As a result of clustering each cluster contains similar or highly correlated group of trees. The intra cluster similarities among the trees are high and the inter cluster similarities among the trees are low. From each cluster select a high performing tree which results in uncorrelated high performing group of trees. Thus the uncorrelated high performing trees are obtained, finally ensemble these uncorrelated good trees to form a Random forest with high classification performance.
3.2
High Performing and Uncorrelated
High Performing Trees
High performing trees are those having high AUC accuracy in a random forest. Individual trees will fall in this high performing group when they have high AUC accuracy. Depending on the dataset the AUC cut point to determine the high performing trees may vary. Based on the AUC cut point the high performing trees i.e. a number of P trees are selected from the random forest.
Uncorrelated high performing trees are those having high AUC accuracy and also having less correlation among them in a random forest. The correlations among the high performing trees are measured, based on which the uncorrelated high performing trees i.e. a number of Q trees are selected from the random forest. Individual trees will fall in this group when they perform high and having less correlation among them.
3.3
Enhanced Random Forest (ERF)
Algorithm
The sample dataset D in M-dimensional feature space X, and a number of P good trees are selected from a random forest, from these P trees the number of Q uncorrelated good trees are selected. The method to build an enhanced random forest from X with Q uncorrelated high performing trees follows the following five steps.
Step 1: Data sampling: use bagging method to generate K in-of-bag data subsets {IOB1, IOB2, ..., IOBK }, by randomly sampling D with replacement;
Step 2: Tree classifier building: use each in-of-bag data subset IOBi to build a tree and then give the evaluation value to the tree. Continue this step until all trees are generated and processed;
Step3: Tree ordering: sort all these K trees in their AUC descending order;
Step 4: Selection of high performing trees: select the top P trees with high AUC values.
Step 5: Enhanced random forest building: The correlations between the predicted probabilities of these P trees are observed.
ρ =
1
...
:
:
:
:
:
:
:
:
:
:
:
:
...
1
...
1
...
1
) 4 , ( 13 , ( ) 2 , ( ) 1 , ( ) , 3 ( ) 4 , 3 ( ) 2 , 3 ( ) 1 , 3 ( ) , 2 ( ) 4 , 2 ( ) 3 , 2 ( ) 1 , 2 ( ) , 1 ( ) 4 , 1 ( ) 3 , 1 ( ) 2 , 1 ( p p p p p p p
The observed ρ is used as input in the variable clustering procedure and Q correlated clusters of trees are obtained. In each cluster sort the trees in their AUC descending order. Select a tree from each cluster with high AUC values which gives Q uncorrelated high performing trees and ensemble these trees into an enhanced random forest. Use the majority vote of these trees to make an ensemble classification decision.
The pictorial representation of enhanced random forest building is shown in Fig1.
The enhanced random forest method has two more key parameters, i.e., the number of P top performing trees from which Q uncorrelated high performing trees are selected to form an enhanced random forest.
4.
DATA SOURCE
The heart disease dataset are collected from one of the leading diabetic research institute in Chennai, India. The clinical data set specification provides concise, unambiguous definition for items related to diabetes. Data on the Risk factors were collected from 6073 diabetic subjects of MV Diabetics Lab., Chennai, laying emphasis on the 267 subjects of heart disease.
Detailed information of the bank marketing UCI datasets can be available in the UCI Machine Learning Repository[23 & 24]. Telecom Churn datasets are collected from one of the leading telecom company in India. The credit risk assessment dataset information is also collected [25].
5.
RESULTS
A series of experiments were conducted on four datasets such as, heart disease dataset, bank marketing dataset, telecom churn dataset and credit risk assessment dataset. All datasets are high dimensional. In each dataset, it is concluded that the proposed enhanced random forest (ERF) performs consistently better than the conventional random forest (RF). The area under the ROC curve (AUC) is used as a metric to evaluate the performance of the algorithms.
Fig 1: Enhanced Random Forest Building (ERF)
5.1. Performance Analysis
The proposed enhanced random forest method is compared with Breiman’s method, the average accuracy of 10 results were computed by performing 10 rounds of experiments on each dataset. In each round k number of trees are build, from which P good trees are selected with high AUC accuracy and in turn Q uncorrelated top performing trees with high AUC value are extracted (ranging from 10 to 100 trees with increments 10) to form an Enhanced Random Forest
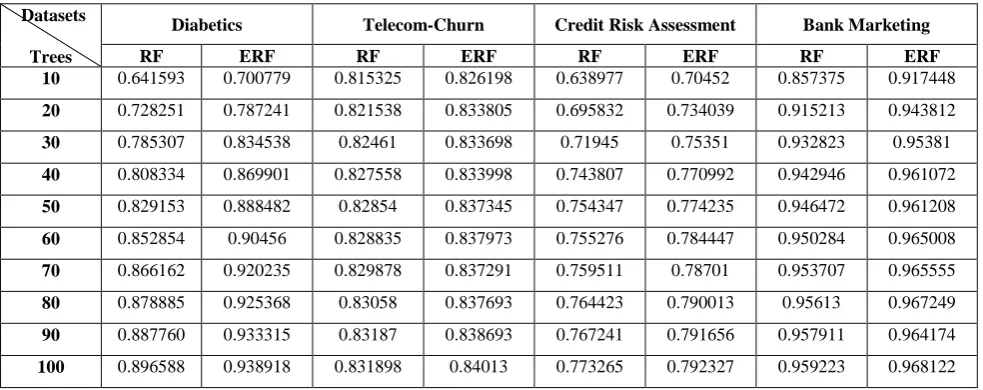
(Preferably we select K, P and Q in the ratio3:2:1respectively). The random forest is also build by Breiman’s method by selecting all trees in the forest. The average accuracy of different random forest consisting different number of trees generated by the enhanced random forest method (corresponding to column ERF) and Breiman’s method from four datasets are shown in Table1. The proposed method achieves high classification accuracy on the four datasets.
Table 1: Comparison of Prediction accuracy between Random Forest (RF) and Enhanced Random Forest (ERF)
Datasets
Trees
Diabetics Telecom-Churn Credit Risk Assessment Bank Marketing
RF ERF RF ERF RF ERF RF ERF
10 0.641593 0.700779 0.815325 0.826198 0.638977 0.70452 0.857375 0.917448
20 0.728251 0.787241 0.821538 0.833805 0.695832 0.734039 0.915213 0.943812
30 0.785307 0.834538 0.82461 0.833698 0.71945 0.75351 0.932823 0.95381
40 0.808334 0.869901 0.827558 0.833998 0.743807 0.770992 0.942946 0.961072
50 0.829153 0.888482 0.82854 0.837345 0.754347 0.774235 0.946472 0.961208
60 0.852854 0.90456 0.828835 0.837973 0.755276 0.784447 0.950284 0.965008
70 0.866162 0.920235 0.829878 0.837291 0.759511 0.78701 0.953707 0.965555
80 0.878885 0.925368 0.83058 0.837693 0.764423 0.790013 0.95613 0.967249
90 0.887760 0.933315 0.83187 0.838693 0.767241 0.791656 0.957911 0.964174
[image:3.595.53.545.567.762.2]29
5.2. Accuracy Improvement
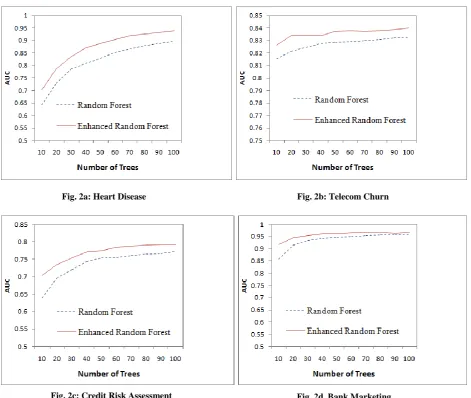
The preceding section has shown that the enhanced random forest outperforms the original random forest. The accuracy of random forest is improved by maximizing the individual tree strength and minimizing the correlation among the trees in the forest. In the above mentioned four datasets, the accuracy improvement ranging from 1% to 6% has achieved with enhanced random forest than the original random forest.
Based on the complexity pattern of the dataset the percentage of accuracy improvement may vary. The proposed enhanced random forest method achieves high classification accuracy on the four datasets is shown in Fig.2. The dotted blue curves represent the accuracy obtained with random forest and the red curves represent the accuracy obtained with enhanced random forest.
Fig. 2a: Heart Disease Fig. 2b: Telecom Churn
[image:4.595.64.536.175.573.2]
Fig. 2c: Credit Risk Assessment Fig. 2d. Bank Marketing
Fig 2: Comparison of Prediction accuracy between Random Forest (RF) and Enhanced Random Forest (ERF)
6.
CONCLUSION
This paper presents an evaluation method to assess the importance and correlation of individual trees, and proposed an enhanced random forest algorithm incorporating a tree selection step based on the calculated tree importance and correlation. This work aims to improve the classification accuracy of random forest with the properties of strength and correlation. Experimental results on various datasets have shown that the classification accuracy is improved when a random forest is composed of good and uncorrelated trees with high classification accuracies, while neglecting correlated and bad trees with low accuracies.
7.
ACKNOWLEDGMENTS
We are grateful to Prof. Syluvai Antony, Assistant Professor, Dept. of Statistics, Loyola College and Dr. M. Raja, Assistant Professor, Dept. of Advanced Zoology and Biotechnology, Loyola College, Chennai for their constant support and valuable suggestions to complete this research work.
8.
REFERENCES
[1] Breiman, L. 2001. Random Forests. Machine Learning, Vol. 45 Issue 1, pp. 5-32.
[3] Ho, T. 1998. The random subspace method for constructing decision forests. IEEE Transactions on Pattern Analysis and Machine Intelligence, Vol.20 Issue 8, pp. 832–844.
[4] Amit, Y. and Geman, D. 1997. Shape quantization and recognition with randomized trees. Neural Computation, Vol.9, Issue 7, pp. 1545–1588.
[5] Goldstein, B., Polley, E., and Briggs, F. 2011. Random forests for genetic association studies. Statistical Applications in Genetics and Molecular Biology, Vol.10, Issue 1, pp. 1–34.
[6] Siroky, D. 2009. Navigating random forests and related advances in algorithmic modeling. Statistics Surveys, 3:147–163.
[7] Jiang, P., Wu, H., Wang, W., Ma, W., Sun, X., and Lu, Z. 2007. Mipred: classification of real and pseudo microrna precursors using random forest prediction model with combined features. Nucleic Acids Research, Vol.35, Issue 2. pp. 339–344.
[8] Palmer, D., O’Boyle, N., Glen, R., and Mitchell, J. 2007. Random forest models to predict aqueous solubility. J Chem Inf Model, Vol.47, Issue 1, pp. 150–158.
[9] Kumar, M. and Thenmozhi, M. 2006. Forecasting stock index movement: A comparison of support vector machines and random forest. Indian Institute of Capital Markets 9th Capital Markets Conference.
[10] Diaz-Uriarte, R. and de AndršŠs, S. A. 2006. Gene selection and classification of microarray data using random forest. BMC Bioinformatics, Vol. 7, pp. 3–15. [11] Ward, M., Pajevic, S., Dreyfuss, J., and Malley, J. 2006.
Short-term prediction of mortality in patients with systemic lupus erythematosus: Classification of outcomes using random forests. Arthritis and Rheumatism, Vol.55, pp. 74–80.
[12] Shi, T., Seligson, D., Belldegrun, A., Palotie, A., and Horvath, S. 2005. Tumor classification by tissue microarray profiling: Random forest clustering applied to renal cell carcinoma. Modern Pathology, Vol.18, Issue 4, pp. 547–557.
[13] Pal, M. 2003. Random forest classifier for remote sensing classification. International Journal of Remote Sensing, Vol.26, Issue 1, pp. 217–222.
[14] Ozuysal, M., P. Fua, and V. Lepetit. 2007. Fast key point recognition in ten lines of code. In Proc. CVPR,. pp. 1377–1379.
[15] Geurts, P., D. Ernst, and L.Wehenkel. 2006. Extremely randomized trees. Machine Learning, Vol.36, Issue 1, pp. 3–42.
[16] Bernard, S., Heutte, L., Adam, S. 2009. On the selection of decision trees in random forests. International Joint Conference on Neural Network , pp. 302–307.
[17] Banfield, R., Hall, L., Bowyer, K., Kegelmeyer,W. 2006. A comparison of decision tree ensemble creation techniques. IEEE Transactions on Pattern Analysis and Machine Intelligence, Vol. 29, Issue 1, pp.173–180. [18] Boinee, P., Angelis, A.D., Foresti, G. 2005. Ensembling
classifiers - an application to image data classification from cherenkov telescope experiment. World Academy of Science, Engineering and Technology, Vol.12, pp. 66– 70.
[19] Baoxun Xu, Junjie Li, Qiang Wang, Xiaojun Chen, 2012. A Tree Selection Model for Improved Random Forest, Bulletin of advanced technology research, Vol. 6 No.2 Apr. 2012.
[20] Dietterich, T.G. 2000. “An Experimental Comparison of Three Methods for Constructing Ensembles of Decision Trees: Bagging, Boosting, and Randomization,” Machine Learning, Vol.40, Issue 2, pp. 139–157.
[21] Banfield, R.E., L.O. Hall, K.W. Bowyer and W.P. Kegelmeyer, 2007. A Comparison of Decision Tree Ensemble Creation Techniques, IEEE Transactions on Pattern Analysis and Machine Intelligence, Vol.29, Issue 1, pp. 173–180.
[22] Dietterich, T.G. 1997. “Machine learning research: For current directions,” AI Magazine, Vol. 18, Issue 4, pp. 97–136.
[23] Moro, S., R. Laureano and P. Cortez. Using Data Mining for Bank Direct Marketing: An Application of the CRISP-DM Methodology.
[24] Novais, P., et al. 2011. Proceedings of the European Simulation and Modelling Conference (Eds) - ESM'2011, Guimarães, Portugal, October, 2011. EUROSIS. Available: http://hdl.handle.net/1822/14838. pp. 117–121.