A Comparative Analysis of Different Classification
Techniques for Intrusion Detection System
Neha Maharaj
M.Tech Research scholar Amity University, Lucknow
Pooja Khanna
Lecturer, dept of CS&E Amity University, Lucknow
ABSTRACT
Intrusion Detection Systems are the network security mechanism that monitors network and system activities for malicious actions. It becomes indispensable tool to keep information system safe and reliable. The primary goal of intrusion detection is to model usual application behaviour, so that we can recognize attacks by their peculiar effects without raising too many false alarms. In this work data mining techniques are used for intrusion detection to identify normal and malicious actions on the system. The whole work considered Intrusion detection as a data analysis process. The Weka tool is used for analysis on KDD Cup [1] dataset. Algorithm REPTree & VFI(Voting Feature Interval) are chosen in this work with full training set and percentage split in which dataset can be divided into two ratio, and then one part is used as training set and the other part is applied as test set. The ROC curve is implemented for the comparison of classification algorithms.
General Terms
Intrusion detection, data mining, KDD cup dataset
Keywords
Classification technique, Receiver operating characteristic (ROC) curves, AUC
1. INTRODUCTION
With the extensive growth of Computer networks usage and the huge increase in the number of applications running on it, makes network security very essential today. Almost each and every computer system is suffering from security vulnerabilities which are both technically tougher and economically expensive to be solved by the manufacturers. Therefore, the task of Intrusion Detection Systems (IDSs), as special-purpose devices to detect anomalies and attacks in the network, is becoming very important. Intrusion detection is a process of gathering intrusion related information occurring in the process of monitoring the events and inspecting them for sign of malicious acts. For this information gathering, data mining could be used. Intrusion detection system using data mining has induced more interests in recent years.
1.1
Intrusion Detection
The detection type of the intrusion detection system can be signature based detection, in which the traffic is detected with the help of known patterns or signatures of attack. It works as antivirus does, in which known pattern is detected & it need time to time update of the database with new pattern of attacks. This detection type has the inability to detect unknown attack so it is unable to detect numerous recent attacks.
Figure 1- Logic in Intrusion Detection
The detection type is Anomaly based detection in which detection is based on the heuristics & rules rather than pattern and signatures. It categorized data as normal or anomalous. It is used to find out any kind of misuse that falls out of normal act. So that it is able to identify unknown attacks.
The idea of detecting misuse and anomaly based attack is shown in the figure -1[9]. To detect anomaly based attack training of the machine is to analyse the normal behaviour profile, can be able to identify the abnormal or intrusion behaviour profile & be able to catch the malicious traffic to get the anomaly attack.
The variation can be treated as the baselines of estimating the anomalous activities from normal behaviour. To do this task classification technique of data mining is used in this paper. To distinguish the normal and anomalous traffic in the network.
1.2 Data Mining
Basically, data mining is the process of analyzing data from different perspective and abstracting it into useful information. Data mining software is an analytical tool that is used for analyzing data. It empowers users to analyze data from many Profile
Measurement Subject Activity
Intrusion Behaviour Normal Behaviour
Pattern Rules/Heuristics Anomaly behaviour
pattern/signature
Normal behaviour pattern
Intrusion Profile (Signature library)
Normal Usage Profile
23 different perspective or dimensions, summarize and categorize
the relationships that are found in the data.
1.3 Classification
Classification algorithms in data mining are predominantly used in Intrusion Detection System to classify attacks or intrusions from normal things occur in networks. Classification algorithms are supervised learning approach, it does not require class labels for the prediction purpose. Classification techniques are principally fall into two categories, one is binary classification and other one is multiclass classification. Binary classification technique classifies the element of a given set into two groups on the basis of whether they have some characteristic or not, while multiclass classification technique classifies instances into more than two classes. Some classification algorithms inherently permit the use of more than two classes; others are by nature binary algorithms. REPtree and VFI algorithm falls into multiclass classification.
Classification models are being tested here by comparing the predicted values to the known target values in a set of test data.
2. RELATED WORK
Many researchers have been proposed various methods and algorithms for intrusion detection based on data mining classification techniques.
Lei Li et. al. [2], present a rule-based algorithm, It uses the known patterns to detect the malicious behaviour attacks. By adding length decreasing support, it reduces the generation of a short pattern effectively and avoids ignoring the item sets with low support which is interesting in the event. This algorithm has lower consumption of time and lower false alarm rate on the detection rate.
Desheng Fu et. al. [3], Discuss the application of data mining in the intrusion detection system. It is an important direction in IDS research. The paper presents the improved association analysis algorithm based on FP-Growth and FCM (Fuzzy C Means) network intrusion detection technologies based on statistical binning, with the application of which in the NIDS, the rate of mining speed is increased, the detection performance of IDS become stronger, and a more solid foundation for network maintenance and support is provided to the system administrators.
Chai Wenguang et. al. [4], Authors put in an intelligent intrusion detection system based on web data mining, which is, compared to other traditional intrusion detection systems. But for a complete detection system, there is still a lot of work to be done, e.g., improving data mining algorithms; most effective processing the relationship between data mining module and other modules; improving the system's adaptive capacity; achieving the visualization of test results; improving real time efficiency and accuracy of the system.
G.V. Nadiammai et. al. [5], proposed the algorithm and various mining algorithm are tested on the KDD cup dataset and compared with the proposed EDADT algorithm and showed the better accuracy and reduced false alarm rate
.
M. Moorthy et. al. [6], explores the characteristics of intrusion detection based on data mining. Author also present survey of some data mining techniques such as Machine learning, Feature selection, Inductive rule generation, Neural network, Fuzzy logic, Hidden markov model, Genetic algorithm,Support vector machine, Statistical techniques and Immunological based techniques
M. Panda et. al. [7], study performance of three well known data mining classifier algorithms namely, ID3, J48 and Naïve Bayes are evaluated based on the 10-fold cross validation test by using the KDD CUP 99 data set
Most of work until done in intrusion detection based on binary classification. If attacks or intruders classified only into two, we have only information about whether it is attack or not any kind of attack. But, if it can be categorized as more than two classes than we are able to find out the type of the attack. After that the detector can take action accordingly.
3. DESCRIPTION OF DATASET & TOOL
INFORMATION
The corrected KDD cup dataset is used for the analysis here. The KDD99 data is originally from 1998 DARPA Intrusion Detection Evaluation. Under the sponsorship of Defence Advanced Research Projects Agency (DARPA) and Air Force Research Laboratory (AFRL), MIT Lincoln Labs have collected and distributed the datasets for the evaluation of computer network intrusion detection system [10].
Each connection record has 41 attributes and 1 class attribute. The class attribute labels each record as normal or attack with specific attack type.
The dataset has 19.48% normal and 80.52% attack connections. It is consisted of 311,030 records, among which 60, 593 (19.48%) were 'normal', 229,853 (73.90%) DOS, 4,167 (1.34%) Probe, 16,347 (5.26%) R2L and 70 (0.02%) U2R attacks.
The occurrence of the instance is shown in table 1 Table 1- Division of instance types in corrected KDD
dataset
Class Number of
instances
% of
occurrence
Normal 60,593 19.48
Dos 2,29,853 73.90
Probe 4,167 1.34
U2R 70 0.02
R2L 16,347 5.26
Total 3,11,030 100
The simulated attacks fall into one of the following categories-
DOS (Denial of service) attack- In this category of attack, the intruders attempt to make network resource or machine unavailable for the legitimate user to use its services. The DOS attacks are- apache, back, land, mailbomb, Neptune, pod, processtable, smurf, teardrop, and udpstorm.
Probe attack- In the probe attack intruders are intended for acquiring the information about the target network resource or machine from a source that is usually external to the network. This information which may contain vulnerabilities and weaknesses of the system later used to exploit so as to compromise the system. Probe attacks are- ipsweep, mscan, nmap, portsweep, saint, Satan.
are- buffer_overflow, loadmodule, perl, rootkit, ps, sqlattack, xterm.
R2L (root to local) attack- This kind of attacks are most difficult to detect as they implicate the host level and network level features. These attacks are not directly visible unless the payload of the packet is inspected because this attack is application specific. An attacker does not have a legitimate account on the victim machine, hence exploits some vulnerability to gain local access as a user of that machine. The R2L attacks can be ftp_write, guess_pswd, imap, multihop, named, phf, sendmail, snmpgetattack, snmpguess, warezmaster, worm, xlock, xsnoop, httptunnel.
The features of the KDD dataset fall in four categories- The intrinsic features- this is the basic feature which is
derived from the packet headers, e.g. duration of the connection, type of protocol (tcp, udp etc.), network services (http, telnet ) etc.
The content feature- To assess the payload of the original TCP packets domain knowledge is used. The content features are like number of failed login attempts.
The same host features- Explore established connections in the past 2 seconds that have the same destination host as the current connection & calculate statistics related to the protocol behavior, services etc.
The similar same service features- Explore established connection in the past 2 seconds that have the same service as the current connection.
Analysis is performed on weka 3.6.9 data mining tool. Waikato Environment for Knowledge Analysis (WEKA), which is an open source Java package of machine learning algorithms for data mining tasks. This data mining tool provides unified benchmark for researchers for analysis. Along with that, this tool provides a better user interface for users to create appropriate workflow schema according to our requirements.
This tool is installed on the 64 bit operating system having Intel core duo 2.20GHz processor with 4 GB of RAM.
4. ROC CURVE
Receiver operating characteristic (ROC) curve is used to analyse the quality of the classifier or other automated system. The AUC Area under the ROC Curve is the measure of efficiency for the classifier in the mining task. ROC curve illustrates the performance of the binary classifier system. Multiclass classification problem treats binary classifier as one versus all and calculate the operating point for each class, the take out result by calculating the average of all.
Classifier gives the result as true positive (TP) and the true negative (TN) if the outcome lies under the false positive (FP) means classifier indicates the attack in progress but actually no attack is taking place & false negative (FN) it means that classifier indicates that no malicious action is going on while there is actually an attempt of intrusion is taking place. So that the result is overlapping and not accurate whether positive or negative. To deal with this overlapping outcome ROC curves are used. The truth table for classifiers intrusion assertion is shown in the table 2
TP- Classifying an intrusion as an intrusion
FP- Incorrectly classifying normal data as an intrusion. TN- Correctly classifying normal data as normal. FN- Incorrectly classifying an intrusion as normal.
TPR (True positive rate) =
FPR (False Positive Rate) =
TNR (True Negative Rate) =
FNR (False Negative Rate)
Table-2 Truthtable for intrusion assertion by a classifier
Assertion of the classifier Intrusion? Positive Negative
Yes True Positive False Negative No False Positive True Negative
TPR is also known as Sensitivity or Recall in machine learning.
TNR is specificity.
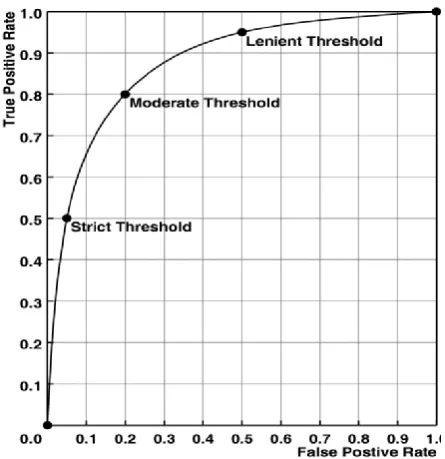
FPR is called as Fall-Out & calculated as 1 – Specificity. The ROC curve shows the graphical plot between sensitivity (TPR) and 1-specificity (FPR). These two figures vary in relation to each other (determined by experiment or theory) as the decision cutoff or the detection threshold varies. At any moment the rate of true positives is the highest, the rate of false positives is the lowest, and the vice versa is true. This work aims to use the ROC curve to get knowledge on how a detector is acting on a specific dataset, or to compare the respective accuracies of two or more detectors on the same data. Accuracy information, disclosed in the shape of the curve, i.e. two-dimensional as there are two kinds of events, and hence the two kinds of accuracies possible. The first dimension is the success rate of detecting normal events, which is shown along the y-axis (the vertical axis). The second dimension is the error rate of falsely identifying intrusion events, which is shown along the x-axis. An ideal ROC curve will have y - value which grows faster as compared to x-value, and it evolves in a curve shape which rises rapidly upward. Distinct shapes of ROC curves indicate various levels of detector accuracy. More accurate curves will rise further outward to the upper-left, nearing the point of perfection at (0,1). A perfect detector will have a success rate of 1.0 for normal event while having an error rate of 0.0 for intrusions.
25 Figure 2- Different threshold cutoffs.
4.1 AUC
The most common measure of total detection accuracy is the area under the curve, or AUC. The AUC is nonparametric, probably they don’t require any special assumptions about the fundamental statistical distributions of normal and anomaly data. It gives the outline of the total accuracy of the detector in a way that report for both, attain in TP rate and the depletion in FP rate. The range of AUC is in between 0.5 to 1.0.
It gives the most general picture of the accuracy. It is not possible to construct the ROC curve back with the single AUC number.
5. EXPERIMENTAL RESULT
This paper aims to evaluate the performance of two algorithms for attack and normal data classification and compares the result. The comparison is done with the measures true positive rate (TPR), false positive rate (FPR), and area under curve (AUC), shown in table 3.
Analysis is done using percentage split with various random seed value and then average is taken for the general performance of the classifier.
Attacks that are perfectly classified by approximately both the classifiers are Neptune, land, back, pod, smurf, guess_pswd, ipsweep, portsweep, saint, mailbomb, processtable, snmpguess, wazemaster, httptunnel, apache with maximum TPR and AUC as shown in table 3. Teardrop, nmap, loadmodule, perl, sqlattack, sendmail, xlock, udpstorm attacks are more accurately classified by VFI algorithm in which sendmail & xlock attacks have low TPR with ideal AUC
Table 3- Comparison between two classification techniques for different attacks
VFI REPTree
Class TP
R
FP R AUC TP
R
FPR AUC
Snmpgetatack 0.90 0 0.96 0.95 0.01 0.99 Smurf 0.99 0.04 0.98 0.65 0.01 0.99
Neptune 0.98 0.01 1 1 0 1
Land 1 0.002 1 1 0 1
Back 0.99 0.01 1 1 0 1
Pod 1 0.001 1 1 0 1
Teardrop 1 0.001 0.998 0 0 0.99
Guess_pwd 0.84 0 0.995 0.99 0 0.99 Ipsweep 0.98 0.001 0.999 0.98 0 1
Mscan 0.85 0.001 0.999 1 0 1
Nmap 1 0.001 1 0.96 0 0.98
Portsweep 0.96 0 0.98 0.92 0 0.96
Saint 0.81 0.001 0.983 0.93 0 0.98
Mailbomb 1 0.008 1 0.99 0 1
Procestable 1 0 1 1 0 1
Buffer_overflo w
0.56 0 0.99 0.71 0 0.86
Loadmodule 1 0.002 1 0 0 1
Perl 1 0.003 1 0 0 0.5
Rootkit 0.33 0.001 0.996 0 0 0.99
Ps 0.2 0.001 0.99 0.2 0 1
Sqlattack 1 0 1 0 0 0.5
Xterm 0.5 0.001 0.99 0 0 0.93
ftp_write 0 0.001 0.73 0 0 0.5
Imap 0 0.004 NaN 0 0 NaN
Multihop 0 0 0.85 0.25 0 0.75
Named 0.43 0.001 0.99 0.25 0 0.75
Phf 0 0.003 0.71 0 0 NaN
Sendmail 0.67 0.001 1 0 0 0.93
Snmpguess 1 0.001 0.99 0.99 0 1
Wazemaster 0.95 0 1 0.99 0 1
Worm 0.01 0.002 0.5 0 0 NaN
Xlock 0.25 0.002 0.99 0 0 1
Xsnoop 0 0 0.98 0 0 0.75
Httptunnel 0.94 0 0.98 0.98 0 0.99
Satan 0.69 0 0.98 0.98 0 0.99
Udpstorm 0.98 0 1 0 0 0.5
[image:4.595.300.556.95.764.2]The attacks type snmpgetattack, mscan, buffer_overflow, satan are classified efficiently by REPTree algorithm. And the other attacks imap, phf, xsnoop, worm are not classified correctly by both classifiers. The reason behind this can be very few connections present for these classes of attack in the dataset. Connection record for imap is only 1, phf is 2, xsnoop is 4, & worm is 2. The normal class of connection is very accurately classified by the REPTree algorithm, AUC for this algorithm is .998 which is approximately ideal. VFI algorithm also classifies normal class pretty good, AUC measure is 0.964 for it.
6. CONCLUSION
The basic goal of IDS is detecting suspicious traffic in different ways, in spite of that it comes with various approaches. There are network based (NIDS) and host based (HIDS) intrusion detection systems.
Classification techniques can be used with intrusion detection system to get more accurate normal and intrusion behaviour profile, and then it will help in both misuse detection and anomaly detection. REPTree learning algorithm was found to be performing better than VFI in terms of better accuracy and lower error rate. Experiment performed on KDD cup dataset demonstrates that REPTree algorithm is an efficient algorithm of classification, so this algorithm can be used with the IDS for more effective performance and low false alarm rates.
7. ACKNOWLEDGEMENTS
We would like to express our greatest gratitude and sincere thanks to the people who have supported and helped us throughout the work. We are also thankful to the experts who have contributed towards the development of this paper and also to our family for their moral support.
8. REFERENCES
[1] http://kdd.ics.uci.edu/databases/kddcup99/kddcup99.html [2] Lei Li, De-Zhang Yang, Fang-Cheng Shen, A Novel Rule-based Intrusion Detection System Using Data Mining, 978-1-4244-5540-9/10 ©2010 IEEE
[3] Desheng Fu, Shu Zhou, Ping Guo, The Design and Implementation of a Distributed Network Intrusion Detection System Based on Data Mining, World Congress on Software Engineering.
[4] Chai Wenguang, Tan Chunhui, Duan Yuting, Research of Intelligent Intrusion Detection System Based On Web Data Mining Technology, 2011.
[5] G.V.Nadiammai, M.Hemalatha, “Effective approach toward Intrusion Detection System using data mining techniques”, Cairo University Egyptian Informatics Journal.
[6] M. Moorthy and Dr. S. Sathiyabama. Study of Intrusion Detection using Data Mining. IEEE-International Conference On Advances In Engineering, Science And Management (ICAESM), ISBN: 978-81-909042-2-3. 2012
[7] Mrutyunjaya P., Manas R. Patra, “ A Comparative Study of Data Mining Algorithms for Network Intrusion Detection ”, Berhampur University, 2007
[8] R.A. Maxion and R.R. Roberts, Proper Use of ROC Curves in Intrusion/Anomaly Detection, School of Computing Science, University of New castle upon Tyne.
[9] Jun Zheng and Ming-zeng hu, Intrusion Detection of Dos/DDos and Probing Attacks for Web Services, Advances in Web-Age Information Management Lecture Notes in Computer Science Volume 3739, 2005. [10] Mahbod Tavallaee, Ebrahim Bagheri, Wei Lu, and Ali A.
Ghorbani, A Detailed Analysis of the KDD CUP 99 Data Set, 978-1- 4244-3764-1/09©2009 IEEE.
[11] Mohammad Khubeb Siddiqui and Shams Naahid, Analysis of KDD CUP 99 Dataset using Clustering based Data Mining, International Journal of Database Theory and Application Vol.6, No.5 (2013).
[12] Prof. N.S. Chandolikar, Prof. (Dr.) V.D. Nandavadekar, Selection of Relevant Feature for Intrusion Attack Classification by Analyzing KDD Cup 99, MIT International Journal of Computer Science & Information Technology, Vol. 2, No. 2, Aug. 2012, pp. (85-90) ISSN No. 2230-7621 © MIT Publications.
[13] Honghu Liu, Gang Li, Testing Statistical Significance of the Area under a Receiving Operating Characteristics Curve for Repeated Measures Design with Bootstrapping, Journal of Data Science 3 (2005),257-278.
[14] James A. Hanley, McNeil, The Meaning and Use of the Area under a Receiver Operating Characteristic (ROC) Curve, RADIOLOY'. Vol. l-1. No. l.Pages 29 April. 1982.
[15] John E. Gaffney Jr. Jacob W. Ulvila, Evaluation of Intrusion Detectors: A Decision Theory Approach, 0-7695-1046-9(C) 2001 IEEE.