Severity Grading of DME from Retina Images: A
Combination of PSO and FCM with Bayes Classifier
Sreejini K. S
Department of Computer science and Engineering National Institute of Technology
Calicut, India
V. K. Govindan
Department of Computer science and Engineering National Institute of Technology
Calicut, India
ABSTRACT
Diabetic macular edema (DME) is the main cause of visual impairments in patients with diabetic retinopathy and leads to vision loss if left untreated. In this paper, an automatic approach for severity grading of DME is introduced. The approach involves preprocessing, combination of Particle Swarm Optimization (PSO) algorithm and Fuzzy C-Means Clustering for exudates segmentation, optic disc elimination, fovea and macular region localization, and classification. The Bayes classifier separates the lesions to exudates and non-exudates. The severity of the disease is graded into categories such as normal, grade 1 and grade 2 based on the location of exudates. Region of macula is marked by Early Treatment Diabetic Retinopathy Studies (ETDRS) grading scale. The proposed method is evaluated using 200 images of publically available MESSIDOR database and performance figures of 91% for sensitivity, 98% for specificity and 94.5% for accuracy are obtained.
Keywords
Exudates, FCM Clustering, fovea, macula, PSO segmentation, severity of DME
1. INTRODUCTION
The major reason for reduction in vision acuity in people with diabetes is Diabetic Macular Edema (DME). It is an advanced symptom of Diabetic Retinopathy (DR) and occurs when blood vessels in retina of diabetic patients begin to leak lipid in to the macula [1 - 2]. These leaks cause macula to thicken,
swell and blur in the patient’s vision which leads to visual
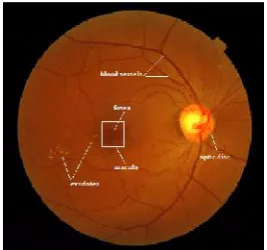
impairments in later stages if left untreated. The lipid leaks are called as exudates and it is one of the lesions of Diabetic Retinopathy (DR) [3]. In color fundus images these lesions appear as yellow or white structures with different size, shape and location. Macula is the part of the eye that provides sharp, clear central vision and its center, called fovea, contains large number of cone cells. Cone cells, which function in bright light, are color receptors whereas rod cells, which function in dim light, are responsible for black and white brightness receptors. Optic disc, which is the entry point for the blood vessels and optic nerve into the retina, appears as bright yellowish or white region. It is also called blind spot because there are no photoreceptors. Fig. 1 shows an example of a DME affected color retinal fundus image with main retinal structures and lesions marked. We used the retina fundus images from MESSIDOR dataset [4].
Two types of DME detection are: Direct and indirect [5]. Direct methods include stereoscopy or optical computed tomography [6]. Indirect methods, detect the presence of exudates in the retina [7]. DME has no early signs. Patients are unaware of their disease until it become severe, thus immediate treatment is needed after detection of even a minor sign of DME. Laser photocoagulation [8] and anti-vascular
endothelial growth factor (VEGF) therapy [9] are commonly used for treatment of DME.
The common diagnostic tools for assessing macular edema are Fluorescent Angiogram (FA) and color fundus camera. FA images were used in earlier years for diagnosis purpose. But it is not suitable for automatic screening system due to the side-effects associated with injecting fluorescein to patient before the image capture and it is time consuming, costly, and FA produces only gray-scale images [10]. Thus color fundus images taken by using fundus camera are used for screening. The severity of DME is assessed based on the proximity of exudates to the macula. The risk increases when exudates approaching the macula and is high when exudates are within macula. This method is considered as a standard tool to assess this disease from color fundus images.
[image:1.595.369.503.471.596.2]As per the estimation of the World Health Organization (WHO), the number of patients affected by diabetes is gradually increasing and will become 300 million in 2015 [11] . In India, the increase is from 18 million in 1995 to 54 million in 2025. The manual assessments become complex due to the increase in prevalence of diabetes, scarcity of trained personals and cost. Early detection is essential to prevent progress of diseases and vision loss. An automatic screening system is desired in coming years for detection and grading of the severity of diseases and to help the experts.
Figure 1. Color retina fundus image of stage 2 DME with lesions and anatomical structures are marked
2. RELATED WORKS
automatically segmented into two classes, background and DME, using a Gaussian mixture model classification algorithm. Pixels belonging to the class with the highest mean are labeled as DME region and the others as background.
A two-stage methodology for the detection and classification of severity from color fundus images is proposed in [5]. The first stage detects the presence or absence of exudates and the second stage assesses the macular region for measuring the severity of DME. The first stage uses a supervised learning approach that learns the characteristics only from normal fundus images. Two single class classifier, Gaussian data description and principal component analysis data description are used for learning normal cases. Severity of abnormality is assessed by rotational symmetry metric by examining the symmetry of macula in the retina.
Watershed segmentation based DME severity classification using color fundus images is described in [7]. Green component of image is extracted and optic disc is eliminated after preprocessing steps such as CLAHE (Contrast limited adaptive histogram equalization) and contrast stretching. Marker controlled watershed transformation is used to detect exudates, and the regions of macula are marked based on Early Treatment Diabetic Retinopathy Study (ETDRS) grading scale. The locations of exudates were used to determine the stages of DME.
Sopharak et al. [10] proposed a method to detect exudates from digital images of retinopathy patients with non-dilated pupils. At first, the image is converted to HSI color space, and then median filter is for noise removal. Histogram normalization is employed to enhance the contrast between exudates and background. The authors employed a set of optimally adjusted mathematical morphology based operators such as thresholding and morphological reconstruction for optic disc elimination and exudates detection. Authors claim that the approach is fast, needs low computational power and eliminates the need for pupil dilation. However, this approach sometimes detects artifacts wrongly as exudates especially those resembling exudates and the performance of the algorithm depends on other tasks such as optic disc detection and vessel removal.
A method to identify macular swelling through reconstruction of naïve height map of the macula area from multiple fundus images is proposed in [13]. The technique involves three parts: preprocessing, registration, naïve height map reconstruction. Preprocessing enhances the dark microstructures of the macula and equalizes the image. In the second phase, all available views are registered using the technique called speeded up robust features (SURFs). Finally, a dense pyramidal optical flow is calculated for all the images and statistically combined to build a naive height map of the macula. A difference in the mean height between the height maps of normal and edema cases is used to determine normal and abnormal cases. Authors reported better results for automatic retina image analysis, but it requires more rigorous validation.
Since the optic disc has similar features with exudates [7, 10], optic disc localization and removal is necessary prior to exudates segmentation/ classification. Optic disc localization is an important step for segmentation of other retinal features such as fovea and macula [5, 7]. Segmentation of optic disc is performed in [14] employing morphological and edge detection techniques and Hough transform. Blood vessels are eliminated before optic disc boundary segmentation. The
method assumes that a linear shape can be detected by using a rotating structuring element.
Use of watershed transform in automatic extraction of exudates and optic disc is proposed in [15]. The authors claim
that the method is better than Walter’s method [16]. In [4],
exudates are found by using their high grey level variation, and their contours are determined by means of morphological reconstruction techniques. Optic disc is detected by combining the morphological operations and the watershed transformation.
Sinthanayothin et al. [17] proposed a method to locate the optic disc based on the area with the highest variation in intensity of adjacent pixels and fovea by matching correlation together with the characteristics of typical fovea. Blood vessels are identified using multilayer perceptron neural network. Drawback of this method is that it incorrectly locates retinal structures, if retina image contains any pathology like exudates.
Many researchers have carried out for computer aided retinal analysis. However, most of them do not provide good performance in clinical practices. Lesions detection, localization of various retinal structures and severity grading require improved accuracy even with images of non-uniform illumination and pathologies for practical applications.
In this paper, an automatic method to grade the severity of DME from color fundus image is proposed. The proposed method consists of (1) preprocessing, (2) Combined feature based PSO-FCM multilevel segmentation, (3) Optic disc elimination, (4) Fovea localization and Macular region extraction, (5) Exudates classification and (6) Classification of severity of DME. The rest of the paper is organized as follows: Section III and IV present a brief introduction about PSO and FCM. The proposed method is described in Section V, which comprises preprocessing, multilevel segmentation, optic disc elimination, fovea localization and macular region extraction, classification of exudates by naïve Bayes classifier and grading the severity. Results and discussions are presented in Section VI and Section VII concludes the paper.
3. PARTICLE SWARM OPTIMIZATION
Particle Swarm Optimization (PSO) is a population-based stochastic search algorithm that uses swarm intelligence. It is first introduced by Kennedy and Eberhart [18] in 1995.Its basic idea is inspired by the simulation of social behavior of birds flocking and fish schooling and so on. Initially, no one exactly does know where the food is, but with each iteration they come to know how far the food is. The best strategy will be to follow a bird which is near to food and also from its own best position. Each member of the population is called a particle and the population is called swarm. Every particle has a velocity and position in search space. Each particle remembers its own best position called individual best, denoted by pbest, as well as the best position found by the whole swarm, called global best, denoted by gbest. All the particles have a fitness value determined by the optimization function. First, positions and velocities of each particle are initialized randomly. Then, allowed to “fly” through the
search space and update their positions and velocities until they find optimal solution. Every particle updates its velocity and position by (1) and (2).
i i 1 1 i 2 2 i
v (t 1) wv (t)c r pbestx (t) c r gbestx (t)
i i i
x (t 1)
x (t)
v (t 1)
(2)The index of the particle is represented by i. vi(t) is the velocity of the particle at time t and xi(t) is the position of the particle at time t, where t represents the iteration. w is called inertial coefficient that is used to control the convergence behavior of PSO. c1and c2are the learning factor that control how far a particle move in single iteration. The parameters 0≤
w ≤ 1.2, 0 ≤ c1≤ 2 and 0 ≤ c2 ≤ 2 are user supplied coefficients. r1and r2are random numbers (0≤ r1≤ 1 and 0 ≤ r2≤ 1 ).
The PSO method is very popular in many research areas such as image segmentation and abnormality detection [19 - 22]. It is a simple method, and has only a few parameters compared to other optimization algorithms like Genetic Algorithms (GA). Unlike the GA, PSO has no evolution operators such as crossover and mutation. But the problem with the PSO and other optimization algorithms is that of becoming trapped in a local optimum so that it may work well on one problem but may fail on another problem.
4. FCM CLUSTERING
FCM clustering algorithm is widely used method for segmentation introduced by Bezdek in 1985 [23]. If we consider image pixel values as collection of n samples, X = {x1, x2,…, xn}, FCM divides the n data objects into c (2≤ c ≤ n) clusters. In FCM, each data element can belong to every fuzzy cluster with a particular membership value. The membership value is higher if the data point is nearer to the center of cluster and its sum with respect to each cluster center is one. Fuzzy membership matrix, U = [uij](c x n) represents fuzzy clusters; U ∈ Mf as in Eq. 4, where uij represents the fuzzy membership value of the ithobject to the jth fuzzy cluster. In each iteration, cluster center and membership values are updated by Eq. 5 and Eq. 6 and tries to minimize the objective function given below:
c n 2
m
m ij i j
j 1 i 1
J
u
x
v
(3)where vjis the centroid of the jth cluster, || . || denotes the Euclidean distance from the data point xito the jth cluster center, and the parameter m is a weighting exponent that determines the amount of fuzziness of the resulting classification.
c n
cxn
ij ij
j 1 i 1
f
ij
U R | U 1, 0 U n
M
, U 0,1 ;1 j c;1 i n
(4)Steps in algorithm are as given below [5]:
1) Fix c (2≤ c ≤ n), m,∈, iteration number t = 0, initialize the partition matrix.
2) Initialize cluster centers v1, v2,…, vc.
3) Compute the elements of the fuzzy partition matrix using (5):
ij 2
m 1 c
i j
k 1 i k 1 U
x v
x v
(5)
4) Compute the cluster centers using (6):
n m i j i i 1
j n
m i j i 1
U x
v
u
(6)
5) If
v
new
v
old
where
< 0.001, then stop, else t = t+ 1and repeat the steps (3) and (4).
FCM has good clustering performance, but sensitive to the initial values and easily traps into local optimum.
5. MATERIALS AND METHODS
5.1 Image Database
MESSIDOR dataset [4] consists of macula centered color retina fundus images acquired with pupil dilation and without dilation using a color video 3CCD camera on a Topcon TRC NW6 non-mydriatic retinograph with a 45 degree field of view. The images were acquired by using 8 bits per color plane at 2240 X 1488 pixels and stored in TIFF format. Excel file with medical diagnoses for each image is used as ground truth.
5.2 Preprocessing
Median filtering is applied to eliminate the noise present in the image with filter window size of 3 X 3. Then color normalization is done, because the color of retina fundus images from different patients vary widely due to the strong correlation between the person's skin pigmentation and iris color [24]. Color normalization is done using histogram specification method described in [25]. Identify a retina image as reference and apply histogram specification to normalize the colors of all other images in the database.
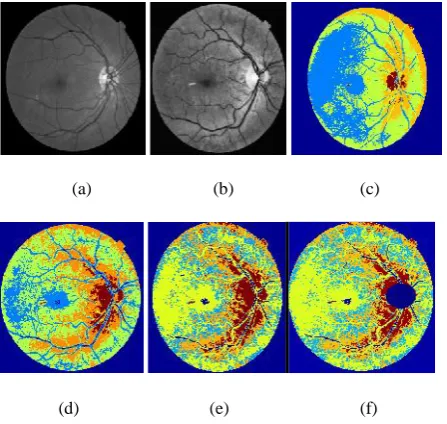
In the present work, green component of the histogram normalized image is extracted and scaled to 576 X 720 pixels. Contrast limited adaptive histogram equalization (CLAHE) was applied for contrast enhancement. Figures 2(a) and (b) show the histogram normalized green channel image with and without preprocessing. Exudates, optic disc and vessels are better visible after normalization.
5.3 Combined feature based PSO
–
FCM
Multilevel Segmentation
Image segmentation subdivides the image into its constituent regions, where each region shares similar properties. The level to which the subdivision is carried out depends on the problem being solved. Various methods are available in the literature for segmentation. Thresholding is the fundamental approach to segmentation.
Bi - level thresholding can be seen as an optimization problem
to find the threshold ‘t’ that maximizes the inter-class variance and minimizes the intra-class variance, denoted by max(σB(t)), 0≤ t ≤ L, where L is the maximum intensity range.
This can be extended to multilevel Thresholding satisfying maximum interclass variance among n-1 threshold values, i.e.,
max σB(t1,t2,..tn-1)) such that 0≤ t1< t2< … < L. We can find different threshold values by exhaustive search method based
the inter-class variance, σB and minimize the intra-class variance. Pixels of the image is divided into ‘n’ intensity
levels or n classes, D1, D2, . . . Dn. Fitness is calculated by (7).
21 2 n 1 B j
Fitness
max 1
t
t
...
t
L
(t )
(7)Multilevel threshold values obtained from the basic PSO can be use for segmentation, but it converges at local minima. The introduction of fuzzy with PSO can eliminate this problem. Thus the n - 1 threshold values from basic PSO can be used as the initial clusters before performing FCM segmentation to yield good results. The algorithm for the combined feature based PSO-FCM multilevel segmentation is given below:
1. Select features for multilevel image segmentation.
2. Use Particle swarm optimization to find multilevel threshold.
3. Use the multilevel thresholds computer above as initial clusters, and perform FCM segmentation.
In the proposed method the PSO algorithm uses the following set of features to determine the optimal threshold values for multilevel segmentation.
a. Intensity values of the preprocessed green channel: exudates and optic disc pixels have high intensity.
b. Mean intensity: As exudates appear as a cluster, mean intensity is a one of the distinguishable feature.
c. Standard deviation of intensity: Because distribution measurement of the pixel values would differentiate exudates area from the others, standard deviation shows the main characterization of the closely distributed cluster of exudates.
d. Hue image of HSI converted image: Hue components make up chrominance or color information.
PSO based multilevel thresholding can be described as follows:
Step 1: Initialization of swarm, that is, population, inertial factor, number of iteration, weights etc.
Step 2: Positions and velocites of the particles are
initialized. Here the velocities of the particles are set to zero and positions are randomly set within the boundaries of search space.
Step 3: Loop
For each particle
Evaluate the fitness using (7), i.e., maximizes the between class variance of all levels. Update each particle's velocity according to (1) Update each particle's position according to (2) end
Until meeting the stop criteria (until t reaches the maximum of the iteration number, or the best solution remains the same).
Step 4: Segment image according to the optimal thresholds
(a) (b) (c)
[image:4.595.318.542.71.283.2](d) (e) (f)
Figure 2. Exudates Segmentation: Original green channel image, (b) preprocessed green channel image (c) basic PSO, (d) feature based PSO, (e) Combined PSO–FCM
feature based, (f) results after OD removal
Figure 2(a) is the original green channel image and Figure 2(b) is the preprocessed green channel image. Figures 2 (c) - (e) show the results of segmentation with basic PSO algorithm, feature based PSO algorithm, and combined feature based PSO-FCM algorithm. Here, the number of cluster is set to 5, which gives optimum segmentation. Introduction of fuzziness with PSO performs well for non-illumination images also. It is also observed that we can segment small and faint exudates employing the proposed. In all the above approaches the optic disc and exudates were clustered into same cluster.
5.4 Optic Disc Elimination
Optic disc has some characteristics similar to exudates: high intensity and sharp boundaries. Due to this, the clustering algorithm categorizes both optic disc and exudates to the same cluster. This makes segmentation difficult. Hence, optic disc detection and removal is necessary before exudates segmentation. In this work, a circular mask for optic disc is made use of for morphological operations such as closing and thresholding for the removal of optic disc. Fig. 2(f) shows the result after optic disc removal.
5.5 Fovea localization and Macular region
extraction
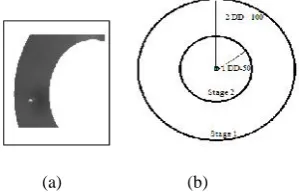
Fovea is the depression in the retina that contains only cones and that provides acute sight and macula is the area in the middle of the retina that allows seeing objects with great detail. It is the darkest point, but sometimes brighter due to the presence of lesions. Usually the centre of the fovea is located at a distance of approximately 2.5 times the diameter of the optic disc from the centre of the optic disc [17]. Fovea localization is important in determining severity of DME. Two circular binary masks with radius 125 and 225 pixels from the center of the optic disc are used to create the annular mask. Location of minimum in the region of the annular mask from the region of interest is taken as the center of fovea.
large number of images. Fig. 3(a) shows the annular mask for fovea detection and Fig. 3(b) shows the mask for classification of different stages of DME based on the distance of exudates from the center of macula.
(a) (b)
Figure 3. (a) Annular mask for fovea detection (b) classification of stages of DME based on distance from
fovea
5.6 Exudates Classification
5.6.1 Feature Extraction
Sample exudates are shown as in Fig. 4(a) and the exudates present only in macular region are selected for classification. Candidate exudates selected from macular region for classification are shown in Fig. 4(b). Following features are extracted from each candidate exudates from the macular region.
1. Mean RGB value inside the region (features 1 - 3)–
mean of the RGB values of the pixels that belong to the region.
2. Standard deviation RGB value inside the region (features 4 - 6) – standard deviation of the RGB values of the pixels that belong to the region.
3. Mean RGB value at the centroid of region (features 7 - 9)–intensity values in the RGB components of the center of the region.
4. Edge strength (feature 10) - average of the edge values in the perimeter of the region by the use of prewitt operator.
5. Area of each region (feature 11)–total number of pixels in the region.
(a) (b) (c)
Figure 4. (a) Sample exudates (f) candidate exudates selected from macular region (h) Classified exudates by
proposed method
5.6.2 Classification of exudates and non-exudates
Candidate exudates from selected regions are classified into exudates and non-exudates using of Bayes classifier [27-29]. Fig. 4(c) shows the result after exudates classification.The naïve Bayes classifier uses the principle of Bayesian maximum a posteriori (MAP) classification: measure a finite set of features x = (x1,….., xn) then select the class
y
Y arg max P(y / x )
(8)
where
P(y/x)∝p(x/y) P(y) (9)
p(x/y) is the likelihood of feature vector x given class y, and P(y) is the priori probability of class y. Naive Bayes assumes that the features are conditionally independent given the class:
i i
p(x | y)
p(x | y)
(10)We estimate the parameters p(x/ y) and P(y) from training data.
5.7 Classification of Severity of DME
We can grade the severity of DME depending upon the proximity of exudates to the macula. Table 1 shows the severity grading of DME by ETDRS specification [30]. If exudates present in one disc diameter then classified as stage 2, i.e., the inner mask with radius 50 pixels. If the presence of exudates is at a location which is more than one disc diameter then it is classified as stage 1, i.e., outer mask with radius 100 pixels. Otherwise, it is considered as normal image. Fig. 5 shows the example of classification of stages of DME; blue color denotes the optic disc centroid and green color denotes the fovea center.
[image:5.595.97.247.123.220.2](a) (b) (c)
Figure 5. Classification of DME (a) normal (b) stage 1 (c) stage 2
TABLE I. DIABETICMACULAREDEMASEVERITYSTAGES
[7]
Severity Definition
Normal No visible hard exudates around macula
Stage 1 Shortest distance between macula and hard exudates is more than one disc diameter (DD) from fovea.
Stage 2
Shortest distance between macula and hard exudates is less than or equal to one disc diameter (DD) from fovea.
6. RESULTS AND DISCUSSION
[image:5.595.312.554.404.655.2] [image:5.595.58.281.548.664.2]True Positive, TP - Correctly classified stages of DM. False Positive, FP - absence of DME which is diagnosed
as present by proposed method. False Negative, FN - presence of DME which is
wrongly classified by proposed method. True Negative, TN - absence of DME which is correctly
diagnosed by proposed method.
Sensitivity, specificity and accuracy are computed based on the above four measures using Eq. (11) to (13). In the previous work [31], exudates are extracted using PSO based segmentation algorithm and optic disc and fovea are marked by mathematical morphology. 100 images are used to test the performance of the method proposed in this paper. All the 60 normal images are correctly detected as normal. Out of 10 images of stage 1, 8 images are detected correctly while 2 images are detected falsely as normal. Out of 30 images of stage 2, 25 images are detected correctly while 5 images are detected falsely as normal or stage 1.
In this work, 200 images are used to test the performance. Small numbers of training images are used. From 100 normal images, 98 are correctly detected as normal where as 2 are detected as stage 1 or stage 2. Out of 20 images of stage 1, 17 images are detected correctly while 3 images are detected falsely as normal. Out of 80 images of stage 2, 74 images are detected correctly while 6 images are detected falsely as normal or stage 1.
TABLE II. Performance Comparison Of DME Severity Grading With Existing Approaches
Techni ques
#img. used
Sensitivity (%)
Specificity (%)
Accuracy (%)
Lim [7] 88 80.9 90.2 85.2
PSO with morpho
logy [31]
100 82.5 100 93
PSO-Fuzzy with
Baye’s
classifi er
200 91 98 94.5
The proposed method based on combination of PSO and fuzzy with Bayes classifier provides better results than thre existing methods. The main limitation of existing method is that they miss small and faint exudates but in the proposed method the introduction of FCM eliminates this problem. As the algorithm makes use of multilevel threshold values obtained using feature based PSO for initial cluster centers for FCM, the approach is successful in eliminating the FCM from getting trapped into local minimum, and hence provides better results.
TP Sensitivity
TP FN
(11)
TN Specificity
TN FP
(12)
TP TN Accuracy
TP FN TN FP
(13)
The performance of the proposed combined algorithm in detecting exudates at image level is presented in Table II in comparison with the method described in [7] and [31]. The proposed algorithm provides improved sensitivity and accuracy with the introduction of FCM classifier; however the specificity is decreased due to the misclassifications arising out of the poor image quality and the background noise which has almost the same contrast as the exudates. It is also observed that the system performs better in classifying images into different stages. The approach can be made useful for clinical practice with a little bit of improvement for eliminating the noise that disguises as exudates.
7. CONCLUSION
The diabetic macular edema (DME) is a major cause for reduction in vision acuity in people with diabetes. It is of great help for the affected people and the physicians to have an automatic way of detecting and grading the severity of DME. This paper proposed an automatic method to grade the severity of stages of DME. The approach makes use of a combination of feature based PSO and FCM for the segmentation, and a naïve Bayes classifier for classification of the candidate exudates into exudates and non exudates. Grading the severity of DME is based on ETDRS specification. The performance comparison shows that the proposed method works well for non-uniform images and can be used for clinical purposes. There are some misclassifications due to poor image quality and the background noise which interferes with the exudates detection process and can be eliminated by incorporating some techniques for noise removal. Thus, the future work attempts to address these issues and to separate the hard and soft exudates by considering edge sharpness, and faint and small exudates.
8. ACKNOWLEDGMENTS
Color fundus images used in proposed method from MESSIDOR dataset, kindly provided by the Messidor program partners, see the link: <http://messidor.crihan.fr
9. REFERENCES
[1] L. Giancardo, F. Meriaudeau, T. P. Karnowski, Y. Li, K.
W. Tobin and E. Chaum, “Automatic retina exudates segmentation without a manually labelled training set,”
Proc. of the 8thIEEE Int. Symp. Biomed. Imag: From Nano to Macro, ISBI 2011, Chicago, USA, pp. 1396–
1400.
[2] Thomas A. Ciulla, Armando G. Amador and Bernard
Zinman, “Diabetic Retinopathy and Diabetic Macular
Edema, Pathophysiology,” screening, and novel therapies,” Diabetes Care,Vol. 26, no. 9, pp. 2653 -2664, 2003.
[3] Maria Garcia, Roberto Hornero, Clara I. Sanchez, Maria
I. Lopez, and Ana Diez, “Feature Extraction and
Selection for the Automatic Detection of Hard Exudates
in Retinal Images,” In Proceedings of the 29th Annual
International Conference of the IEEE EMBS, Cite Internationale, Lyon, France, August 23-26, 2007.
[4] Methods to evaluate segmentation and indexing techniques in the field of retinal ophtalmology. [Online 2012]. Available: http://messidor.crihan.fr
[5] Deepak AND Sivaswamy, “Automatic Assessment of
Macular Edema From Color Retinal Images,” IEEE
[6] Maalej A, Cheima W, Asma K, Riadh R, Salem G,
“Optical Coherence Tomography for Diabetic Macular
Edema: Early Diagnosis, Classification and Quantitative
Assessment,” J Clinic Experiment Ophthalmol S2:004, 2012.
[7] S. T. Lim, W. M. D. W. Zaki, A. Hussain, S. L. Lim and
S. Kusalavan, “Automatic Classification of Diabetic Macular Edema in Digital Fundus Images,” In CHUSER
2011, Dec., Penag.
[8] Early Treatment Diabetic Retinopathy Study Research Group: Treatment techniques and clinical guidelines for photocoagulation of diabetic macular edema. ETDRS Rep. 9. Early Treatment Diabetic Retinopathy Study Research Group. Ophthalmology.; 94(7), pp. 761-74, Jul. 1987.
[9] Adam S. Wenick and Neil M. Bressler, “Diabetic
Macular Edema: Current and Emerging Therapies,”
Middle East Afr J Ophthalmol., Vol. 19, Issue 1, pp. 4 -12, 2012.
[10] Akara Sopharak , Bunyarit Uyyanonvara, Sarah Barman
and Tom Williamson, “Automatic detection of diabetic
retinopathy exudates from non-dilated retinal images
using mathematical morphology methods,” Journal of
Computerized Medical Imaging and Graphics, pp. 720 -727, 2008.
[11]K. Lochan, P.Sah and Sarma K. K., “Innovative feature
set for retinopathic analysis of diabetes and its
detection,” 2012 3rd National Conference on Emerging Trends and Applications in Computer Science (NCETACS).
[12] Maha S. El-Shahawy, Ahmed ElAntably, Nermin Fawzy, Khaled Samir, Mustafa Hunter and Ahmed S. Fahmy,
“Segmentation of Diabetic Macular Edema in
Fluorescein Angiograms,” IEEE International Symposium on Biomedical Imaging: From Nano to Macro, pp. 661 - 664, 2011.
[13] LGiancardo, F. Meriaudeau, T. Karnowski, K. Tobin, E. Grisan, P.Favaro, A. Ruggeri, and E. Chaum,
“Textureless macula swelling detectionwith multiple retinal fundus images,”IEEE Trans. Biomed. Eng., vol. 8, no.3, pp. 795–799, Mar. 2011.
[14] A. Aquino, M.E. Gegundez-Arias, and D. Marin,
“Detecting the optic disc boundary in digital fundus images using morphological, edge detection and feature
extraction techniques,” IEEE transactions on medical
imaging, 29(10), pp: 1860-1869, 2010.
[15] Ahmed Wasif Reza & C. Eswaran & Kaharudin Dimyati,
“Diagnosis of Diabetic Retinopathy: Automatic Extraction of optic disk and exudates from retinal images
using marker controlled watershed transformation”, J.
Med. Syst., 491-1501, 2011.
[16] Thomas Walter, Jean-Claude Klein, Pascale Massin, and
Ali Erginay, “A Contribution of Image Processingto the Diagnosis of Diabetic Retinopathy—Detection of
Exudates in Color Fundus Images of the Human Retina”,
IEEE TRANSACTIONS ON MEDICAL IMAGING, VOL. 21, NO. 10, OCTOBER 2002.
[17] C. Sinthanayothin, J. Boyce, H. Cook, and T.
Williamson, “Automated localization of the optic disc,
fovea, and retinal blood vessels from digital colour
fundus images,” In British Journal of Ophthalmology, Vol. 83, no. 11, pp. 902 - 910, 1999.
[18] James Kennedy and Russell Eberhart., “Particle swarm optimization”, Proc. of the IEEE International
Conference on Neural Networks, Vol. 4, pp. 1942 - 1948, Piscataway, NJ, 1995.
[19] Amanpreet Kaur and M. D. Singh, “An Overview of
PSO -Based Approaches in Image Segmentation,”IJET, Vol.2, no.8, pp. 1349 -1357, 2012.
[20] Pedram Ghamisi, Micael S Couceiro, Jón Atli Benediktsson and Nuno M.F. Ferreira, “An efficient
method for segmentation of images based on fractional
calculus and natural selection”, In International Journal
of Expert Systems with Applications, Vol. 39, pp. 12407 -12417, 2012.
[21] Azarbad and Milad, “Brain tissue segmentation using an unsupervised clustering technique based on PSO
algorithm”, In Iranian Conference of Biomedical Engineering (ICBME), 2010.
[22] Zhou Xian-cheng, “Image Segmentation Based on
Modified Particle Swarm Optimization and Fuzzy
C-Means Clustering Algorithm”, Second International Conference on Intelligent Computation Technology and Automation, 2009.
[23]J.C. Bezdek, “Pattern Recognition with Fuzzy Objective Function Algorithms,” Plenum, New York, 1981.
[24]A. Osareh, B. Shadgar and R. Markham, “A
Computational-Intelligence-Based Approach for
Detection of exudates in Diabetic Retinopathy Images”,
IEEE transaction on Information Technology in biomedicine, Vol. 13, Issue 4, pp. 535- 545, 2009.
[25] R. Gonzalez and R. Woods, Digital Image Processing, Addison-Wesley Press, 1993.
[26]N. Otsu, “A threshold selection method from gray-level
histograms,” IEEE Transactions on Systems, Man,
Cybernetics, SMC - 9, pp. 62–66, 1979.
[27]R. O. Duda, P. E. Hart, and D. G. Stork, “Pattern Classification”, San Diego: Harcourt Brace Jovanovich,
Second ed., November 2000.
[28]N. Friedman, D. Geiger, and M. Goldszmidt, “Bayesian
networkclassifiers,”Machine Learning. Vol. 29, pp.131-163, 1997.
[29] Sopharak, Akara, Dailey, Matthew N., Uyyanonvara, Bunyarit, Barman, Sarah, Williamson, Tom, Nwe, Khine Thet and Moe, Yin Aye , “Machine learning approach to
automatic exudate detection in retinal images from
diabetic patients”, Journal of Modern Optics, 57(2):124 -135, 2010.
[30] Early Treatment Diabetic Retinopathy Study research group: Early photocoagulation for diabetic retinopathy. ETDRS Rep. 9. Ophthalmology 98, pp. 766 - 785, 1991.
[31]Sreejini K. S and V. K. Govindan, “Automatic grading of
severity of diabetic macular edema using color fundus