Implementation of Novel Optimization Algorithm for
Optimal Placement and Sizing of Capacitor Banks in
Radial Distribution Systems for Power Loss
Minimization and Net Savings Maximization
T Vinod Kumar
PG ScholarDepartment of Electrical and Electronics Engineering, Sir C. R. Reddy College of Engineering, Eluru-534007, Andhra Pradesh, India
I Satish Kumar
Associate ProfessorDepartment of Electrical and Electronics Engineering, Sir C. R. Reddy College of Engineering, Eluru-534007, Andhra Pradesh, India
ABSTRACT
In this paper, a new algorithm is implemented to solve optimal placement of capacitors in radial distribution systems in two ways that is, optimal placement of fixed or Discrete size of capacitor banks (Variable Locations Discrete sizing Capacitor banks-VLDC) and optimal sizing and placement of capacitors (Variable Locations Continues sizing of Capacitors-VLCC) for real power loss minimization and net savings maximization. The new algorithms Bat Algorithm (BA): search for all possible locations in the system along with the different sizes of capacitors, in which the optimal sizes of capacitor are chosen to be standard sizes that are available in the market. To check the feasibility, the proposed algorithms are applied on standard 34 and 85 bus radial distribution systems. And the results are compared with results of other methods like particle swarm optimization (PSO), harmonic search (HS), genetic algorithm (GA) artificial bee colony (ABC) teaching learning based optimization (TLBO) and plant growth simulation algorithm (PGSA), as available in the literature. The proposed approaches are capable of producing high-quality solutions with good performance of convergence. The entire simulation has been developed in MATLAB R2010a software.
Keywords
Optimization, capacitor banks, power loss minimization, net savings maximization, radial distribution systems, BAT algorithm, VLCC, VLDC etc
1.
INTRODUCTION
The analysis of power distribution systems is an important area of research due to the fact that, it is the final link between the bulk power system and consumers. However, reactive power flow in a distribution network always cause high power losses. The reactive power support is one of the well-recognized methods for the reduction of power losses together with other benefits; such as loss reduction, power factor correction, voltage profile improvement to the utmost extent under various operating constraints. The shunt capacitor is one of the basic equipment to full fill these objectives. Therefore it is important to find optimal location and sizes of capacitors in the system to achieve the above mentioned objectives.
Numerous methods for solution to the optimal placement of capacitor with a view to minimizing losses have been
Over the last two decades, the studies on meta-heuristic techniques have shown that the most of the difficulties of classical methods can be eliminated by applying these techniques.
Several heuristic methods have been developed in the last decade for optimal capacitor placement. Prakash and Sydulu used PSO [1] approach for finding the optimal size and location of capacitors in radial distribution system. Kalyuzhny et al. proposed GA [2] as an optimization tool to place shunt capacitor on distribution system under capacitor switching constraints. Rao et al. [3] presented plant growth simulation algorithm (PGSA) for capacitor placement in radial distribution systems which determine the optimal locations and size of capacitor to improve the voltage profile and reduction of power losses. Raju et al. presented direct search algorithm (DSA) [4] to find the optimal size and location of fixed and switched capacitors in a radial distribution system to maximize the savings and minimize the power loss. Some other heuristic methods such as tabu search [5], the harmony search algorithm [6], ant colony optimization-based algorithm [7] and a simulated annealing technique [8], and TLBO [9] to solve capacitor placement optimization problems. A comprehensive survey on the various heuristic optimization techniques applied to determine the optimal capacitor placement and size is presented in [10].
systems. The distribution power flow suggested in [17] is used in this study.
2.
OBJECTIVE FUNCTION
FORMULATION
2.1
Objective Function
Optimal capacitor placement in radial distribution system reduces the active power losses and improves the voltage profile. Reduction in power loss leads to the reduction in energy loss cost. However, the capacitor placement increases the installation and investment cost. Therefore the objective of capacitor placement is to maximize the annual net saving by minimizing the total annual cost of system, subjected to specific operational constraints. Mathematically, the objective function of the problem is formulated as,
Maximize
𝑆 = 𝐾𝑒 𝑃𝑙𝑏− 𝑃𝑙𝑎 𝑇−∝ 𝐶𝑖𝑁𝑐+ 𝐶𝑝 𝑁𝑖=1𝑐 𝑄𝑐 𝑖 − 𝐶0𝑁𝑐 eq. (1) Where S is the annual net savings, Plb & Pla are the total active
power loss before and after compensation respectively, Ke is
the energy cost per KWh, α is the depreciation factor, T is the time period in hours, Ci is the installation cost of capacitor per
location, Nc is the number of compensated buses where
capacitors are to be placed, Cp is the purchase cost of
capacitor per kVAR, C0 is the capacitor operating cost per
location and Qc(i) is the amount of reactive power of installed
capacitor at bus i.
2.2
Constraints
The objective function is subjected to following constraints:
The voltage magnitude must kept within the specified limits at each bus:
𝑉𝑚𝑖𝑛 ≤ 𝑉 ≤ 𝑉𝑚𝑎𝑥 eq. (2)
Where Vmin, Vmax are the lower and upper limits of
bus voltage, respectively.
The apparent power flow through the line must be less than the maximum apparent power admissible for the line and it is expressed as
𝑆𝑖≤ 𝑆𝑖𝑚𝑎𝑥 𝑖 = 1,2, . . 𝑛𝑏 eq. (3)
Where nb is the number branches, Si is the apparent
power flow of the ith branch and Simax is the
maximum apparent
power flow of the ith branch. From practical limitation, maximum compensation by using capacitor bank is limited to the total reactive power demand.
𝑁𝑖=1𝑐 𝑄𝑐 𝑖 ≤ 𝑁𝑗 =1𝑙 𝑄𝐷 𝑗 eq. (4) Where Nl is the number of load buses and QD (j) is
the reactive power demand of load at bus j.
Capacitors are available in discrete sizes so shunt capacitors to be dealt with multiple integers of the smallest capacitor size available and it may be mathematically expressed as
𝑄𝑐 𝑖 ≤ 𝐿𝑄𝑠 (5) Where, Qs is the smallest capacitor size available
and L is an integer multiple.
3.
PROPOSED ALGORITHM
3.1
Bat Algorithm
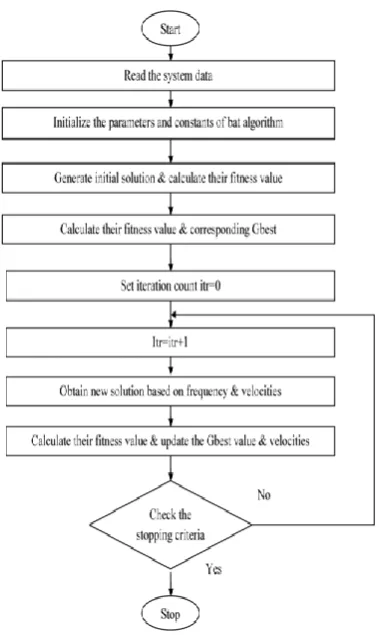
The majority of heuristic and meta-heuristic algorithms have been derived from the behaviour of biological systems and/or physical systems in nature. The Bat Algorithm (BA) is based on the echolocation behaviour of bats, proposed by Xin-She-Xang for engineering optimization in [11]. If we idealize some of the echolocation characteristics of micro bats, we can develop various bat-inspired algorithms or bat algorithms. For simplicity, we now use the following approximate or idealized rules:
1) All bats use echolocation to sense distance, and they also ‘know’ the difference between food/prey and background barriers in some magical way;
2) Bats fly randomly with velocity Vi at position Xi with a
fixed frequency fmin, varying wavelength λ and loudness
A0 to search for prey. They can automatically adjust the
wavelength (or frequency) of their emitted pulses and adjust the rate of pulse emission r ∈ [0, 1], depending on the proximity of their target.
3) Although the loudness can vary in many ways, we assume that the loudness varies from a large (positive) A0 to a minimum constant value Amin. Another obvious
simplification is that no ray tracing is used in estimating the time delay and three dimensional topography. Though this might be a good feature for the application in computational geometry, however, we will not use this as it is more computationally extensive in multidimensional cases.
In addition to these simplified assumptions, we also use the following approximations, for simplicity. In general the frequency f in a range [𝑓𝑚𝑖𝑛, 𝑓𝑚𝑎𝑥] corresponds to a range of wavelengths [λmin, λmax]. For example a frequency range of
[20 kHz, 500 kHz] corresponds to a range of wavelengths from 0.7mm to 17mm.
Fig 1 Flowchart for implementation of BAT algorithm
3.2
Pseudo Code for BAT Algorithm
Objective function f (x), x = (x1, ..., xd) T
Initialize the bat population xi (i = 1, 2, ..., n) and vi
Define pulse frequency fi at xi
Initialize pulse rates ri and the loudness Ai
While (t <Max number of iterations)
Generate new solutions by adjusting frequency and updating velocities and locations/solutions [Eqs (6) to (8)]
If (rand > ri)
Select a solution among the best solutions Generate a local solution around the selected best solution
End if
Generate a new solution by flying randomly
if (rand < Ai & f (xi ) < f (x*)
Accept the new solutions Increase ri and reduce Ai
End if
Rank the bats and find the current best x*
End while
In simulations, we use virtual bats naturally. We have to define the rules how their positions and velocities in a d-
dimensional search space are updated. The new solutions 𝑋𝑖𝑡 and velocities at time step t are given by
𝑓𝑖= 𝑓𝑚𝑖𝑛 + 𝑓𝑚𝑎𝑥 − 𝑓𝑚𝑖𝑛 𝛽 (6)
𝑉𝑖𝑡= 𝑉𝑖𝑡−1+ 𝑋𝑖𝑡− 𝑋∗ 𝑓𝑖 (7)
𝑋𝑖𝑡= 𝑋𝑖𝑡−1+ 𝑉𝑖𝑡 (8)
Where, β ∈ [0, 1] is a random vector drawn from a uniform distribution. Here x∗ is the current global best location (solution) which is located after comparing all the solutions among all the n bats. As the product is the velocity increment, we can use either (or λi) to adjust the velocity change while
fixing the other factor (or), depending on the type of the problem of interest. In our implementation, we will use 𝑓𝑚𝑖𝑛 = 0 and 𝑓𝑚𝑎𝑥 = 100, depending the domain size of the problem of interest. Initially, each bat is randomly assigned a frequency which is drawn uniformly from [𝑓𝑚𝑖𝑛, 𝑓𝑚𝑎𝑥].The update of the velocities and positions of bats have some similarity to the procedure in the standard particle swarm optimization as essentially controls the pace and range of the movement of the swarming particles. To a degree, BA can be considered as a balanced combination of the standard particle swarm optimization and the intensive local search controlled by the loudness and pulse rate.
4.
RESULTS AND DISCUSSION
[image:3.595.68.258.74.392.2]The performance and effectiveness of the proposed algorithm have been tested on 34-bus and 85-bus radial distribution system for maximization of net savings through real power loss minimization. Two approaches has been presented in this paper i.e., the first approach describe the optimal placement of fixed capacitor banks and the second approach describe optimal sizing as well as placement for capacitors in radial distribution systems. The constants used in the calculation of net saving are given [18] in Table 1. A number of trails on the performance of the applied algorithms have been carried out on the test systems to determine the most suitable algorithm parameters. The tuned parameters of BAT algorithm are given in Table 2.
Table 1 Constants used in computation of net saving/ year
S.No Parameter description Value
1 Average energy cost (Ke) $0.06/kW h
2 Depreciation factor (α) 20% 3 Purchase cost (Cp) $25/kVAR
4 Installation cost (Ci) $1600/location
5 Operating cost (Co) $300/year/location
6 Hours per year (T) 8760
4.1
34-Bus Test System Numerical Results
Fig 2 Single line diagram for 34-bus radial distribution system
Table 2 Description of algorithm parameters
BAT Algorithm Parameters
Description Value
Pop Population of Bats 150
D Dimensional search space of
a bat 3&8
A Loudness 0.50
R Pulse rate 0.50
fmin Minimum frequency 0.00
fmax Maximum frequency 2.00
Maxitr Maximum number of
generations 150
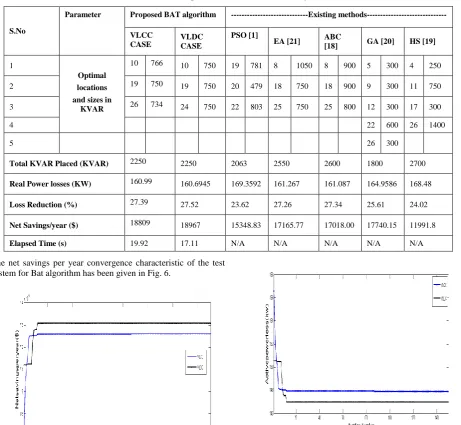
To observe the effectiveness of the implemented algorithms, the results obtained in two approaches were compared with the other techniques like PSO [1], ABC [18], HS [19], GA [20] and EA [21] in the literature. Table3 shows, the optimal locations and sizes of capacitors, total kVAR compensated, total active power loss, percentage of loss reduction and annual net savings of proposed algorithms along with existing algorithms. For this test system three capacitors are optimally placed and sized in two ways. First the locations and sizes of fixed capacitor banks are obtained by Bat algorithm are 10, 19, 24 and 750, 750, 750 kVAR respectively, with an active power loss of 160.6945 KW, minimum voltage is 0.9501 p.u and annual net savings of $18967. The convergence characteristic of the test system for Bat algorithm has been given in Fig. 3.
Fig 3 Comparison of algorithm for VLCC & VLDC with
Later, optimal locations and optimal sizes of capacitors (not fixed in size) are selected with help of same algorithms. The location and size of capacitors obtained by Bat algorithms are 10, 19, 26 and 766, 750, 734 kVAR respectively, with an active power loss of 160.99 kW and annual net savings of $18809. The convergence characteristic of the test system for Bat algorithm has been given in Fig.4. From the observation of simulation results, it is noticed that annual net savings for proposed algorithm is comparatively high than other algorithms.
Fig4 Comparison of algorithm for VLCC & VLDC with respect to active power loss convergence characteristics
for 34-bus test system
4.2
85-Bus Test System Numerical Results
The 85-bus test case consists of a main feeder, 9 sub-feeders (laterals) and sub-laterals radial distribution system as shown in Fig. 5. The data of the system is obtained from [21]. The total load of the system is 2574.3 kW and 2622.6 kVAR.
Fig 5 Single line diagram for 85-bus radial distribution system
[image:4.595.326.527.399.562.2] [image:4.595.72.262.568.719.2]Table 3 Comparison of results for 34-bus system
S.No
Parameter Proposed BAT algorithm ---Existing methods---
VLCC
CASE VLDC CASE
PSO [1]
EA [21] ABC
[18] GA [20] HS [19]
1
Optimal locations and sizes in
KVAR
10 766 10 750 19 781 8 1050 8 900 5 300 4 250
2 19 750 19 750 20 479 18 750 18 900 9 300 11 750
3 26 734 24 750 22 803 25 750 25 800 12 300 17 300
4 22 600 26 1400
5 26 300
Total KVAR Placed (KVAR) 2250 2250 2063 2550 2600 1800 2700
Real Power losses (KW) 160.99 160.6945 169.3592 161.267 161.087 164.9586 168.48
Loss Reduction (%) 27.39 27.52 23.62 27.26 27.34 25.61 24.02
Net Savings/year ($) 18809 18967 15348.83 17165.77 17018.00 17740.15 11991.8
Elapsed Time (s) 19.92 17.11 N/A N/A N/A N/A N/A
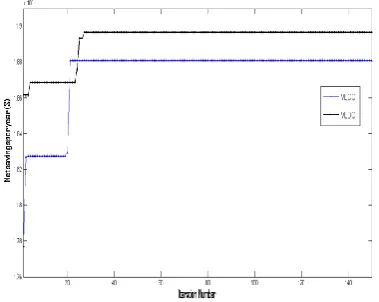
The net savings per year convergence characteristic of the test system for Bat algorithm has been given in Fig. 6.
Fig 6 Comparison of algorithm for VLCC & VLDC with respect to Net savings maximization convergence
characteristics for 34-bus test system
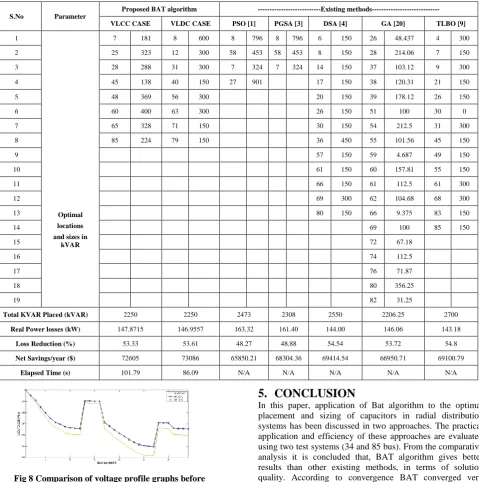
[image:5.595.74.278.377.536.2]For the second approach i.e. VLCC(Variable locations and continues sizes of capacitors) case, the locations and sizes of capacitors obtained by Bat algorithm are 7, 25, 28, 45, 48, 60, 65, 85 and 181, 323, 288, 138, 369, 400, 328, 224 kVAR respectively, with a active power loss of 147.8715 kW and annual net savings of $72605. The power loss convergence characteristic of the test system for Bat algorithm has been given in Fig. 7. From the observation of simulation results, it is noticed that annual net savings for proposed algorithm is comparatively high than other algorithms.
Fig 7 Comparison of algorithm for VLCC & VLDC with respect to active power loss convergence characteristics for
34-bus test system
4.3
Convergence Analysis and Voltage
Profile Graphs
Table 4 Comparison of results for 85-bus system
Fig 8 Comparison of voltage profile graphs before capacitor placement and after capacitor placement for
34-bus system
Fig 9 Comparison of voltage profile graphs before capacitor placement and after capacitor placement for
85-5.
CONCLUSION
In this paper, application of Bat algorithm to the optimal placement and sizing of capacitors in radial distribution systems has been discussed in two approaches. The practical application and efficiency of these approaches are evaluated using two test systems (34 and 85 bus). From the comparative analysis it is concluded that, BAT algorithm gives better results than other existing methods, in terms of solution quality. According to convergence BAT converged very quickly due to simple evolution process.. In fact, for any optimization algorithm parameter tuning plays an important role in the performance of the algorithm. From the results; BAT are proved to be promising tools to solve such type of constrained objective optimization problems. So, it may be concluded that the solution given by BAT to the specific problem is best so far. Thus the results obtained pave the way for new and promising research area, utilizing BAT algorithms with proper modifications, may give better results with high convergence speed.
6.
REFERENCES
[1] Prakash K, Sydulu M. Particle swarm optimization based capacitor placement on radial distribution systems. IEEE power engineering society general meeting; 2007, pp. [2] Kalyuzhny A, Levitin G, Elmakis D, Haim HB. System S.No Parameter
Proposed BAT algorithm ---Existing methods---
VLCC CASE VLDC CASE PSO [1] PGSA [3] DSA [4] GA [20] TLBO [9]
1
Optimal locations
and sizes in kVAR
7 181 8 600 8 796 8 796 6 150 26 48.437 4 300
2 25 323 12 300 58 453 58 453 8 150 28 214.06 7 150
3 28 288 31 300 7 324 7 324 14 150 37 103.12 9 300
4 45 138 40 150 27 901 17 150 38 120.31 21 150
5 48 369 56 300 20 150 39 178.12 26 150
6 60 400 63 300 26 150 51 100 30 0
7 65 328 71 150 30 150 54 212.5 31 300
8 85 224 79 150 36 450 55 101.56 45 150
9 57 150 59 4.687 49 150
10 61 150 60 157.81 55 150
11 66 150 61 112.5 61 300
12 69 300 62 104.68 68 300
13 80 150 66 9.375 83 150
14 69 100 85 150
15 72 67.18
16 74 112.5
17 76 71.87
18 80 356.25
19 82 31.25
Total KVAR Placed (kVAR) 2250 2250 2473 2308 2550 2206.25 2700
Real Power losses (kW) 147.8715 146.9557 163.32 161.40 144.00 146.06 143.18
Loss Reduction (%) 53.33 53.61 48.27 48.88 54.54 53.72 54.8
Net Savings/year ($) 72605 73086 65850.21 68304.36 69414.54 66950.71 69100.79
distribution system. Elect Power Syst. Res, 2000; 56(1), pp.51–60.
[3] Rao RS, Narasimham SVL, Ramalingaraju M. Optimal capacitor placement in a radial distribution system using Plant Growth Simulation Algorithm. Int. J Elect Power Energy Syst., 2011; 33(5), pp.1133–39.
[4] Raju MR, Murthy KVSR, Avindra KR. Direct search algorithm for capacitive compensation in radial distribution systems. Int J Elect Power Energy Syst., 2012; 42(1), pp.24–30.
[5] Gallego RA, Monticelli AJ, Romero R. Optimal capacitor placement in radial distribution networks using tabu search. IEEE Trans Power Syst., 2001;16(4), pp.630–7
[6] Sirjani R, Mohamed A, Shareef H. Optimal capacitor placement in a radial distribution system using harmony search algorithm. J Appl. Sci., 2010; 10(23), pp.2996-2996.
[7] Chang CF. Reconfiguration and capacitor placement for loss reduction of distribution systems by ant colony search algorithm. IEEE Trans Power Syst., 2008, 23(4), pp.1747–55
[8] Chiang HD, Wang JC, Cockings O, Shin HD. Optimal capacitor placements in distribution systems: part 1: a new formulation and the overall problem. IEEE Trans Power Deliv, 1990, 5(2), pp.634–42.
[9] Sneha S, Provas Kumar R. Optimal capacitor placement in radial distribution systems using teaching learning based optimization. Int. J Elect Power Energy Syst., 2004, 54, pp. 387–398.
[10]Sirjani R, Azah M, Shareef H. Heuristic optimization techniques to determine optimal capacitor placement and sizing in radial distribution networks: a comprehensive review. PRZEGLA˛ D ELEKTROTECHNICZNY (Elect. Rev.), 2012, 88(7a), pp.1–7
[11]Yang XS. A new metaheuristic bat-inspired algorithm. In: J. Gonzalez, R., et al. (Eds.), Nature Inspired Cooperative Strategies for Optimization (NICSO 2010), 2010, SCI 284, pp. 65–74
[12]Abdellatif H, Khaled Z. Improved algorithm for radial distribution networks load flow solution. Int. J Elect. Power Energy Syst., 2011; 33(3), pp.508–14.
[13]Iwamoto S, Tamura Y. A load flow calculation method for ill-conditioned power systems. IEEE Trans Power Apparat Syst., 1981, 100(4), pp.1736–43.
[14]Ghosh S, Das D. Method for load flow solution of radial distribution network. IEE Proc Gene. Trans. Distr., 1999, 146(6), pp.641–8.
[15]Singh Sachin, Ghose T. Improved radial load flow method. Int. J Elect. Power Energy Syst. 2013, 44(1), pp.721–7
.
[16]Augugliaro A, Dusonchet L, Favuzza S, Ippolito MG, Riva Sanseverino E. A backward sweep method for power flow solution in distribution networks. Int. J Elect. Power Energy Syst., 2010, 32(4), pp.271–80.
[17] Paulo M.D, Oliveira D J. The standard backward/forward sweep power flow.
[18]A Attia A, El-Fergany A, Almoataz Y, Abdelaziz, Capacitor placement for net saving maximization and system stability enhancement in distribution networks using artificial bee colony-based approach. Electrical Power and Energy Systems, 2014, 54, pp. 235–243 [19]Chis M, Salama MMA, Jayaram S. Capacitor placement
in distribution system using heuristic search strategies. IEE Proc Gene. Tran. Dist. 1997, 144(3), pp. 225–30 [20]Sydulu M, Reddy VVK. Index and GA based optimal
location and sizing of distribution system capacitors. In: IEEE power engineering society general meeting 2007, 24th–28th June, pp. 1–4.
[21]Ali E, Boudour M, Rabah G. New evolutionary technique for optimization shunt capacitors in distribution networks. J Elect. Eng, 2011, 62(3), pp. 163–
7.