Munich Personal RePEc Archive
A review of studies mapping (or cross
walking) from non-preference based
measures of health to generic
preference-based measures
Brazier, JE and Yang, Y and Tsuchiya, A
The University of Sheffield
2008
Online at
https://mpra.ub.uni-muenchen.de/29808/
HEDS Discussion Paper 08/02
Disclaimer:
This is a Discussion Paper produced and published by the Health Economics and Decision Science (HEDS) Section at the School of Health and Related Research (ScHARR), University of Sheffield. HEDS Discussion Papers are intended to provide information and encourage discussion on a topic in advance of formal publication. They represent only the views of the authors, and do not necessarily reflect the views or approval of the sponsors.
White Rose Repository URL for this paper: http://eprints.whiterose.ac.uk/11027/
Once a version of Discussion Paper content is published in a peer-reviewed journal, this typically supersedes the Discussion Paper and readers are invited to cite the published version in preference to the original version.
Published paper
Brazier J, Yang Y, Tsuchiya A, Rowen DL. A review of studies mapping (or cross walking) from non-preference based measures of health to generic preference-based measures. European Journal of Health Economics [in press].
H
H
e
e
a
a
l
l
t
t
h
h
E
E
c
c
o
o
n
n
o
o
m
m
i
i
c
c
s
s
a
a
n
n
d
d
D
D
e
e
c
c
i
i
s
s
i
i
o
o
n
n
S
S
c
c
i
i
e
e
n
n
c
c
e
e
D
D
i
i
s
s
c
c
u
u
s
s
s
s
i
i
o
o
n
n
P
P
a
a
p
p
e
e
r
r
S
S
e
e
r
r
i
i
e
e
s
s
No. 08/02
A review of studies mapping (or cross walking)
from non-preference based measures of health to
generic preference-based measures
John E. Brazier, Yaling Yang, Aki Tsuchiya
Health Economics and Decision Science (HEDS), School of Health and Related
Research (ScHARR), University of Sheffield, UK
Corresponding author: John E Brazier
Health Economics and Decision Science, School of Health and Related Research University of Sheffield
Regent Court 30 Regent Street Sheffield
S1 4DA UK
Tele: UK – (0) 114 222 0715 Fax: UK – (0) 114 222 4095
Funding
The study was funded by a grant from The Office for Health Economics, UK.
INTRODUCTION
A common approach to assessing the outcomes of health care is to obtain patient reported
descriptions of health status across various dimensions and then to apply a standardised
numerical scoring system. There are many different measures of health, including several
hundred condition specific measures of health designed for use in specific medical
conditions or groups of condition (Spilker et al, 1990), and a number of generic measures
designed to cover the core dimensions of health that are relevant across all medical
conditions. Health measures can also be distinguished in terms of whether they generate
a profile of dimension scores or a single index and if they produce a single index,
whether or not the index has been derived using simple summation of item scores or by
using preference weights obtained from patients or the general public (known as
preference-based measures or multi-attribute utility scales).
Patient reported measures of health have become widely used in clinical trials as primary
or secondary outcomes. There is little agreement on which specific instruments should
be used for this purpose. For assessing clinical efficacy, there is disagreement on
whether to use a generic or condition specific measure, and between condition specific
measures there is often disagreement amongst clinical researchers on the most
appropriate instrument. As a result clinical trials around the world often use different
measures for the same patient groups. This presents a substantial barrier to the synthesis
of evidence.
Preference-based measures of health are necessary to generate the health state utility
values required to calculate QALYs for assessing the cost effectiveness of interventions.
These are usually based on generic instruments (e.g. EQ-5D) that permit comparisons
between patient groups, though there are examples of condition specific preference-based
measures (Revicki et al 1998). Even for assessing clinical effectiveness, it could be
argued that a preference-based index is necessary to deal with trade-offs made between
outcomes. There has been a debate amongst health economists about the most appropriate
preference-based generic measure to use in cost effectiveness analyses. Whilst the
2002), QWB (Kaplan and Andersen, 1988), SF-6D (Brazier et al, 2002) and others
continue to be used. However, different preference-based measures have been shown to
generate different values on the same sample of patients (Marra et al, 2005; Feeny et al,
2004; Barton et al, 2004). Furthermore, many key clinical trials on the efficacy of new
interventions do not have a generic measure and the recent FDA Guidance on using
Patient Reported Outcome measures seems to further discourage the use of generic
measures for pivotal trials designed for seeking licensing approval (FDA, 2006). This
presents a barrier to populating economic models with the best evidence on effectiveness.
One solution to the problem of having different measures of health has been to try to
‘map’ between measures. This can be done, for instance, by using the judgement of
‘experts’. The use of judgement based methods, however, has been criticised for its
arbitrariness (Coast, 1992). Furthermore, it does not involve any attempt to estimate the
uncertainty around the mapping. The validity of such mappings is questionable and the
only way to test them is by empirically comparing the judgements against real data.
Ultimately, a better approach is to estimate the relationship between the measures
empirically by statistical inference. This approach involves estimating the relationship
between a health measure and a generic preference-based measure (also known as
‘cross-walking’ or estimating exchange rates between instruments) and requires the two
measures to be administered on the same population.
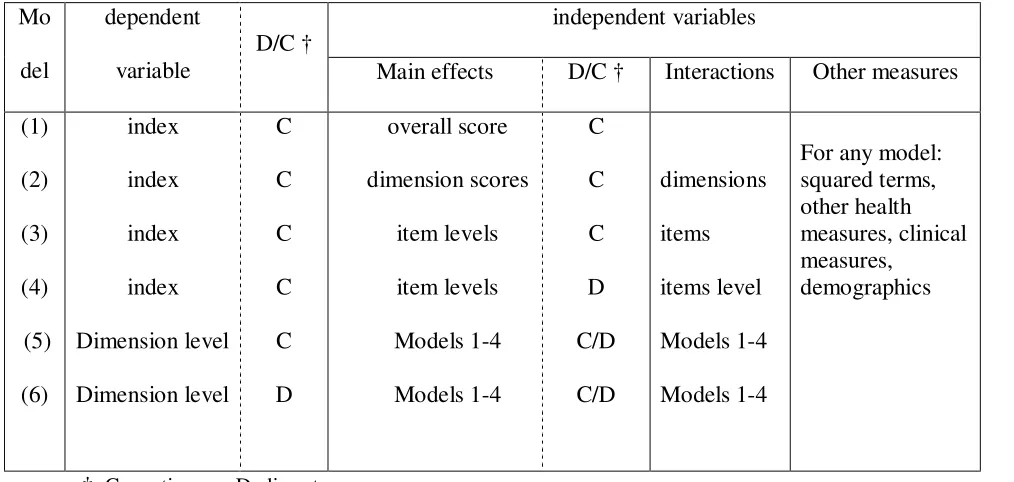
There are different estimation models that can be used in mapping studies (see Table 1,
adapted from Tsuchiya et al, 2002). Model (1) is the simplest additive model, which
regresses the target measure (such as the EQ-5D) onto the total score of the starting
measure (e.g. SF-36, HAQ, HAD etc.). This is also the most limiting specification since it
assumes that the dimensions of the starting measure are equally important; all items carry
equal weight; and response choices to each item lie on an interval scale (so for example
the intervals between ‘all of the time’, ‘most of the time’, ‘some of the time’, ‘a little of
the time’ and ‘none of the time’ are equal). These assumptions can be relaxed by
modelling either dimension scores (model 2), item scores (model 3), or item responses
treated as continuous variables and item responses are modelled as discrete dummy
variables (e.g. ‘all the time’ is one, other wise zero, and so forth). Using item responses
can, however, result in a large number of independent variables (over 100 for SF-36) and
so it may be useful to be selective in the items included in the model. In this case, items
can be excluded for having coefficients that are non-significant or counter-intuitive in
their sign prior to estimating a model with item responses (model 4).
The assumptions of a simple additive model can be relaxed by including squared terms
for dimension or item scores and interaction terms. Again these can generate a large
number of variables and so researchers may also limit them to variables with significant
main effects, at least for the item level models. A more complex approach to modelling
the relationship would be to estimate separate models for each dimension of the target
instrument (such as the 5 EQ-5D dimensions) (i.e. models 5 and 6). For the EQ-5D this
creates a dependent variable that can be treated as continuous (model 5), but is more
accurately treated as a discrete variable (model 6). These can be estimated using any of
the previous 4 specifications.
This paper presents a systematic review of current practice in mapping between
non-preference based measures and generic non-preference-based measures. It reviews the studies
identified by a systematic search of the published literature and the grey literature. This
review seeks to address the feasibility and overall validity of this approach, the
circumstances when it should be considered and to bring together any lessons for future
mapping studies.
LITERATURE REVIEW Search
A systematic literature search was carried out. Based on a few core papers identified by
the research group a citation search was carried out using the Science Citation Index,
Social Science Citation Index and Web of Science citation database. The citation search
was undertaken both forwards and backwards. The forward search ensures that all papers
by the core papers are reviewed. A key words search was also undertaken using the titles
and abstracts in 15 electronic bibliographic databases covering biomedical and
health-related sciences, social science, and the grey literature. Key words were combinations of:
‘mapping / cross walking’ and ‘EQ-5D / SF-36 / HUI / QWB / NHP / SIP / health status /
health profile’. The following databases were searched: Cinahl, Cochrane Central
Database of Controlled Trials (CENTRAL), Cochrane Database of Systematic Reviews
(CDSR), DH-Data, Embase, Kings Fund, Medline, Medline Plus, NHS Database of
Abstracts of Reviews of Effectiveness (DARE), NHS Economic Evaluations Database
(NHS EED), NHS Health Technology Assessment (HTA) Database, OHE Health
Economic Evaluations Database (HEED), Science Citation Index, Scopus, Social
Sciences Citation Index, UK HESG. Where possible, the searches were not restricted by
publication type, language, or date of publication. These searches were supplemented by
contacting known experts in the field.
Review
The overall aims of the review were to examine the feasibility and validity of the
mapping approach, the circumstances when it should be considered and to bring together
any lessons for future mapping studies. These questions were addressed by extracting
data on 56 items listed in Table 2 on each model presented. These items cover a
description of the instruments used, the population completing the instruments, model
specification, methods of estimation, model fit and predictive performance within and
outside the estimation sample. In addition any important comments from the author(s)
were noted. Data extraction on all 28 papers was undertaken by a member of the
research team and summarized in Excel using headings shown in Table 2 that had been
agreed by all team members.
Findings Studies included
One thousand three hundred and eleven papers were identified. The number of relevant
papers was reduced to 34 based on a review of abstracts. Among these 34 papers, 3
authors). Another 3 papers were excluded because they were not based on empirical
methods. This left a total of 28 papers for review that covered 119 different models. A
30-page Appendix tabulating all the estimation models is available on request from the
corresponding author.
Details of the 28 studies are presented in Table 3. Mapping between measures is a new
research area with most papers (26 out of 28) published or produced after 2000, with the
remaining 2 papers published in 1997 and 1998. Out of the 28 papers, 20 have been
published in non-clinical journals including: Medical Decision Making (6 papers), Value in Health (3 papers), Health Economics (2 papers), Medical Care (2 papers), Quality of Life Research (2 papers); and the others (5 papers) were published in specific clinical journals. Out of the remaining 8, 3 were conference papers (with sufficient detail), 2 were
published discussion papers and 3 were unpublished project reports.
General description of studies
Twenty-seven out of the 28 studies involved the mapping of a non-preference based
measure of health (the “starting measure”) onto to a preference-based measure of health
(the “target measure”); the exception being a study mapping between two
preference-based measures (SF-6D to EQ-5D). The most popular target measure used for mapping
was the EQ-5D with 16 studies (15 used the UK MVH value set and one used the US
value set), followed by HUI2/HUI3 with 6 studies, SF-6D with 5 studies, and QWB with
one study. On the right hand side of the mapping equation, the most widely used starting
measures were SF-12 (n=7) and SF-36 (n=5). The remainder consisted of various
condition specific instruments intended to capture patient-perceived quality of life
covering asthma, rheumatoid arthritis, osteoarthritis, overactive-bladder, irritable bowl
syndrome, intermittent claudication, dental, dyspepsia, obesity, cancer and heart disease.
One study mapped clinical measures onto EQ-5D in angina patients.
The sample size (number of people giving responses)used in the mapping studies ranged
from 98 to 23,547. Clinical trials were the most common source of data. Respondents
studies used large panel survey data, such as the US Medical Expenditure Panel Survey
and the Health Survey for England.
Model specification
The most widely used was the additive model. Most studies used total, dimension and
item scores as the independent variables and some entered dummy variables representing
the level of each item. Out of the 119 models reviewed: 33 models included interaction
terms; 19 models incorporated transformations of the main effect such as square terms; 6
models included other health measures; 15 models included clinical measure; and 34
models considered respondents’ personal characteristics, such as age, gender, race and
income. Quite modest or negligible improvements were achieved from increasing model
complexity. Moving from total to dimension, to item level models or adding interaction
and other terms also improved the model fit. Only rarely was a major impact on the range
of scores being predicted and goodness of fit. One example is the mapping between
IBDQ to EQ-5D where R2 increased from 0.45 to 0.69 after incorporating squared terms
of dimension scores (Buxton, et al, 2007). Furthermore, some studies included additional
variables, such as other clinical indicators (Grootendorst et al, 2007; Buxton et al, 2007)
and demographic variables (Brazier et al, 2004). Only 4 studies used dimension scores or
responses as the target measure and in all cases these were the 5 dimensions of the
EQ-5D (Tsuchiya et al, 2002; Edlin et al, 2002, Gray et al, 2004; 2006).
Estimation
Most mapping functions have been estimated by OLS, though some researchers have
explored Generalised Linear Models with random effects, Adjusted Least Square
Regression Model (ALS), Tobit Model, Censored Least Absolute Deviation Model
(CLAD) and non-linear models. For models with a discrete dependent variable (e.g.
EQ-5D dimension level) then researchers have used Ordinal Logit and Multi-nomial Logit
regression models. These latter models generate a probability distribution across
dimension levels and there is a subsequent stage of imputing a single level for calculating
highest probability level (Tsuchiya et al, 2002). In a recent study, researchers used a
Monte Carlo procedure to select from the distribution (Gray et al, 2006).
Performance
Studies commonly report the model’s explanatory power in terms of adjusted R-Squared.
Overall, models mapping a generic onto a generic preference-based measure (e.g.
SF-12/36 to EQ-5D, NHP to SF-6D, and SF-36 to QWB) achieved an R2 or adjusted R2 of
more than 0.5 within sample. There was little reduction in the goodness of fit from testing
the mapping function on samples randomly selected from the same data set as the
estimation samples. The fit of functions mapping from condition specific to generic
measures is more variable. One of the poorest fitting models was for the Overactive
Bladder Questionnaire (OABq) onto the SF-6D which achieved an adjusted R2 of 0.17
(Roberts et a, 2005). One of the better models was between the International Weight
Quality of Life Questionnaire (IWQoL) and the SF-6D that managed 0.51 (Brazier et al,
2004). Figure 1 shows the distribution of R2 statistics for generic to generic measures and
condition-specific to generic measures. Explanatory power, however, has little value in
comparing models estimated using different methods of estimation (see below for details).
Authors have also assessed performance in terms of the sign, significance and
consistency of the estimated coefficients. At least for main effects, coefficients should be
negative (i.e. the more severe the health problem the lower the preference index) and the
more severe the item levels in model (4) the larger the negative coefficient. However, for some descriptive systems there is some ambiguity regarding the ordering of statements
(e.g. between ‘your health limits you a little in bathing and dressing’ versus ‘your health
limits you a lot in moderate activities’ in the SF-6D). Furthermore, interaction terms
would interfere with these orderings and so are not reliable. For some models, item
levels were merged to remove inconsistencies.
Explanatory power is not a useful basis for assessing model performance, since the
purpose of mapping functions is to predict values in other data sets. A better method
observed values at either the aggregate level by calculating Mean Error (ME) or at the
individual level by calculating the Mean Absolute Error (MAE) or the Root Mean
Squared Error (RMSE). Models can also be compared in terms of the numbers or
proportion of absolute errors greater than some cut-off (e.g. 0.05 or 0.10) or within 5% or
10% of the observed value at the individual level. The mean error for the 119 models
ranged from 0.0007 to 0.042 and was nearly zero for the OLS models (as would be
predicted). MAE at the individual level ranged from 0.0011 to 0.19 and RMSE ranged
from 0.084 to 0.2. These typically represented a percentage error of up to 15% of the
overall scale of the dependent variable.
The normality of prediction errors by the Jarque-Bera test, but this is not used in OLS
models since these are unbiased by definition. What is potentially more important is the
pattern of errors across the range of the dependent variable. Only a few studies have
examined this and some of those have found that the degree of error is not evenly
distributed across the scale of the dependent variable. This problem was shown in two
studies, one using a condition specific (Tsuchiya et al, 2002) and the other a generic
instrument (Gray et al, 2006) as the start measure. Overall, the level of error is far greater
at the lower (or severer) end. Gray et al (2006), for example, found that the MAE varied
from 0.065 to 0.109 for EQ-5D index values from 0.7 to 1.00, but for values less than 0.7
the MAE was over 0.30. Scatter plots have found that there was a tendency for EQ-5D
models to over predict values at the lower end and under predict at the upper end of the
EQ-5D. This was despite the inclusion of interaction and squared terms. These papers
also found that the predicted values from the mapping functions tend to have lower levels
of variance than the original observed values.
Model performance is often assessed on the same data set as that used to estimate the
model and referred to in the literature as within-sample testing. Another strategy which
was occasionally used is to estimate the model on a sub-sample of the full data (the
‘estimation’ sample) and then to test the model on the remaining sample (the ‘validation’
the models. However, these tests do not examine the performance of the model in truly
independent samples nor did they examine them across subgroups.
DISCUSSION
This review found 28 studies reporting a total of 119 different models. The studies
undertook a range of different modelling methods, but the most common was a simple
additive model with the preference-based index as the dependent variable and the
independent variables being dimension or item scores and estimated by OLS. More
complex specifications were examined that included interaction and squared terms,
non-health variables (e.g. socio-demographics) and different methods of estimation. These
studies clearly show that this approach is feasible, but the validity of the models in terms
of goodness of fit and error of prediction at the individual level was highly variable.
Explanatory power ranged from 0.17 to 0.51 and RMSE from 0.084 to 0.2. For those
studies that examined the pattern of the error, they found the RMSE increased with the
severity of the condition while mappings from SF-12 or SF-36 onto EQ-5D.
The question of whether mapping is a valid method for generating preference-based
indices depends on the circumstances. In a situation where the analyst does not have any
other data, some of the poorer models might still be acceptable. This may happen in
economic evaluations alongside clinical trials where a non-preference-based condition
specific measure has been used or where an analyst is seeking to synthesise data across
studies and does not want to limit the evidence base to those studies using a particular
preference-based measure. However, the potential degree of uncertainty and likely error
must be fully explored. At the individual level, the RMSE was often quite high and
larger than published minimally important differences for these measures of between
0.041 and 0.071 (Walters and Brazier, 2004). However, the purpose of mapping functions
is to predict differences across groups of patients or differences between arms over time
in clinical trials, and not individual level index values. Work undertaken after this review
was completed indicates that the size of the errors in predicting mean EQ-5D indices for
patient groups from SF-36 data may be quite modest (Ara and Brazier et al, 2007).
problems may have gains under-estimated by the mapping function on the basis of
existing evidence relating SF-36 to EQ-5D. Most published studies have not even
examined whether such systematic patterns exist in the predictions of their models. This
may have important implications for cost effectiveness.
For prospective decisions about the instruments to use in future studies the decision
maker also needs an estimate of the error relevant to the population of interest (e.g.
disease, severity and size of sample) to decide whether the error in these models is
acceptable. The likely implications of any error in the estimation of differences or
changes over time must be weighed against the additional cost of using a generic
preference-based measure directly in the study or application being considered.
For mapping from conditions specific measures the degree of error tended to be larger,
although it varied across patient groups and/or conditions. However, the use of mapping
to derive preference-based generic indices from condition specific measures raises a more
fundamental concern. Mapping assumes that the preference-based target measure covers
all important aspects of health of the non-preference-based start measure. In other words,
the strength of the mapping function depends on the degree of overlap between the two
descriptive systems. Where there are important dimensions of one instrument not
covered by the other, then this may undermine the model. Where the generic measure
does not cover certain dimensions of the non-preference based condition specific
measures that are regarded as important this could be an important weakness. EQ-5D
does not, for example, contain a dimension for energy or vitality. So it is not surprising
that in published mapping functions from any of the SF instruments to EQ-5D, energy
has a small and non-significant coefficient. Another source of weakness can arise from
differences in the severity range covered for given health dimension. The SF-36 physical
functioning dimension, for example, has been demonstrated to suffer from floor effects
(i.e. large numbers of patients at, or are near, the lowest score) and so it is not likely to be
as good at predicting at the lower end. These problems can be more dramatic in condition
Where generic measures are not regarded as appropriate for the condition, either due to a
lack of relevance or insensitivity, then mapping from the condition specific measure onto
a generic measure does not solve this problem. Indeed the mapping function is likely to
perform poorly, as was found in the case of the Over-Active Bladder Questionnaire
(Roberts et al, 2005). An alternative approach in these circumstances is to estimate a
preference-based index directly from the condition specific measure, as has been done
with the King’s Health Questionnaire (Brazier et al, 2007) or the Overactive Bladder
Questionnaire (Yang et al, 2007).
There are important lessons to be learnt about the methodology for undertaking mappings.
The first is that the population used in the mapping process should cover the range of
clinical and demographic characteristics of the sample on which the mapping function is
ultimately going to be applied. In terms of model specification, most studies found that a
simple additive model with an index score as the dependent variable and main effects of
either total or dimension scores as independent variables, performed nearly as well as
those for more complex models. Greater complexity came with little gain in most cases,
but small gains come at little cost in terms of computing time.
The most common method of estimation was OLS. There is a concern in the literature
that the standard OLS regression models under-estimate the level of uncertainty in the
estimates (Briggs et al, 2004). This results from a centering around the mean caused by
assuming that respondents who complete the start measure (e.g. SF-36) in the same way
would also complete target instrument in the same way (EQ-5D). The result is a lower
variance around the mean estimates. The importance of this problem depends on the way
the data are going to be used. In large pooled analyses this may be of little importance.
More of a problem is the systematic pattern referred to earlier of over-predicting at the
lower end and under-predicting at the upper end may be partly a result of this. This
problem still existed for the multinomial model used to predict the probability of
response across the dimension levels of the EQ-5D. There may be other solutions to the
problem, such as the application of a Bayesian approach (as has been successfully used in
This review addressed a number of questions about the use of functions to map between
non-preference based and generic preference-based measures. It found a surprisingly
large body of literature. The performance of the mappings functions in terms of
goodness of fit and prediction was variable and so it is not possible to generalise across
instruments. Performance is related to the degree of overlap in content between the
instruments being mapped. The current literature is also limited in the way these models
have been tested, since most testing has focused on their use at the individual level and
yet the main purpose of these functions is to predict mean values for subgroups of
patients (such as arms of trials). Further work is required to test the accuracy of these
functions in more relevant contexts and over a larger range of instruments. The use of
mapping functions is always a second best solution to using a preference-based generic
measure in the first place (or arguably using preference-weighted condition specific
measure), but it is often necessary for pragmatic reasons and so this remains an important
of area of research.
Acknowledgements
This study was funded by the Office of Health Economics. John Brazier is funded by the
UK Medical Research Council. We would like to thank Colin Lynch and Anna Wilkinson
for conducting the literature searches. We are also grateful for comments from
colleagues at the University of Sheffield, including Tony O’Hagan and Jennifer Roberts,
and to those members of the UK Health Economists’ Study Group, in particular Jacquie
Brown, and to members of the EuroQol Group who replied to our request for mapping
References
Ara R, Brazier JE. Deriving an algorithm to convert the 8 mean SF-36 dimension scores
into a mean EQ-5D preference-based score from published studies when patient level
data are not available. Health Economics and decision Science Discussion Paper,
University of Sheffield 2007.
Barton GR, Bankart J, Davis AC, Summerfield QA (2004). Comparing utility scores before
and after hearing-aid provision. Appl Health Econ Health Policy vol. 3:(2), pp. 103-105. Bansback N, Marra C, Tsuchiya A, Anis A, Guh D, Hammond T, & Brazier J (2007 in
press) Using the Health Assessment Questionnaire to estimate preference-based single
indices in patients with Rheumatoid Arthritis. Arthritis Care Research.
Bartman BA, Rosen MJ, Bradham DD, Weissman J, Hochberg M, & Revicki DA (1998)
Relationship between health status and utility measures in older claudicants. Quality of Life Research 7 , 67-73.
Brazier J, Roberts J, Deverill M (2002). The estimation of a preference-based single index
measure for health from the SF-36. Journal of Health Economics 21(2):271-292.
Brazier JE, Ratcliffe J, Tsuchiya A, Solomon J. Measuring and valuing health for economic evaluation. Oxford: Oxford University Press 2007.
Brazier J, Kolotkin RL, Crosby RD, & Williams GR. (2004) Estimating a
preference-based single index for the impact of weight on quality of life-Lite (IWQOL-Lite)
instrument from the SF-6D. Value in Health 7, 484 - 496.
Brazier J, Roberts J, Tsuchiya A, & Busschbach J (2004). A comparison of the EQ-5D
and SF-6D across seven patient groups. Health Economics 13, 873-884.
Brennan,D.S. & Spencer,A.J. (2006) Mapping oral health related quality of life to generic
health state values. BMC Health Services Research 6.
Briggs A, Clark T, Wolstenholme J, & Clarke P (2003) Missing...presumed at random:
cost-analysis of incomplete data. Health Economics 12, 377-392.
Bryan S, Longworth L. (2005) Measuring health related quality utility: why the disparity
between EQ-5D and SF-6D? The European Journal of Health Economics; 6(3):253-260. Buxton MJ, Lacey LA, Feagan BG, & Oliver R (2007) Mapping from Disease-specific
measures to utility: an analysis of the relationship between the Inflammatory Bowel
Disease Questionnaire and Crohan's Disease Activity Index in Crohn's disease and
measures of utility. Value in Health 10, 1-7.
Buxton,M., Lacey,L., Niecko,T., Miller,D., & Townsend,R. (2005) Mapping from
disease specific measures to utility: Algorithms for estimating EQ-5D and SF-6D values
from the inflammatory bowel disease questionnaire in patients with Crohn's disease.
Value in Health 8, A3-A4.
Chancellor JVM, Coyle D, & Drummond MF (1997) constructing heaLth state
preference values from descriptive quality of life outcomes: mission impossible? Quality of Life Research 6, 159-168.
Clayson D.J., Briggs A.H., Sculpher M., & De Hert M. (2004) Mapping utility scores
from the EQ-5D and SF-6D onto the schizophrenia quality of life scale. Value in Health 7, 277.
Coast J (1992). Reprocessing data to form QALYs. British Medical Journal 305, 87-90. Dixon S, McEwan P, & Currie CJ (2003) estimating the health utility of treatment in
Dobrez D, Cella D, Pickard AS, Lai JS, & Nickolov A (2007 in press) Estimating of
patient preference-based utility weights form the Functional Assessment of cancer
therapy - general. Value in Health.
Edlin R, Tsuchiya A, & Brazier J (2002) Mapping the Nepean Dyspepsia Index and Patient self-assessed (clinical) data to SF-6D preference weights. Unpublished manuscript
Edlin R, Tsuchiya A, & Brazier J (2002) Mapping the Minnesota Living with Heart Failure Questionnaire to the EQ-5D index. Unpublished manuscript
Epstein D & Manca A (2003) A comparison of the SF-6D and EQ-5D: How does the choice of health outcome measure matter. Health Economists Studying Group Meeting (HESG), July 2003.
Feeny D, Wu L, Eng K (2004). Comparing short form 6D, standard gamble, and health
utilities index Mark 2 and Mark 3 utility scores: Results from total hip arthroplasty patients.
Quality of Life Research 13, 1659-1670.
Franks P, Lubetkin EI, Gold MR, & Tancredi DJ (2003) Mapping the SF-12 to
preference-based instruments. Medical Care 41, 1277-1283.
Franks P, Lubetkin EI, Gold MR, Tancredi DJ, & Jia H (2004) Mapping the SF-12 to the
EuroQol EQ-5D Index in a National US sample. Medical Decision Making 24, 247-254. Fryback,D.G., Lawrence,W.F., Martin,P.A., Klein,R., & Klein,B.E.K. (1997) Predicting
quality of well-being scores from the SF-36: Results from the Beaver Dam Health
Outcomes Study. Medical Decision Making 17, 1-9.
Gray A, Clarke P, & Rivero-Arias O (2004) Estimating the association between SF-36
responses and EQ-5D utility values by direct mapping. Health Economists Studying
Gray A, Rivero-Arias O, & Clarke PM (2006) Estimating the association between SF-12
responses and EQ-5D utility values by response mapping. Medical Decision Making 26, 18-29.
Grootendorst P, Marshall D, Pericak D, Bellamy N, Feeny D, & Torrance GW (2007) A
model to estimate Health Utilities Index Mark 3 Utility scores form WOMAC Index
scores in the patients with Osteoarthritis of the knee. The journal of Rheumatology 34, 534-542.
Kaambwa B, Bryan S, Barton P, Parker H, & Martin G (2006) Relationship between the
EuroQol-5d and Barthel Index - examining the use of proxy outcome measures for older
people. Health Economists Studying Group Meeting (HESG), July 2006, York.
Lauridsen J, Christiansen T, & Hakkinen U (2004) Measuring inequality in self-reported
helath - discussion of a recently suggested approach using Finnish data. Health Economics 13, 725-732.
Lawrence,W.F. & Fleishman,J.A. (2004) Predicting EuroQoL EQ-5D preference scores
from the SF-12 health survey in a nationally representative sample. Medical Decision Making 24, 160-169.
Longo M, Cohen D, Hood K, & Robling M (2000) Deriving an 'Enhanced' EuroQol from SF-36. Health Economists Studying Group Meeting (HESG), July 2000, Nottingham. Longworth L, Buxton MJ, Sculpher M, & Smith AH (2005) Estimating utility data from
clinical indicators for patients with stable angina. European Journal of Health Economics
6, 347-353.
Lorgelly PK (2001) Mapping SF-36 TO utilities: How can it be done? Health Economists Studying Group Meeting (HESG), City University, London.
Marra CA, Woolcott JC, Kopec JA, Shojania KI, Offer R, Brazier JE, Esdaile JM, Anis AH
the EQ-5D) and disease-specific instruments (the RAQoL and the HAQ) in rheumatoid
arthritis. Social Science & Medicine 60, 1571-1582.
Mujica-Mota R., Bagust A., Haycox A., Dhawan R., & Dubois D. (2004) Mapping
health-related quality of life (HRQOL) measurements into generic utility measures
(EQ-5D): A case study with bortezomib (VELCADE). Value in Health 7, 693.
Nichol,M.B., Sengupta,N., & Globe,D.R. (2001) Evaluating quality-adjusted life years:
estimation of the Health Utility Index (HUI2) from the SF-36. Medical Decision Making
21, 105-112.
O'Brien,B.J., Spath,M., Blackhouse,G., Severens,J.L., Dorian,P., & Brazier,J. (2003) A
view from the bridge: Agreement between the SF-6D utility algorithm and the Health
Utilities Index. Health Economics 12, 975-981.
Revicki DA, Leidy NK, Brennan-Diemer F, Sorenson S, Togias A (1998). Integrating
patients’ preferences into health outcomes assessment: the multi-attribute asthma symptom
utility index. Chest 114(4): 998-1007.
Richard J, Hall J, & Salkeld G (1996) The measurement of utility in multiphase health
states. International journal of health technology assessment in health care 12, 151-162. Roberts J, Brazier J, & Tsuchiya A (2005) Mapping the overactive bladder questionnaire to SF6D indices stage2: Final results. Unpublished manuscript
Sengupta,N., Nichol,M.B., Wu,J., & Globe,D. (2004) Mapping the SF-12 to the HUI3
and VAS in a managed care population. Medical Care 42, 927-937.
Sullivan,P.W. & Ghushchyan,V. (2006) Mapping the EQ-5D index from the SF-12: US
general population preferences in a nationally representative sample. Medical Decision Making 26, 401-409.
Tsuchiya A (2006) The estimation of a preference-based single index for the IBS-QoL. Unpublished manuscript.
van Doorslaer E & Jones AM (2003) Inequalities in self-reported health: validation of a
new approach to measurement. Journal of Health Economics 22, 61-87.
Walters S, Brazier JE (2005). Comparison of the minimally important difference for two
health state measures: EQ-5D and SF-6D. Quality in Life Research 14:1523-1532.
Wu,A.W., Huang,I.C., Gifford,A.L., Spritzer,K.L., Bozzette,S.A., & Hays,R.D. (2005)
Creating a crosswalk to estimate AIDS clinical trials group quality of life scores in a
nationally representative sample of persons in care for HIV in the United States. HIV Clinical Trials 6, 147-157.
Wu,E., Mulani,P., Farrell,M.H., & Sleep,D. (2006) Mapping Fact-P and Eortc Qlq-C30
to the Eq 5D Health Utility in Metastasis Hormone-Refractory Prostate Cancer Patients.
Value in Health 9, A114.
Figure 1 Distribution of R2 of mapping models by type of start measure
0
10
20
30
40
<=0.2 0.2 - 0.4-
0.6-
R
2N
G-G
C-G
N: Number of models relevant
G-G: Mapping from a generic health measure to another generic measure C-G: Mapping from a condition-specific measure to a generic health measures
Table 1: Alternative specifications of mapping functions
independent variables Mo del dependent variable D/C †
Main effects D/C † Interactions Other measures
(1) (2) (3) (4) (5) (6) index index index index Dimension level Dimension level C C C C C D overall score dimension scores item levels item levels Models 1-4 Models 1-4 C C C D C/D C/D dimensions items items level Models 1-4 Models 1-4
For any model: squared terms, other health measures, clinical measures,
demographics
[image:24.595.52.559.472.713.2]Table 2 : Items extracted from papers
Author name Start Measure Target Measure
Population, method of recruitment and setting Estimation sample size
Estimation method Dependent variable (C/D)
Main effects independent variable(C/D) Method of selection of main effects variable Main effects interactions
Transformations Other measures
Independent variables in model (βs)
Proportion of βs (P<0.1)
Proportion of βs unexp. sign (P<0.1) Proportion of Inconsistent βs (P<0.1)
R2 and Adjusted R2 Uncertainty
In-sample tests: Mean error
Mean absolute error (MAE) (95% CI) Proportion MAE>0.05
Proportion MAE>0.10 MAE by sev./cat. MAE /obs (%) RMSE
Maximum predicted score compared to observed Minimum predicted score compared to observed Correlation
Intra class correlation Use of plots
External-sample size Source
Setting
R2 and Adjusted R2
Mean error MAE (95% CI) Prop. MAE>0.05 Prop. MAE>0.10 MAE /obs (%) RMSE(95%CI)
Max. prediction vs. observation Min prediction vs. obervation MAE by severity group or category Correlation
Intraclass correlation coefficient Plots
Table 3: Summary of mapping studies
ID First Author Year Journal Start Measure Target Population Sample
size 3
1 Bansback N 2007 Arthritis Care
Research
HAQ-DI (Health Assessment Questionnaire Disability Index)
EQ-5D Rheumatoid Arthritis (RA) patients 923
2 Bartman BA 1998 Quality of Life Research
SF-36 HUI3 Older patients with intermittent
claudication (>=55)
510
3 Brazier J 2004 Value in Health BI (Barthel Index) EQ-5D Older patients of intermediate care -
admission
964
4 Brazier J 2004 Health Economics IWQOL- Lite SF-6D 1. Community volunteers; 2.
Participants in clinical trials for obesity; 3.gastric bypass surgery taker
468
5 Brennan DS 2006 BMC Health
Services Research
SF-6D EQ-5D 7 samples of patients with different
diseases
2192
6 Buxton MJ 2007 Value in Health OHIP-14 (14 item version of
the oral Health Impact Profile)
EQ-5D Dental patients 248
7 Dixon S 2003 Journal of
Outcomes Research
IBDQ (Inflammatory Bowel Disease Questionnaire)
SF-6D Moderate to severe Crohn's disease patients
905
8 Dobrez D 2007 Value in Health (In
press)
NHP (Nottingham Health Profile)
SF-6D Primary care patients 1327
9 Dooslaser E 2003 Journal of Health
Economics
FACR-G (Functional Assessment of Cancer Therapy - General)
TTO utilities
Cancer patients 717
10 Edlin R 2002 Unpublished
manuscript
SAH (self-assessed health question)
HUI3 General public >=12 15539
11 Edlin R 2002 Unpublished
manuscript
NDI (Nepean Dyspepsia Index)
SF-6D Dyspepsia patients 271
12 Franks P 2004 Medical Decision
Making
MLWHF (Minnesota Living with Heart Failure
Questionnaire)
EQ-5D Heart patients 3000
13 Franks P 2003 Medical Care SF-12 EQ-5D General public (>=18) 12988
15 Gray A 2006 Medical Decision Making
SF-36 QWB General public >=45 years 1356
16 Gray A 2004 HESG1, January
2004, Paris
SF-12 EQ-5D General public adults >=18 12967
17 Grootendorst P
2007 The journal of Rheumatology
SF-36 EQ-5D General public adults >=18 12753
18 Kaambwa B 2006 HESG1, July 2006,
York
WOMAC(Western Ontario and McMaster University Osteoarthritis Index)
HUI3 Knee Osteoarthritis (OA) patients 168
19 Lauridsen J 2004 Health Economics SAH (self-assessed health question)
15D Finnish General public >=15 2697
20 Lawrence
WF
2004 Medical Decision Making
SF-12 EQ-5D General public (>=18) 7313
21 Longo M 2000 HESG1, July 2000,
Nottingham
SF-36 EQ-5D Women with breast disorder 271
22 Longworth L 2005 European Journal of Health
Economics
CCS (Canadian Cardiovascular Society Score) & the Breathlessness Grade
EQ-5D Patients with stable angina 533
23 Nichol MB 2001 Medical Decision
Making
SF-36 HUI2 Managed care patients with at least 1
prescription in the previous year, >18
6921
24 Roberts J 2005 Unpublished
manuscript
OABQ (Overactive-bladder Questionnaire)
SF-6D Over-Active Bladder patients 688
25 Sengupta N 2004 Medical Care SF-12 HUI3 Managed care patients,>18, with at
least one prescription in the previous year
6323
26 Sullivan PW 2006 Medical Decision
Making
SF-12 EQ-5D
(US)
Representative sample of US population >=18
23647
27 Tsuchiya A 2006 HEDS2 discussion paper
AQLQ (Asthma Quality of Life Questionnaire )
EQ-5D Asthma patients 3059 -
6939 28 Tsuchiya A 2002 HEDS2 discussion
paper
IBS_QoL (Irritable Bowel Syndrome questionnaire)
EQ-5D IBS patients 121
1. Health Economists’ Study Group meeting;
2. Health Economics and Decision Science unit, University of Sheffield