comment
reviews
reports
deposited research
interactions
information
refereed research
Research
Prediction of co-regulated genes in
Bacillus subtilis
on the basis of
upstream elements conserved across three closely related species
Goro Terai*
†
, Toshihisa Takagi* and Kenta Nakai*
Addresses: *Human Genome Center, Institute of Medical Science, University of Tokyo, 4-6-1 Shirokane-dai, Minato-ku, Tokyo 108-8639,
Japan. †INTEC Web and Genome Informatics Corp., 1-3-3 Shinsuna, Koto-ku, Tokyo 136-8637, Japan.
Correspondence: Kenta Nakai. E-mail: [email protected]
Abstract
Background: Identification of co-regulated genes is essential for elucidating transcriptional regulatory networks and the function of uncharacterized genes. Although co-regulated genes should have at least one common sequence element, it is generally difficult to identify these genes from the presence of this element because it is very easily obscured by noise. To overcome this problem, we used conserved information from three closely related species: Bacillus subtilis,
B. haloduransand B. stearothermophilus.
Results: Even though such species have a limited number of clearly orthologous genes, we obtained 1,884 phylogenetically conserved elements from the upstream intergenic regions of 1,568
B. subtilisgenes. Similarity between these elements was used to cluster these genes. No other a priori knowledge on genes and elements was used. We could identify some genes known or suggested to be regulated by a common transcription factor as well as genes regulated by a common attenuation effector.
Conclusions:We confirmed that our method generates relatively few false positives in clusters with higher scores and that general elements such as -35/-10 boxes and Shine-Dalgarno sequence are not major obstacles. Moreover, we identified some plausible additional members of groups of known co-regulated genes. Thus, our approach is promising for exploring potentially co-co-regulated genes. Published: 15 October 2001
GenomeBiology2001, 2(11):research0048.1–0048.12
The electronic version of this article is the complete one and can be found online at http://genomebiology.com/2001/2/11/research/0048 © 2001 Terai et al., licensee BioMed Central Ltd
(Print ISSN 1465-6906; Online ISSN 1465-6914)
Received: 10 July 2001 Revised: 6 September 2001 Accepted: 13 September 2001
Background
Transcriptional regulatory networks are important for con-trolling many biological phenomena, such as development and cell proliferation. Even in bacteria, elucidation of such networks or identification of co-regulated genes (regulons) is essential for understanding many cellular processes. Because co-regulated genes are likely to function for the same purpose, identifying them can also provide hints on gene function. The microarray technique, which enables us to monitor the expression levels of thousands of genes in paral-lel, appears very powerful for identifying co-regulated genes and several articles on this technique have been published
[1-3]. Even if we can ignore experimental artifacts, however, it is not always easy to set experimental conditions to identify differential expression patterns of uncharacterized genes. Thus, it would be desirable to develop some computational methods that can supplement such experimental techniques.
predicting co-regulated genes is to search upstream regions for sequence segments similar to known binding sites for transcription factors [4-6]. This approach is, however, applicable only when information on binding sites is avail-able. Furthermore, as DNA sequences recognized by a single transcription factor are only about 6-10 base pairs (bp) long and are not strictly conserved, many false-positive matches would be unavoidable.
One way to overcome this difficulty is to use conservation information across species. New members of co-regulated genes have been predicted on the basis of conservation of hypothetical transcriptional regulatory sites between several eubacteria such as Escherichia coli and Haemophilus influenzae[7-9]. A similar approach was also applied to the analysis of four archaeal candidate regulons [10]. In that approach, the heuristic that many binding sites are quasi-palindromic was also used. McGuire et al. have exploited the possibility of using conservation in a wider range of species [11,12]. To reduce false-positive hits, candidate genes were prescreened using a prioriknowledge such as their function, the metabolic pathway they belong to, and their functional coupling predicted from conserved operons, protein fusions and correlated evolution. Techniques for detecting con-served elements in noncoding regions across species have also been studied [13-15].
For bacterial genes, McCue et al. developed an elaborate algorithm for detecting potential binding sites in sets of upstream regions of orthologous genes [16]. Their method also assumes the palindromic nature of binding sites. Thus, it is evident that such a method would fail to detect non-palindromic binding sites, of which there are many. It is also questionable whether the molecular mechanisms of tran-scription in distantly related bacteria have been well con-served and whether each orthologous transcription factor recognizes exactly the same consensus pattern in each species. Furthermore, the problem of detecting conserved elements is not simple; we should carefully observe each case of conservation and optimize parameters to detect as many known binding sites as possible.
In this paper, we used three closely related genome sequences to predict co-regulated genes of Bacillus subtilis. Our method consists of two parts; first, we identified phylo-genetically conserved elements (PCEs) in the upstream intergenic regions of B. subtilisgenes; then they were clus-tered according to the similarity of PCEs in their upstream region. In addition, each of the obtained clusters, predicted to be co-regulated, was examined in terms of existing knowl-edge of regulons and functional information from down-stream genes. The species used for this analysis are:
B. subtilis [17], B. halodurans [18], and B. stearother-mophilus(genome sequence incomplete; see Materials and methods). We selected these sequences for three reasons. First, the interpretation of the comparison of upstream
regions of orthologous genes would be more straightforward because their regulatory mechanisms are also likely to be conserved. Second, we have constructed a database (DBTBS) of B. subtilispromoters and transcription factors by litera-ture survey [19,20]. Therefore, it is easier to check the pre-dictions and optimize parameters. Third, an international project on functional genomics, including transcriptome analysis, of B. subtilisis ongoing [21]. Thus, our predictions have more chance of being tested experimentally. Here we report the results of our prediction of co-regulated genes in
B. subtiliswithout any prior knowledge or assumption. The extensive evaluation of these results is also described.
Results and discussion
Detection of PCEs and their verification
We could analyze the upstream regions of 1,568 B. subtilis genes. For 675 of them, orthologous genes were found in both B. haloduransand B. stearothermophilus, for 706 in
B. halodurans only, and for 187 in B. stearothermophilus
only. The genome sequence of B. stearothermophilusis still incomplete; its length was 3,286,068 bp on 21 February 2001. If we assume that the genome of B. stearother-mophilus is about the same size as that of B. subtilis, the data roughly correspond to three-quarters of all genes.
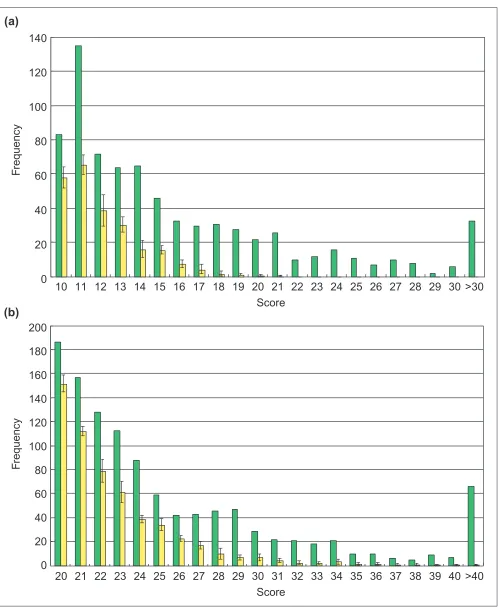
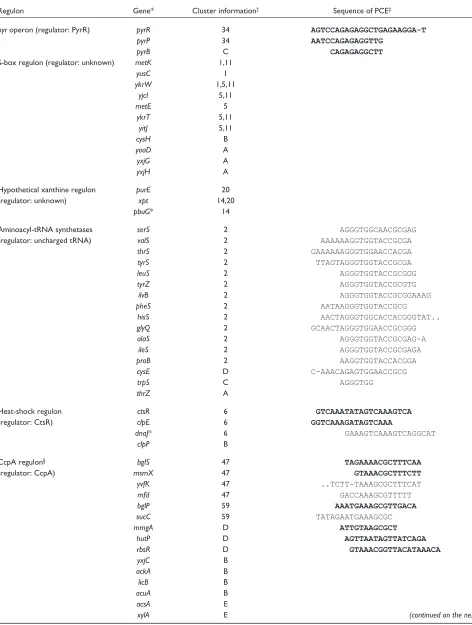
Within the upstream regions of these 1,568 genes, we identi-fied 1,884 PCEs. For comparison, we generated five pseudo-genomes of scrambled upstream regions; for this we took all upstream regions of these genes and randomly placed them in front of randomly chosen genes. Then, the same PCE identification procedure was applied to each pseudo-genome. In these cases, we can basically regard detected PCEs as spurious. On average, 793 spurious PCEs were iden-tified (the standard deviation is 26.7). Figure 1 shows the histogram of scores calculated against these PCEs. The score of spurious PCEs is relatively low, suggesting that their length is relatively short. We estimate that over half of the 1,884 PCEs are meaningful and that this ratio becomes higher for longer PCEs. These PCEs were also compared with known binding sites for transcription factors using the DBTBS database [19,20] and literature survey. Table 1 sum-marizes the result for each known transcription factor. In total, 52 of 122 known binding sites overlapped with the PCEs. For some transcription factors such as GltR, ComA and IolR, the orthologous genes themselves could not be identified, whereas orthologous genes of most genes regu-lated by some factors, such as DegU and GerE, could not be found. On the other hand, 6 of 11 known binding sites of CcpA overlapped with PCEs.
Clustering of PCEs and its verification
comment
reviews
reports
deposited research
interactions
information
[image:3.609.56.554.84.697.2]refereed research
Figure 1
Histogram of PCE scores calculated from sequence alignments. (a)Three or (b)two sequences were aligned. Green bars correspond to the score of actual PCEs and yellow bars to the score of spurious PCEs generated by joining upstream regions with unrelated coding regions. In the yellow bars, the averaged values of five trials are shown with their error bars.
10 11 12 13 14 15 16 17 18 19 20 21
Score
22 23 24 25 26 27 28 29 30 >30
20 21 22 23 24 25 26 27 28 29 30 31
Score
32 33 34 35 36 37 38 39 40 >40
200
0
20
40
60
80
100
F
requency
F
requency
120
140
180
160
140
120
100
80
60
40
20
0
(a)
the 1,884 PCEs of randomly shuffled sequences. Figure 2 shows the histogram of similarity scores used during these clustering processes. It shows that many false-positive clus-ters can occur by chance around a cut-off score of 60, but that they are rare above score 80. Although about half of detected PCEs might be false positives, such PCEs are usually short (Figure 1) and the similarity score between them is relatively low (Figure 2, blue bar). We therefore con-clude that non-meaningful PCEs are rarely incon-cluded in our clustering results, at least in the clusters with higher scores.
Prediction of co-regulated genes
Among the 188 clusters obtained, we excluded 34 because of the alignment of hypothetical Shine-Dalgarno (SD) sequences (see below). The remaining clusters, ranked by the highest similarity score within each cluster, are available as a table online (see Additional data files). We expect that many members of each cluster will be co-regulated by a common factor, especially when their similarity scores are above 80. We now discuss the clustered genes in terms of some typical regulons (Table 2).
Clusters 2 and 3: the T-box family
One of the most conspicuous clusters detected in our analy-sis was the so-called T-box family, which conanaly-sists of many aminoacyl-tRNA synthetase operons and some operons related to amino-acid biosynthesis [22]. It is known that these operons are regulated by the attenuation mechanism, where an uncharged tRNA molecule is used as an effector. The PCE shared in cluster 2 is a part of the attenuation region where an uncharged tRNA is believed to bind (the T-box), whereas the PCE in cluster 3 is a region loosely com-plementary to the T-box. All the members of cluster 3 are included in cluster 2. In addition to 11 aminoacyl-tRNA syn-thetases, it makes sense that proB and ilvBwere clustered because their function is related to amino-acid synthesis. However, three additional members could not be detected; two of them had less similar or shorter PCEs and the other did not have an orthologous counterpart.
Cluster 34: the pyr operon
The pyroperon contains at least three genes, each of which is directly regulated by PyrR, a transcription attenuation regulator ([23] and Figure 3a). Each leader region of these genes can form three different RNA secondary structures (terminator, antiterminator and anti-antiterminator) when transcribed ([24] and Figure 3b). PyrR then binds to the anti-antiterminator regions of the mRNAs. Cluster 34 con-tains pyrRand pyrP, their PCEs corresponding to a part of each anti-antiterminator. The other gene, pyrB, was, however, not detected because its PCE was not sufficiently well conserved to become long enough for clustering.
Clusters 1, 5 and 11: S-box regulon
[image:4.609.58.292.128.682.2]The S-box regulon is a hypothetical regulon relating to methionine and/or cysteine biosynthesis. The leader regions
Table 1
Correspondence between known transcription factor binding sites and PCEs
Factor Orthologs* Number of Number of sites Number of name known sites† to be detected‡ overlaps§
AbrB H S 11 (1) 7 3
AhrC H S 5 (1) 3 2
AraR H 5 (1) 2 1
BirA H S 1 0
-BltR H 1 1 0
BmrR None 1 0
-CcpA H S 33 (17) 11 6
CodY H S 2 1 1
ComA None 5 2 0
ComK None 1 0
-CtsR H S 6 6 4
DegU H S 14 (3) 5 1
DeoR H 1 1 0
LexA H 8 6 3
ExuR S 1 1 0
Fnr H 2 2 1
GerE H S 21 (2) 7 0
GlnR S 6 3 0
GltC H S 3 3 0
GltR None 4 2 0
GntR None 1 0
-Hpr H 8 (1) 3 0
HrcA H S 2 2 2
IolR None 2 1 0
LevR S 3 0
-LicT H 1 1 1
LrpC H 1 1 0
Mta H S 3 2 1
MtrB H S 1 1 0
PhoP H S 6 (2) 2 0
PyrR H S 3 3 3
PurR H S 1 0
-RibC H S 1 0
-RocR H 4 2 0
SacT None 1 0
-SacY None 1 0
-SenS None 1 0
-SinR H 6 5 5
Spo0A H S 22 (1) 18 10
SpoIIID H S 12 (5) 6 2
TnrA H S 10 6 1
TreR H S 2 2 2
Xre H 4 0
-XylR H S 1 1 1
MntR H S 2 1 1
Zur H S 2 2 1
Total 232 (34) 122 52
*Name(s) of species having the orthologous gene with the B. subtilisgene. H:B. halodurans; S: B. stearothermophilus. †Total number of experimentally
verified binding sites of < 50 bp. The number of binding sites in the coding region is shown in parentheses. ‡Number of known binding sites in the
region analyzed in this work. §Number of analyzed sites overlapping with
of its putative transcriptional units have considerable sequence similarity and seem to form complex secondary structures that are similar to those in the pyr operon [25]. Three different PCEs were identified in our analyses, each of which forms a cluster related to each of the others. The PCEs correspond to several parts of the hypothetical anti-antitermi-nator region, where an unidentified binding factor is postu-lated to stabilize its secondary structure [25]. Of the eleven putative members of this regulon, seven were included in at least one of these clusters whereas three could not be detected because of the lack of orthologous genes. The leader region of the remaining one, cysH, was very poorly conserved.
Clusters 14 and 20: hypothetical xanthine metabolic regulon It has been suggested that the expression of the xpt-pbuX
operon in B. subtilisis regulated by a termination-antitermi-nation control mechanism similar to the mechanism
suggested for the pur biosynthesis operon, purEKBC-SLQFMNHD[26]. It has been speculated that the regulatory proteins of these two operons are the same because they seem to have the same effector - xanthine [26]. Our results support this hypothesis because xpt and purE were clustered in cluster 20. xptalso belongs to another cluster, 14, with pbuG. As the PbuG protein has the characteristic Pfam [27] domain of the xanthine/uracil permease family, pbuGis very likely to be a new member of the xanthine metabolism regulon.
Cluster 6: class III heat-shock regulon
This cluster corresponds to a part of the class III heat-shock regulon, which is regulated by CtsR. Cluster 6 contains two of the three known genes that have experimentally verified CtsR-binding sites [28,29]. Interestingly, cluster 6 contains
dnaJ, which belongs to the dnaKoperon - hrcA-grpE-dnaK-dnaJ-yqeT-yqeU-yqeV [30]. As the dnaKoperon is involved
comment
reviews
reports
deposited research
interactions
information
[image:5.609.55.556.86.460.2]refereed research
Figure 2
Histogram of similarity scores used during the clustering process. Red bars represent clustering of PCEs within the upstream regions of orthologous genes, green bars the clustering of PCEs with randomly shuffled sequence, and blue bars the clustering of PCEs identified when the upstream regions are linked to unrelated coding regions. For the green and blue bars, average values are shown with their error bars.
160
140
120
100
80
60
40
60-65
65-70
70-75
75-80
80-85
Similarity score
F
requency
85-90
90-95
95-100
>100
20
Table 2
Comparison of some typical regulons with our results
Regulon Gene* Cluster information† Sequence of PCE‡
pyr operon (regulator: PyrR) pyrR 34 AGTCCAGAGAGGCTGAGAAGGA-T
pyrP 34 AATCCAGAGAGGTTG
pyrB C CAGAGAGGCTT
S-box regulon (regulator: unknown) metK 1,11
yusC 1
ykrW 1,5,11
yjcI 5,11
metE 5
ykrT 5,11
yitJ 5,11
cysH B
yoaD A
yxjG A
yxjH A
Hypothetical xanthine regulon purE 20
(regulator: unknown) xpt 14,20
pbuG* 14
Aminoacyl-tRNA synthetases serS 2 AGGGTGGCAACGCGAG
(regulator: uncharged tRNA) valS 2 AAAAAAGGTGGTACCGCGA
thrS 2 GAAAAAAGGGTGGAACCACGA
tyrS 2 TTAGTAGGGTGGTACCGCGA
leuS 2 AGGGTGGTACCGCGGG
tyrZ 2 AGGGTGGTACCGCGTG
ilvB 2 AGGGTGGTACCGCGGAAAG
pheS 2 AATAAGGGTGGTACCGCG
hisS 2 AACTAGGGTGGCACCACGGGTAT..
glyQ 2 GCAACTAGGGTGGAACCGCGGG
alaS 2 AGGGTGGTACCGCGAG-A
ileS 2 AGGGTGGTACCGCGAGA
proB 2 AAGGTGGTACCACGGA
cysE D C-AAACAGAGTGGAACCGCG
trpS C AGGGTGG
thrZ A
Heat-shock regulon ctsR 6 GTCAAATATAGTCAAAGTCA
(regulator: CtsR) clpE 6 GGTCAAAGATAGTCAAA
dnaJ* 6 GAAAGTCAAAGTCAGGCAT
clpP B
CcpA regulon§ bglS 47 TAGAAAACGCTTTCAA
(regulator: CcpA) msmX 47 GTAAACGCTTTCTT
yvfK 47 ..TCTT-TAAAGCGCTTTCAT
mfd 47 GACCAAAGCGTTTTT
bglP 59 AAATGAAAGCGTTGACA
sucC 59 TATAGAATGAAAGCGC
mmgA D ATTGTAAGCGCT
hutP D AGTTAATAGTTATCAGA
rbsR D GTAAACGGTTACATAAACA
yxjC B
ackA B
licB B
acuA B
acsA E
in the class I heat-shock regulon (which corresponds to cluster 13) and as there is an internal promoter between
dnaKand dnaJ[30], there is likely to be regulatory overlap between the class I and the class III heat-shock regulons.
Clusters 12, 47, 52 and 59: genes under glucose repression The largest genetic network identified so far in B. subtilisis the regulatory system that is stimulated by glucose repres-sion, in which the transcription factor CcpA has a central role [6]. In our analysis, not many known CcpA-dependent genes were clustered and they were even split into three sub-groups (clusters 47, 52 and 59). Two members of cluster 47 have PCEs overlapping with the CcpA-binding site, and another member, yvfK, was recently shown in a microarray experiment to be under glucose repression [31]. In cluster 52, araAwas also shown to be under glucose repression. It seems very likely that CcpA regulates all members of this cluster because their PCEs are similar to the CcpA-binding site and their functions are consistent with this hypothesis. As for cluster 59, both of its two members, bglPand sucC, were shown to be under glucose repression [31]. Many other known genes are regulated by CcpA. As shown in Table 2, their CcpA-binding sites reside within their coding regions in most cases, whereas these sites can be less conserved in other cases. As noted above, many of the known binding sites overlap with PCEs. Therefore, it seems possible that the split into subgroups has some biological meaning.
There are also co-expressed genes that are subject to CcpA-independent glucose repression. All three members of cluster 12 were shown to be under glucose repression, two of
which, gapBand pckA, were shown to be CcpA-independent in a recent systematic experiment [31]. Our results support this because PCEs in cluster 12 are not similar to the CcpA-binding site.
Potentially new regulons/members
As described above, we found several potentially new members of known regulons: for example, dnaJin cluster 6,
pbuGin cluster 14, kduIand odhAin cluster 52 (see table in Additional data files for more examples). In addition, topAin cluster 15 is likely to belong to the Spo0A regulon because PCEs of this cluster is very similar to the Spo0A-binding site and its functions are related to sporulation. There are, however, potential regulons not reported so far. For example,
aroA and aroF in cluster 29 seem to constitute a regulon related to the metabolism of aromatic amino acids. In this regard, clusters 24 and 16 are especially interesting. Cluster 24 contains two genes (dnaAand dnaN) related to DNA replica-tion and its PCEs are very similar to the DnaA-binding site (DnaA-box:TTATCCACA). yqeG, another member of cluster 24, has two DnaA-like PCEs in its upstream region. It is known that DnaA box is often found in multiple copies. More-over, cluster 16 contains yqeGand dnaA, its PCEs being very similar to the Spo0A-binding site. Thus, it is likely that both DnaA and Spo0A bind to the upstream regions of yqeG and
dnaA, suggesting a new crosstalk of regulatory networks between DNA replication and sporulation. yqeG, whose function cannot be inferred by sequence similarity, may be involved in DNA replication and/or sporulation. As there are many additional cases where functionally related genes are included in the same cluster (see Additional data files), we
comment
reviews
reports
deposited research
interactions
information
[image:7.609.58.551.97.321.2]refereed research
Table 2 (continued)
Regulon Gene* Cluster information† Sequence of PCE‡
iolB E
galT E
uxaC E
ydhO E
acoA E
araB E
lcfA E
dra E
kdgA E
yobO E
treP E
yxkJ A
amyE A
gntR A
xynP A
levD A
dctP A
citM A
*Probable new members identified by our analysis are shown with an asterisk. †Cluster number(s) are shown when available, otherwise, one of the
situation codes is shown: A, orthologous genes not found; B, no overlaps between known binding site and PCE; C, PCE overlaps with known site but is too short; D, PCE overlaps with known site but is slightly different; E, binding site exists within the coding region. ‡PCE sequence in B. subtilis. The region
expect that future experiments will prove that at least some of them are co-regulated.
On the possibility of misclustering due to general patterns
In our method, there is a concern that a set of functionally unrelated genes can be clustered from general motifs such as the -35/-10 boxes and the SD sequence. Thus, we investi-gated the occurrences of these motifs in the clusters.
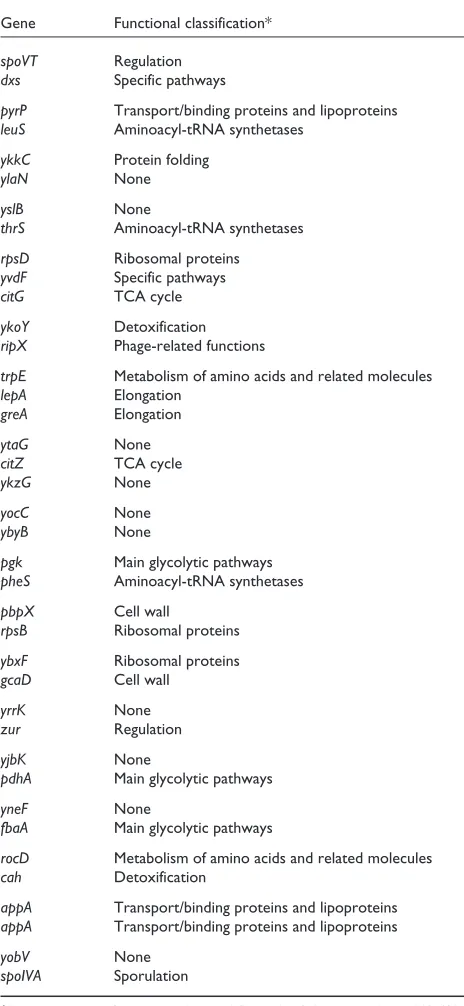
As the SD sequence is located at some relatively definite dis-tances from the translation start site, which is known at least in principle, it is relatively easy to detect the SD sequence. With the criterion described in Materials and methods, we excluded 34 clusters, all members of which contain an SD-like PCE (Table 3). Apparently, many of these genes are transla-tion related (that is, ribosomal proteins and elongatransla-tion factors). Possibly their SD sequence has been highly conserved to maximize their translation efficiency. Another possibility is that there are some factors that recognize such SD-like PCEs and that these clusters are co-regulated by them.
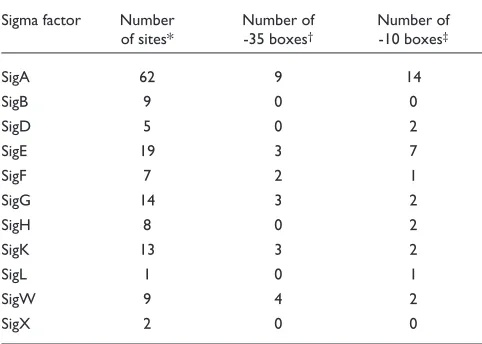
It is more difficult to detect the -35/-10 boxes than the SD sequence because the distance between the start sites of transcription and translation is rather variable. We investi-gated the number of known -35/-10 boxes overlapping with the PCEs using the DBTBS database [19,20]. As shown in Table 4, 19% of them overlap with the PCEs on average. It is possible that the presence of the -35/-10 boxes might have affected the clustering of clusters 7, 22, 42, 53, 122, 129, 134 and 144. However, we do not regard this as a serious problem because the conservation of these boxes is relatively weak and because it is natural that many regulatory
elements overlap with the -35/-10 boxes. Namely, if a PCE overlaps with the -35/-10 box in a cluster, it does not directly mean that the clustering is a mistake. On the other hand, it could be also problematic if no -35/-10 like elements were found around PCEs because it may not be a promoter region but an intergenic region within an operon. However, consid-ering that it is still difficult to predict the position of promot-ers in bacterial genomes exactly, we did not use information of promoter existence in our scheme. In future, it seems to be reasonable to include the prediction of operon structure in our method [32-34].
Conclusions
In this work, we aligned the upstream regions of orthologous genes between three closely related species and identified the PCEs within them. Genes of B. subtiliswere then clus-tered according to the similarity of the PCEs in their upstream region. Most parameters in our method were determined such that as many known co-regulated genes are clustered together and the nature of the clustered genes was thoroughly investigated. In this sense, the use of closely related species, one of which has a long history of experi-mental research, was essential in our work.
[image:8.609.57.558.86.273.2]There are several potential difficulties in our approach. One is that the regulatory system of co-regulated genes must be conserved in a pair of species at least. In fact, even in the close relatives compared, only a proportion of genes had orthologous counterparts. However, this situation will be improved as the number of sequenced bacterial genomes increases. Another is that it is difficult to cluster genes harboring relatively short and/or variable elements. For Figure 3
Post-transcriptional regulation of the pyroperon. (a) The three attenuation regions in the operon. (b)Two alternative secondary structures of the transcript of each attenuation region. In the presence of high UMP concentration, PyrR binds to the anti-antiterminator and stabilizes the formation of the terminator structure, while preventing the formation of the antiterminator.
(a)
(b)
pyrR
pyrP
pyrB pyrC
1
2
3
UUUUU
Terminator
Anti-anti-terminator
PyrR
PyrR
UMP
example, although many of the known binding sites for CcpA, AbrB, Spo0A and LexA overlap with PCEs, genes reg-ulated by them were not clustered well with a reasonable value of the cut-off score. Currently, it is rather difficult to detect elements of about 6 bp long. It seems biologically rea-sonable, however, that in some large regulons, such as one regulated by CcpA, its binding affinity is modulated for each element. Thus, that all members of a known large regulon are not clustered is not always a failure of our approach. The
comment
reviews
reports
deposited research
interactions
information
[image:9.609.312.544.101.604.2] [image:9.609.59.306.112.739.2]refereed research
Table 3
Clusters having SD-like PCEs
Gene Functional classification* atpG Membrane bioenergetics spoVG Sporulation
yyaA Sporulation rpsS Ribosomal proteins rpoC Elongation rpsL Ribosomal proteins rpoB Elongation
ydaO None
ydcD None
secG None
sspE Sporulation rplK Ribosomal proteins sspA Sporulation rpsF Ribosomal proteins rplJ Ribosomal proteins rplU Ribosomal proteins ftsA Cell division rpmE Ribosomal proteins fusA Elongation
cysE Metabolism of amino acids and related molecules
yeeI None
rpoA Elongation gerE Regulation sigA Initiation
gerM Germination
asnS Aminoacyl-tRNA synthetases
nusG Termination
ypjB None
yjcI Metabolism of amino acids and related molecules sigG Initiation
acpA Metabolism of lipids
prfA Termination
thdF Detoxification minC Cell division
cwlJ Cell wall
hag Mobility and chemotaxis
aprX Metabolism of amino acids and related molecules
tsf Elongation
yvgY Transport/binding proteins and lipoproteins yabR Metabolism of nucleotides and nucleic acids
yqfC None
ileS Aminoacyl-tRNA synthetases yocD Detoxification
gcvH Metabolism of amino acids and related molecules rpsJ Ribosomal proteins
rplQ Ribosomal proteins dnaA DNA replication
thrS Aminoacyl-tRNA synthetases ysgA RNA modification
yjzC None
ytdA Specific pathways
ywrD Metabolism of amino acids and related molecules
Table 3 (continued)
Gene Functional classification* spoVT Regulation
dxs Specific pathways
pyrP Transport/binding proteins and lipoproteins leuS Aminoacyl-tRNA synthetases
ykkC Protein folding
ylaN None
yslB None
thrS Aminoacyl-tRNA synthetases rpsD Ribosomal proteins yvdF Specific pathways
citG TCA cycle
ykoY Detoxification ripX Phage-related functions
trpE Metabolism of amino acids and related molecules lepA Elongation
greA Elongation
ytaG None
citZ TCA cycle
ykzG None
yocC None
ybyB None
pgk Main glycolytic pathways pheS Aminoacyl-tRNA synthetases
pbpX Cell wall
rpsB Ribosomal proteins ybxF Ribosomal proteins
gcaD Cell wall
yrrK None
zur Regulation
yjbK None
pdhA Main glycolytic pathways
yneF None
fbaA Main glycolytic pathways
rocD Metabolism of amino acids and related molecules cah Detoxification
appA Transport/binding proteins and lipoproteins appA Transport/binding proteins and lipoproteins
yobV None
spoIVA Sporulation
third difficulty is related to the operon structure of bacterial genes. In some operons, the order of constituent genes is not conserved across species. Our method could not deal with cases when the position of the first gene was changed. As noted above, future incorporation of operon prediction may be useful. In fact, there is already research combining the predictions of transcription units and transcription factor binding sites [8].
On the other hand, our method could detect not only the DNA-binding sites for transcription factors but also some binding sites in RNA or conserved RNA secondary structure elements. This seems to reflect the fact that B. subtilis
heavily exploits the antitermination mechanism to control gene expression [22]. Thus, our method could grasp a global feature of the gene regulatory mechanism in B. subtilis, without any a prioriknowledge about it.
In conclusion, although it is difficult to detect the entire set of co-regulated genes with our method, it can be used as a powerful tool to explore them. In addition, our results can be used as criteria for comparing results from other methods, and are useful for developing a more elaborate method. Thus, our approach is a model for further studies.
Materials and methods
Genome sequence dataGenome sequences of B. subtilis [17] and B. halodurans
[18] with the annotation information were obtained from GenBank [35] (accession numbers: AL009126 and BA000004, respectively). Unfinished genome sequence of
B. stearothermophiluswas downloaded from the website of the B. stearothermophilusgenome-sequencing project at the University of Oklahoma [36].
Identification of orthologous genes
Genes orthologous between B. subtilis and B. halodurans
were obtained by finding the best match counterpart of amino-acid sequence from each genome with BLASTP [37]. As the annotation in the genome of B. stearothermophiluswas not given, orthologs between B. subtilis and B. stearother-mophiluswere obtained as follows: a TBLASTN search was done against the contig sequences of B. stearothermophilus
for each amino-acid sequence of B. subtilis. If the best-hit alignment started before the tenth residue of the query, this translated counterpart was used as a BLASTP query against all
B. subtilis sequences. If its best hit was identical with the initial query, they were regarded as orthologous.
Alignment of upstream regions
Although binding sites for transcription factors can some-times exist in coding regions, we excluded B. subtilisgenes with upstream intergenic regions of less than 50 bp from further analyses, in order to reduce potential noise. Next, the upstream 300 bp region of each B. subtilisgene and that of an orthologous gene, if any, were aligned with a local pair-wise alignment program LALIGN [38,39]. The open gap penalty was set to 20, which is higher than the default value. Locally conserved regions in an upstream region of 300 bp from closely related species were realigned with the entire upstream region of B. subtilis without overlap. The most conserved element of either B. haloduransor B. stearother-mophilus was first aligned with the upstream 300 bp sequence of B. subtilis. Next, the second most conserved element is aligned, unless this element overlaps with the previous alignment. This procedure was repeated for all detected elements. The final alignments are shown in DBTBS [19,20].
Identification of phylogenetically conserved elements (PCEs)
[image:10.609.56.297.131.303.2]On the basis of the alignments described above, we defined PCEs within the upstream noncoding region as follows: first, 3 bp segments where all of the nucleotides were conserved for three species were sought. Then, each segment was extended until a consecutive unconserved site appeared for each direction. Unless its score was less than 10, the sequence was designated a PCE (for the scoring of PCEs, see below). To increase the number of PCEs, we also identified PCEs even when they were conserved in only two species under a more stringent condition: segments of 6 bp where the nucleotides were conserved at all positions were first sought. Then, each sequence was extended in each direction until it faced a 3 bp segment in which two of the positions were unconserved. Unless its score was less than 20, it was assigned as a PCE (the cut-off score was chosen by observing the number of spurious PCEs detected when the upstream
Table 4
Number of -35/-10 boxes that overlap with PCEs for each sigma factor
Sigma factor Number Number of Number of of sites* -35 boxes† -10 boxes‡
SigA 62 9 14
SigB 9 0 0
SigD 5 0 2
SigE 19 3 7
SigF 7 2 1
SigG 14 3 2
SigH 8 0 2
SigK 13 3 2
SigL 1 0 1
SigW 9 4 2
SigX 2 0 0
regions are joined to unrelated coding sequences). Thus, a PCE is an alignment of three or two conserved fragments from different species.
Scoring PCEs
Suppose a PCE, denoted by M, consists of a set of fragments of (two or three) species, S. The score of M was defined by
Score(M) = -log2[<xFxiNx>] ( i S, x A, T, G, C),
where the brackets (< >) denote an average over S, Fxi denotes the fraction of nucleotide x in the 300 bp upstream sequence of species i, and Nxis the number of positions at which nucleotide x is conserved over S in M. Thus, the score of PCEs becomes low if they are short and rich in frequent nucleotides.
Clustering genes
Genes were clustered according to the similarity of PCEs in their upstream region. A similarity measure (sMN) between two PCEs, M and N, was defined by the sum of all pairwise alignment scores between any constituent sequences from both PCEs:
sMN= ¦mnLmn (m sequences in M, n sequences in N)
Lmn= max[ lmn, d•lmnc],
where lmndenotes the score of the Smith-Waterman local alignment algorithm [40] between constituent sequences m and n (the match score, the mismatch cost and the gap cost were set to 1, 2 and 3, respectively); ncdenotes the reverse complement of n; and dis an empirical cost for selecting nc (we set d= 0.9). As sMN becomes larger as the number of constituent sequences of M and N is larger, sMNwas further normalized as follows:
SMN= sMN • 9b/ (km•kn),
where km and kn denote the number of constituent
sequences of M and N, respectively; bis again an empirical cost for smaller values of kmor kn:
b= 1.0 if both kmand knare 3
b= 0.9 if either kmor knis 2
b= 0.8 if both kmand knare 2
We used a simple algorithm UPGMA [41] to cluster genes. The UPGMA algorithm was continued until no pairs of PCEs have a normalized similarity value of more than 60. We chose all of the above-mentioned empirical parameters by observing the results for known co-regulated genes.
Discarding clusters with SD-like PCEs
We discarded clusters when all of their members contain the SD sequence-like elements. More specifically, a member is
considered to have an SD-like element if the B. subtilis
sequence of its PCE contains a 5 bp segment where there are at least two Gs and one A but no Cs, and if this segment lies within the region 20 bp upstream from the translation initia-tion site. Subsequently, the cluster was discarded if all of the other members also have its corresponding regions.
Additional data files
A table showing all clusters ranked by the highest similarity score within each cluster is available as an Excel file with the online version of this paper.
Acknowledgements
We are grateful to Kenichi Yoshida and Joan Fujimura for critically reading the manuscript. We also thank the Bacillus stearothermophilus Genome Sequencing Project funded by NSF EPSCoR Program (Experimental Program to Stimulate Competitive Research Grant EPS-9550478) for pro-viding the unfinished genome sequence of B. stearothermophilus. This work was partly supported by a Grant-in-Aid for Scientific Research on Priority Areas (C) “Genome Information Science” from the Ministry of Education, Culture, Sports, Science and Technology of Japan, by Special Coordination Funds for Promoting Science and Technology, and by Industrial Science and Technology Program from New Energy and Industrial Technology Development Organization, Japan.
References
1. DeRisi JL, Iyer VR, Brown PO: Exploring the metabolic and genetic control of gene expression on a genomic scale.
Science1997, 278:680-686.
2. Eisen MB, Spellman PT, Brown PO, Bostein D: Cluster analysis and display of genome-wide expression patterns. Proc Natl Acad Sci USA1998, 95:14863-14868.
3. Tavazoie S, Hughes JD, Campbell MJ, Cho RJ, Church GM: System-atic determination of genetic network architecture. Nat Genet1999, 22:281-285.
4. Thieffry D, Salgado H, Huerta AM, Collado-Vides J: Prediction of transcriptional regulatory sites in the complete genome sequence of Escherichia coliK-12. Bioinformatics1998, 14:391-400. 5. Robinson K, McGire AM, Church GM: A comprehensive library of DNA-binding site matrices for 55 proteins applied to the complete Escherichia coli K-12 genome. J Mol Biol 1998,
284:241-254.
6. Miwa Y, Nakata A, Ogiwara A, Yamamoto M, Fujita Y: Evaluation and characterization of catabolite-responsive elements (cre) of Bacillus subtilis.Nucleic Acids Res2000, 28:1206-1210.
7. Mironov AA, Koonin EV, Roytberg MA, Gelfand MS: Computer analysis of transcription regulatory patterns in completely sequenced bacterial genomes. Nucleic Acids Res1999, 27: 2981-2989.
8. Tan K, Moreno-Hagelsieb G, Collado-Vides J, Stormo GD: A com-parative genomics approach to prediction of new members of regulons.Genome Res2001, 11:566-584.
9. Makarova KS, Mironov AA, Gelfand MS: Conservation of the binding site for arginine repressor in all bacterial lineages.
Genome Biol2001, 2:research0013.1–0013.8.
10. Gelfand MS, Koonin EV, Mironov AA: Prediction of transcription regulatory sites in Archaea by a comparative genomic approach.Nucleic Acids Res2000, 28:695-705.
11. McGuire AM, Hughes JD, Church GM: Conservation of DNA regulatory motifs and discovery of new motifs in microbial genomes.Genome Res 2000, 10:744-757.
12. McGuire AM, Church GM: Predicting regulons and their cis-regulatory motifs by comparative genomics.Nucleic Acids Res 2000, 28:4523-4530.
13. Hardison RC, Oeltjen J, Miller W:Long human-mouse sequence alignments reveal novel regulatory elements: a reason to sequence the mouse genome. Genome Res1997, 7:959-966.
comment
reviews
reports
deposited research
interactions
information
14. Dubchak I, Brudno M, Loots GG, Pachter L, Mayor C, Rubin EM, Frazer KA: Active conservation of noncoding sequences revealed by three-way species comparisons.Genome Res2000,
10:1304-1306.
15. Wasserman WW, Palumbo M, Thompson W, Fickett JW, Lawrence CE: Human-mouse genome comparisons to locate regula-tory sites.Nat Genet2000, 26:225-228.
16. McCue LA, Thompson W, Carmack CS, Ryan MP, Lie JS, Derbyshire V, Lewrence CE: Phylogenetic footprinting of transcription factor binding sites in proteobacterial genomes.Nucleic Acids Res2001, 29:774-782.
17. Kunst F, Ogasawara N, Moszer I, Albertini AM, Alloni G, Azevedo V, Bertero MG, Bessieres P, Bolotin A, Borchert S, et al.: The com-plete genome sequence of the Gram-positive bacterium
Bacillus subtilis.Nature1997, 390:249-256.
18. Takami H, Nakasone K, Takaki Y, Maeno G, Sasaki R, Masui N, Fuji F, Hirama C, Nakamura Y, Ogasawara Y, et al.: Complete genome sequence of the alkaliphilic bacterium Bacillus halodurans
and genomic sequence comparison with Bacillus subtilis.
Nucleic Acids Res2000, 28:4317-4331.
19. Ishii T, Yoshida K, Terai G, Fujita Y, Nakai K: DBTBS: A database of Bacillus subtilis promoters and transcription factors.
Nucleic Acids Res2001, 29:278-280. 20. DBTBS [http://elmo.ims.u-tokyo.ac.jp/dbtbs]
21. Ogasawara N: Systematic function analysis of Bacillus subtilis
genes.Res Microbiol2000, 151:129-134.
22. Condon C, Grunberg-Manago M, Puzer H: Aminoacyl-tRNA syn-thetase gene regulation in Bacillus subtilis. Biochimie 1996,
78:381-389.
23. Lu Y, Turner RJ, Switzer RL: Roles of the three transcriptional attenuators of the Bacillus subtilis pyrimidine biosynthetic operon in the regulation of its expression. J Bacteriol 1995,
177:1315-1325.
24. Lu Y, Turner RJ, Switzer RL: Function of RNA secondary struc-tures in transcriptional attenuation of the Bacillus subtilis pyr
operon.Proc Natl Acad Sci USA1996, 93:14462-14467.
25. Grundy FJ, Henkin TH: The S box regulon: a new global tran-scription termination control system for methionine and cysteine biosynthesis genes in Gram-positive bacteria.Mol Microbiol1998, 30:737-749.
26. Christiansen LC, Schou S, Nygaard P, Saxild HH: Xanthine metab-olism in Bacillus subtilis: characterization of the xpt-pbuX
operon and evidence for purine- and nitrogen-controlled expression of genes involved in xanthine salvage and catabo-lism.J Bacteriol1997, 179:2540-2550.
27. Bateman A, Birney E, Durbin R, Eddy SR, Howe KL, Sonnhammer EL:
The Pfam protein families database. Nucleic Acids Res 2000,
28:263-266.
28. Derre I, Rapoport G, Msadek T: CtsR, a novel regulator of stress and heat shock response, controls clp and molecular chaperone gene expression in gram-positive bacteria. Mol Microbiol1999, 31:117-131.
29. Derre I, Rapoport G, Devine K, Rose M, Msadek T: ClpE, a novel type of HSP100 ATPase, is part of the CtsR heat shock regulon of Bacillus subtilis.Mol Microbiol1999, 32:581-593. 30. Homuth G, Masuda S, Mogk A, Kobayashi Y, Schumann W: The
dnaK operon of Bacillus subtilis is heptacistronic. J Bacteriol 1997, 179:1153-1164.
31. Yoshida K, Kobayashi K, Miwa Y, Kang CM, Matsunaga M, Yamaguchi H, Tojo S, Yamamoto M, Nishi R, Ogasawara N, et al.: Combined transcriptome and proteome analysis as a powerful approach to study genes under glucose repression in Bacillus subtilis.Nucleic Acids Res2001, 29:683-692.
32. Yada T, Nakao M, Totoki Y, Nakai K: Modeling and predicting transcriptional units of Escherichia coligenes using hidden Markov models.Bioinformatics1999, 15:987-993.
33. Salgado H, Moreno-Hagelsieb G, Smith TF, Collado-Vides J:
Operons in Escherichia coli: genomic analyses and predic-tions.Proc Natl Acad Sci USA2000, 97:6652-6657.
34. Ermolaeva MD, White O, Salzberg SL: Prediction of operons in microbial genomes. Nucleic Acids Res2001, 29:1216-1221. 35. GenBank
[http://www.ncbi.nlm.nih.gov/entrez/query.fcgi?db=Genome] 36. The Bacillus stearothermophilusgenome-sequencing project
[http://www.genome.ou.edu/bstearo.html]
37. Altschul SF, Madden TL, Schaffer AA, Zhang J, Zhang Z, Miller W, Lipman DJ: Gapped BLAST and PSI-BLAST: a new generation
of protein database search programs. Nucleic Acids Res 1997,
25:3389-3402.
38. LALIGN [ftp://ftp.virginia.edu/pub/fasta].
39. Pearson WR: Flexible sequence similarity searching with the FASTA3 program package.Methods Mol Biol2000, 132:185-219. 40. Smith TF, Waterman MS: Identification of common molecular
subsequences.J Mol Biol1981, 147:195-197.
41. Sokal RR, Michener CD: A statistical method for evaluating sys-tematic relationships.Univ Kansas Sci Bull1958, 28:1409-1438. 42. Moszer I: The complete genome of Bacillus subtilis: from
sequence annotation to data management and analysis.FEBS Lett1998, 430:28-36.