R E S E A R C H
Open Access
Extensive identification and analysis of
conserved small ORFs in animals
Sebastian D. Mackowiak
1, Henrik Zauber
1, Chris Bielow
1,2, Denise Thiel
1, Kamila Kutz
1, Lorenzo Calviello
1,
Guido Mastrobuoni
1, Nikolaus Rajewsky
1, Stefan Kempa
1, Matthias Selbach
1and Benedikt Obermayer
1*Abstract
Background:There is increasing evidence that transcripts or transcript regions annotated as non-coding can harbor functional short open reading frames (sORFs). Loss-of-function experiments have identified essential developmental or physiological roles for a few of the encoded peptides (micropeptides), but genome-wide experimental or computational identification of functional sORFs remains challenging.
Results:Here, we expand our previously developed method and present results of an integrated computational pipeline for the identification of conserved sORFs in human, mouse, zebrafish, fruit fly, and the nematodeC. elegans. Isolating specific conservation signatures indicative of purifying selection on amino acid (rather than nucleotide) sequence, we identify about 2,000 novel small ORFs located in the untranslated regions of canonical mRNAs or on transcripts annotated as non-coding. Predicted sORFs show stronger conservation signatures than those identified in previous studies and are sometimes conserved over large evolutionary distances. The encoded peptides have little homology to known proteins and are enriched in disordered regions and short linear interaction motifs. Published ribosome profiling data indicate translation of more than 100 novel sORFs, and mass spectrometry data provide evidence for more than 70 novel candidates.
Conclusions:Taken together, we identify hundreds of previously unknown conserved sORFs in major model organisms. Our computational analyses and integration with experimental data show that these sORFs are expressed, often translated, and sometimes widely conserved, in some cases even between vertebrates and invertebrates. We thus provide an integrated resource of putatively functional micropeptides for functional validationin vivo.
Background
Ongoing efforts to comprehensively annotate the genomes of humans and other species revealed that a much larger fraction of the genome is transcribed than initially appre-ciated [1]. Pervasive transcription produces a number of novel classes of non-coding RNAs, in particular long intergenic non-coding RNAs (lincRNAs) [2]. The defining feature of lincRNAs is the lack of canonical open read-ing frames (ORFs), classified mainly by length, nucleo-tide sequence statistics, conservation signatures, and similarity to known protein domains [2]. Although coding-independent RNA-level functions have been established for a growing number of lincRNAs [3, 4],
there is little consensus about their general roles [5]. Moreover, the distinction between lincRNAs and mRNAs is not always clear-cut [6], since many lincRNAs have short ORFs, which easily occur by chance in any stretch of nucleotide sequence. However, recent observations sug-gest that lincRNAs and other non-coding regions are often associated with ribosomes and sometimes in fact trans-lated [7–16]. Indeed, some of the encoded peptides have been detected via mass spectrometry [10, 17–23]. Small peptides have been marked as essential cellular compo-nents in bacteria [24] and yeast [25]. More detailed functional studies have identified the well-known tarsal-less peptides in insects [26–29], characterized a short secreted peptide as an important developmental signal in vertebrates [30], and established a fundamental link be-tween different animal micropeptides and cellular calcium uptake [31, 32].
* Correspondence:[email protected]
1
Berlin Institute for Medical Systems Biology, Max-Delbrück-Center for Molecular Medicine, Robert-Rössle-Str. 10, 13125 Berlin, Germany Full list of author information is available at the end of the article
Importantly, some ambiguity between coding and non-coding regions has been observed even on canonical mRNAs [15]: upstream ORFs (uORFs) in 5′untranslated regions (5′UTRs) are frequent, well-known, and com-monly associated with the translational regulation of the main CDS [33, 34]. To a lesser extent, mRNA 3′UTRs have also been found associated to ribosomes, which has been attributed to stop-codon read-through [35], in other cases to delayed drop-off, translational regulation, or ribo-some recycling [36], and even to the translation of 3′UTR ORFs (dORFs) [10]. Translational regulation could be the main role of these ORFs, and regulatory effects of translation (for example, on mRNA stability) could be a major function of lincRNA translation [12]. Alterna-tively, they could be ORFs in their own right, consider-ing well-known examples of polycistronic transcripts in animals such as thetarsal-less mRNA [26–28]. Indeed, many non-annotated ORFs have been found to produce detectable peptides [10, 17], and might therefore en-code functional micropeptides [37].
Typically, lincRNAs are poorly conserved on the nu-cleotide level, and it is hard to computationally detect functional conservation despite sequence divergence even when it is suggested by synteny [2, 38, 39]. In con-trast, many of the sORFs known to produce functional micropeptides display striking sequence conservation [26–28, 30, 31], highlighted by a characteristic depletion of non-synonymous compared to synonymous mutations. This suggests purifying selection on the level of encoded peptide (rather than DNA or RNA) sequence. Also, the sequence conservation rarely extends far beyond the ORF itself, and an absence of insertions or deletions implies conservation of the reading frame. These features are well-known characteristics of canonical protein-coding genes and have in fact been used for many years in com-parative genomics [40, 41]. While many powerful compu-tational methods to identify protein-coding regions are based on sequence statistics and suffer high false-positive rates for very short ORFs [42, 43], comparative genomics methods have gained statistical power over the last years given the vastly increased number of sequenced animal genomes.
Here, we present results of an integrated computational pipeline to identify conserved sORFs using comparative genomics. We greatly extended our previously published approach [10] and applied it to entire transcriptomes of five animal species: human (H. sapiens), mouse (M. mus-culus), zebrafish (D. rerio), fruit fly (D. melanogaster), and the nematodeC. elegans. Applying rigorous filtering cri-teria, we find a total of about 2,000 novel conserved sORFs in lincRNAs as well as other regions of the tran-scriptome annotated as non-coding. By means of com-parative and population genomics, we detect purifying selection on the encoded peptide sequence, suggesting
that the predicted sORFs, of which some are conserved over wide evolutionary distances, give rise to functional micropeptides. We compare our results to published catalogs of peptides from non-annotated regions, to sets of sORFs found to be translated using ribosome profiling, and to a number of computational sORF pre-dictions. While there is often little overlap, we find in all cases consistently stronger conservation for our can-didates, confirming the high stringency of our selection criteria. Overall, predicted peptides have little hom-ology to known proteins and are rich in disordered re-gions and peptide binding motifs which could mediate protein-protein interactions. Finally, we use published high-throughput datasets to analyze expression of their host transcripts, confirm translation of more than 100 novel sORFs using published ribosome profiling data, and mine in-house and published mass spectrometry datasets to support protein expression from more than 70 novel sORFs. Altogether, we provide an integrated catalog of conserved sORFs in animals to aid functional studies.
Results
Identification of conserved coding sORFs from multiple species alignments
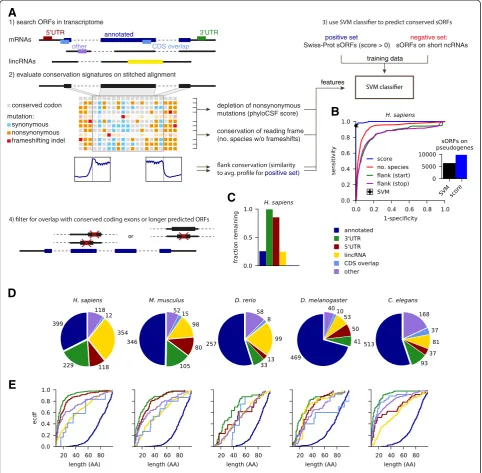
Our approach, which is summarized in Fig. 1a, is a signifi-cant extension of our previously published method [10]. Like most other computational studies, we take an anno-tated transcriptome together with published lincRNA catalogs as a starting point. We chose the Ensembl anno-tation (v74), which is currently one of the most compre-hensive ones, especially for the species considered here. In contrast tode novogenome-wide predictions [44, 45], we rely on annotated transcript structures including splice sites. We then identified canonical ORFs for each tran-script, using the most upstream AUG for each stop codon; although use of non-canonical start codons has been fre-quently described [15–17, 46, 47], there is currently no clear consensus how alternative translation start sites are selected. Next, ORFs were classified according to their lo-cation on lincRNAs or on transcripts from protein-coding loci: annotated ORFs serving as positive control; ORFs in 3′UTRs, 5′UTRs or overlapping with the annotated CDS; or on other transcripts from a protein-coding locus lack-ing the annotated CDS. We ignored pseudogene loci: although pseudogenes have been associated with a variety of biological functions [48–50], their evolutionary history makes it unlikely that they harbor sORFs as independent functional units encoding micropeptides.
conservation of the reading frame from the number of species in the (un-stitched) alignment that lack frame-shifting indels; finally, we analyzed the characteristic steps in nucleotide-level conservation (using phast-Cons) around the start and stop codons by comparing to the mean profile observed in annotated ORFs. Next, we trained a classifier based on support vector machines on confident sets of conserved small peptides and control sORFs from non-coding regions (see Ré et al. [52] and Crappé et al. [45] for related approaches). As positive
control, we chose conserved small peptides of at most 100 aa from Swiss-Prot with positive phyloCSF score. Here, we discarded a number of presumably fast-evolving pep-tides: 177 in human and 72 in mouse, which are associ-ated with antimicrobial defense, and 15 in fly of which 11 are signal peptides. As negative control, we chose sORFs on classical ncRNAs such as pre-miRNAs, rRNAs, tRNAs, snRNAs, or snoRNAs. Importantly, both of these sets overlap with a sizable number of genomic regions that are highly conserved on the nucleotide level (phastCons 2) evaluate conservation signatures on stitched alignment
1) search ORFs in transcriptome
conserved codon
synonymous nonsynonymous frameshifting indel mutation:
mRNAs
lincRNAs
5’UTR 3’UTR
CDS overlap annotated
depletion of nonsynonymous mutations (phyloCSF score)
conservation of reading frame (no. species w/o frameshifts)
positive set)
positive set: Swiss-Prot sORFs (score > 0)
negative set: sORFs on short ncRNAs
training data
features
or
D
E
A
other
B
C
[image:3.595.57.540.90.563.2]conserved elements; Additional file 1: Figure S1A). While each of the four conservation features performs
well in discriminating positive and negative set
(Additional file 1: Figure S1B), their combination in the SVM reaches very high sensitivity (between 1-5 % false negative rate) and specificity (0.1-0.5 % false positive rate) when cross-validating our training data (Fig. 1b and Additional file 1: Figure S1B). The classifier is dominated by the phyloCSF score (Additional file 1: Figure S1B), which is therefore the primarily relevant feature for ranking candidates by confidence. However, the additional conservation features help to reject sORFs on annotated pseudogene transcripts, which typ-ically do not show characteristic steps in nucleotide conservation near start or stop codons (Fig. 1b inset).
We noted that known small proteins typically reside in distinct genomic loci, while many predicted ORFs on different transcript isoforms overlap with one another or with annotated coding exons. Therefore, we aimed to remove candidates where the conservation signal could not be unambiguously assigned. We thus imple-mented a conservative overlap filter by excluding ORFs overlapping with conserved coding exons or with longer SVM-predicted ORFs (Materials and methods). Most sORFs in 3′UTRs or 5′UTRs pass this filter, but many sORFs from different mRNA and lincRNA isoforms are collapsed, and most sORFs (85-99 %) overlapping with annotated coding sequence are rejected (Fig. 1c and Additional file 1: Figure S1D).
Hundreds of novel conserved sORFs, typically much smaller than known small proteins
With our stringent conservation and overlap filters, we predict 2,002 novel conserved sORFs of nine to 101 co-dons: 831 in H. sapiens, 350 in M. musculus, 211 in D. rerio, 194 in D. melanogaster, and 416 in C. elegans. Novel sORFs reside in lincRNAs and transcriptomic regions annotated as non-coding, with relatively few
sORFs predicted in 3′UTRs or overlapping coding
sequence relative to the size of these transcriptome regions (pre-overlap filter; see Additional file 1: Figure S1C). Our pipeline recovers known or recently discov-ered functional small peptides, such as all tarsal-less peptides [26–28], sarcolamban [32] andpgc[53] in flies, toddler [30] in zebrafish together with its human and mouse orthologs, and BRK1 [54] and myoregulin [31] in human. We also predict that many transcripts annotated as lincRNAs in fact code for proteins. While it is a rela-tively small fraction (1-7 %) that includes transcripts in intermediate categories, such as TUCPs in human [55] and RITs inC. elegans[56], the percentage increases when looking at conserved lincRNAs: for instance, eight of 29 zebrafish lincRNAs conserved in vertebrates [38] are pre-dicted to contain conserved ORFs, three of which have
been included in the most recent Ensembl release (v79). Further, we note that a sizable number of uORFs likely encode functional peptides, including the known case of MKKS [57]. Finally, we observe that the great majority of predicted sORFs is much smaller (median length 11 aa for 3′UTR sORFs in C. elegans to 49 aa for lincRNA sORFs in D. rerio) than annotated sORFs (median length 81-83 aa), with sORFs in 3′UTRs and 5′UTRs typically being among the shortest. In almost all cases, these very short ORFs also span only one exon, while longer sORFs sometimes contain introns (Additional file 1: Figure S1E).
We assembled relevant information for the identified sORFs including coordinates, sequences, transcript models, and features analyzed in the following sections in Additional file 2: Table S1, Additional file 3: Table S2, Additional file 4: Table S3, Additional file 5: Table S4, Additional file 6: Table S5.
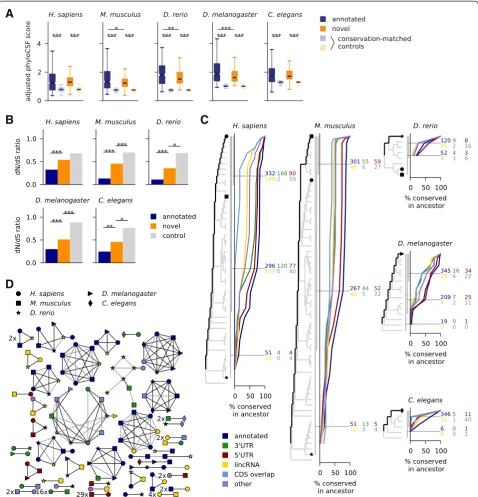
Novel sORFs are under purifying selection on the amino acid level
Since selection on the level of the encoded amino acid sequence permits synonymous sequence variation, we compared length-adjusted phyloCSF scores of predicted sORFs to those of control ORFs matched for their nucleotide-level conservation (Fig. 2a, Additional file 7: Figure S2; Materials and methods). As expected from the design of our pipeline, we find that novel predicted sORFs are specifically depleted of non-synonymous mutations, and in most cases to a similar extent as annotated ones. We also collected polymorphism data to perform a similar but independent test on a popula-tion genomics level: aggregating SNPs from all pre-dicted sORFs (novel or annotated), we measured the dN/dS ratio and found that non-synonymous SNPs are suppressed compared to synonymous ones to a greater extent than in control regions (Fig. 2b; Materials and methods). Possibly due to a higher number of false pos-itives in the set of novel sORFs, the depletion is less pronounced than for annotated small proteins, and the associatedP values are lower in the species with higher SNP density (mouse and fruit fly with 16 and 45 SNPs/ kb in the control regions) than in zebrafish or C. ele-gans with 1.7 and 2.0 SNPs/kb, respectively. It fails to pass the significance threshold in human with 2.4 SNPs/kb, where we get P = 0.076 as the larger value from reciprocal X2tests.
Some novel sORFs are widely conserved
We next sought to evaluate how widely the predicted sORFs are conserved. First, we took an alignment-based approach: we inferred most recent common ancestors from the alignment by tallying the species with conserved
start and stop codons and (if applicable) splice sites, and without nonsense mutations. This analysis depends on the accuracy of the alignment, but it does not require tran-script annotation in the aligned species. Using this method (Fig. 2c) we find that after annotated small proteins,
C
B
A
D
[image:5.595.59.538.89.587.2]uORFs are most widely conserved, followed by the other sORF types. Of the novel sORFs found in human, 342 are conserved in placental mammals and 39 in the gnathos-tome ancestor (that is, in jawed vertebrates). Among sORFs predicted in zebrafish, 18 are conserved in teleosts, 49 fruit fly sORFs are conserved in Drosophilids, and 88 C. eleganssORFs are conserved in worms of the Elegans group.
We also addressed this question with a complementary analysis: we performed a clustering of sORFs predicted in the different species using a BLAST-based approach adapted for short amino acid sequences (Materials and methods). This analysis clusters 1,445 of in total 3,986 sORFs into 413 similarity groups, and 304 of 2,002 novel predictions are grouped into 138 clusters. The clusters containing at least one novel candidate and sORFs from more than one species are summarily shown in Fig. 2d. We find that 65 of 89 clusters involving novel vertebrate candidates are also supported by synteny (Materials and methods), and that some novel predictions cluster to-gether with sORFs annotated in other species, confirm-ing the reliability of our approach and extendconfirm-ing current transcriptome annotations. For instance, several zebrafish lincRNAs are found to encode known small proteins such as cortexin 2, nuclear protein transcriptional regular 1 (NUPR1), small VCP/p97-interacting protein (SVIP), or centromere protein W. Conversely, some lincRNAs from mouse and human encode small peptides with annotated (yet often uncharacterized) homologs in other species. Further, a sORF in the 5′UTR of the worm genemnat-1 encodes a peptide with homology to murine lyrm4 and the fly genebcn92.
We also find 109 clusters of entirely novel predictions, such as 29 sORFs in 5′UTRs and 16 in 3′UTRs conserved between human and mouse, a 15 aa uORF in solute carrier family 6 member 8 (SLC6A8) conserved across vertebrates, or another 15 aa peptide from the 5′UTR of the human gene FAM13B conserved in the 5′UTRs of its vertebrate and fly homologs. One novel 25 aa peptide from annotated lincRNAs is predicted in three vertebrates and four other ones in two out of three. The other 22 human lincRNA sORFs found to be conserved in verte-brates (Fig. 2c) cluster together with annotated sORFs or are not detected in the other species for various reasons: they do not pass the overlap filter, do not use the most up-stream start codon, or lack transcript annotation in mouse and zebrafish. Further, besides the 15 aa uORF peptide in FAM13B, there are also several peptides encoded in 3′ UTRs or of mixed annotation conserved between verte-brates and inverteverte-brates. Two clusters of unclear signifi-cance, consisting mainly of sORFs in the 3′UTRs of zinc-finger proteins, share a common HTGEK peptide motif, a known conserved linker sequence in C2H2 zinc fingers [58]. Finally, we note that our sequence-based approaches
cannot resolve structural and/or functional homologies that persist despite substantial sequence divergence as observed between different animal peptides interacting with the Ca2+ATPase SERCA [31, 32], or between bacter-ial homologs of theE. coliCydX protein [59]. We expect that such homologies between the predicted sORFs could be uncovered using more specialized approaches.
Taken together, this conservation analysis shows that novel sORFs are often widely conserved on the sequence level; further functional homologies could exist that are not detectable by sequence [31, 32].
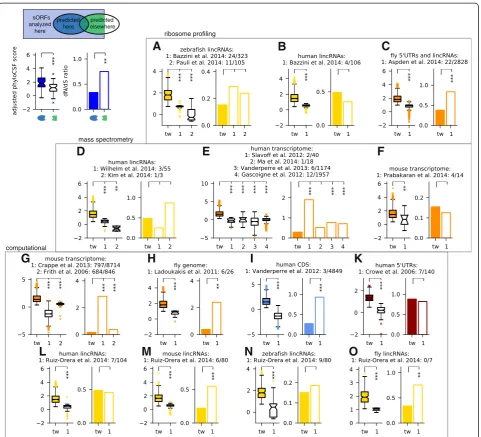
Conserved sORFs are predicted with high stringency
Many recent studies have addressed the challenge of iden-tifying novel small protein-coding genes by means of computational methods or high-throughput experiments. These studies were performed in different species with dif-ferent genome annotations, searching in difdif-ferent genomic regions, allowing different length ranges and using often quite different underlying hypotheses, for instance with respect to non-canonical start codons. Accordingly, they arrive at very different numbers. To reconcile these differ-ent approaches, we inclusively mapped sORFs defined in 16 other studies with published lists of coordinates, se-quences, or peptide fragments, to the comprehensive set of transcriptomic ORFs analyzed here (Additional file 8: Table S6). With the caveat that other studies often priori-tized findings by different criteria, we then compared re-sults with regard to the aspect of main interest here: conservation of the encoded peptide sequence, by means of comparative and population genomics as in Fig. 2a and b. We grouped studies by methodology, and by organism and genomic regions analyzed. We then compared sORFs predicted in our study but not in others to sORFs that were predicted elsewhere and analyzed but rejected here (Fig. 3). We used our results before applying the overlap filter. Considering changes in annotation (for example, of coding sequences, lincRNAs and pseudogenes), we only compared to those sORFs that we analyzed and classified into the corresponding category. Generally, we find rather limited overlap between our predictions and results from other studies, which is only partially explained by differ-ences in applied technique and underlying hypothesis (Additional file 9: Figure S3). We also find that the sORFs that we predict for the first time have consistently much higher length-adjusted phyloCSF scores than those found in other studies but rejected in ours; in many cases, we also find that the dN/dS ratio of non-synonymous vs. syn-onymous SNP density is lower, albeit in a similar number of cases there is not enough data to render thePvalue sig-nificant (we used the larger one from reciprocal X2-tests).
[10], the results of which are re-analyzed with the up-dated transcriptome annotation for comparison. Ribo-some profiling provides evidence of translation in the cell types or developmental stages analyzed, but in addition to coding sORFs it also detects sORFs with mainly regulatory functions such as uORFs. Next, we compared to seven studies employing mass spectrom-etry [17–23]: matching given protein sequences or re-mapping detected peptides to the set of sORFs analyzed here, we find only between one and 12 common results from between three and almost 2,000 sORFs (Fig. 3d-f ).
Note that up to 62 % of peptides identified in these studies come from pseudogene loci which we excluded. While mass spectrometry provides direct evidence for peptide products, it is also performed in specific cell lines or tissues and has limited dynamic range. This can prevent detection of small peptides, which might be of low abundance or half-life, or get lost during sample preparation. Both experimental methods cannot distin-guish sORFs coding for conserved micropeptides from those coding for lineage-specific or fast-evolving func-tional products. It is thus not surprising that these mass spectrometry
ribosome profiling
computational sORFs analyzed
here
predicted elsewhere predicted
here
A
B
D
E
G
H
I
K
L
M
N
O
F
C
[image:7.595.59.541.87.524.2]sORFs are as a group less conserved than the ones found using conservation as a selection criterion.
Next, we compared our results against other computa-tional studies [44, 45, 60–63]. Here, we can often match much larger numbers of sORFs, but except for predictions of the CRITICA pipeline in mouse, which uses conserva-tion as well as sequence statistics [60] and favors longer ORFs, we again find only limited overlap: we predict between 0 and 23 % of analyzed sORFs found elsewhere, indicating a high variability in different computational methods, even though many of them use evolutionary conservation as a filter. The consistently better conserva-tion indicators for our results (Fig. 3g-o) confirm that the deeper alignments and sensitive conservation features used here lead to increased performance. However, we remark that our method is not designed to find sORFs in alternative reading frames [63, 64] unless their evolution-ary signal strongly exceeds what comes from the main CDS (for example, because it is incorrectly annotated); also, the limited overlap with Ruiz-Oreraet al.[62] is not unexpected since their focus was on newly evolved lincRNA sORFs, which are by definition not well con-served, but are often translated (Additional file 9: Figure S3). Finally, Crappé et al.[45] and Ladoukakiset al.[44] limited their search to single-exon sORFs, whereas 66 % and 20 % of sORFs predicted by us in the transcriptomes of mouse and fly, respectively, span more than one exon (Additional file 1: Figure S1E). However, even when restricting the comparison to single-exon sORFs, we find better conservation indicators for our results.
Given the consistently higher phyloCSF scores and often better dN/dS ratios of our sORFs when comparing to other studies, we conclude that our results present a high-stringency set of conserved sORFs coding for puta-tively functional micropeptides.
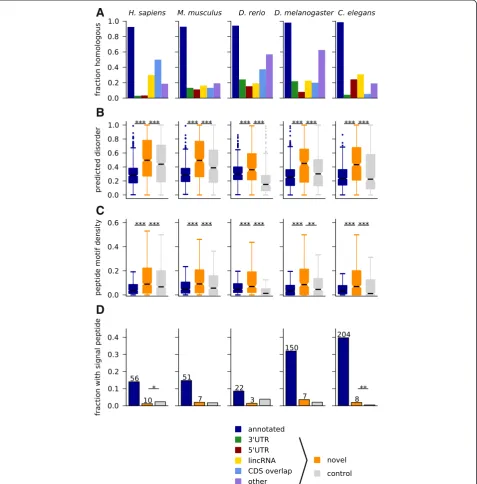
Novel peptides are often disordered and enriched for linear peptide motifs
We next investigated similarities and differences of sORF-encoded peptides to annotated proteins. First, we used amino acid and codon usage to cluster predicted sORFs, short and long annotated proteins, and a negative control consisting of ORFs in non-coding transcriptome regions with small phyloCSF scores (Additional file 10: Figure S4). Looking at amino acid usage, we were surprised to find that our novel predictions in four out of five species clus-tered with the negative control. However, when choosing subsamples of the data, novel predictions also often clustered together with annotated proteins, suggesting that their overall amino acid usage is intermediate, as observed in a related context [65]. Indeed, the frequen-cies of most amino acids lie between those of positive and negative control. Interestingly, however, we found that novel predictions clustered robustly with annotated
proteins when analyzing codon usage (with the excep-tion of fruit fly).
Dissimilarity with annotated proteins was also con-firmed when testing for similarity to the known prote-ome using BLAST. Only a small fraction of novel predictions, mainly those in the ‘CDS overlap’ and ‘other’categories, give significant hits (Fig. 4a). While some novel sORFs are homologous to annotated small proteins as revealed by the clustering analysis in Fig. 2c, there is no significant overlap between the sORFs assigned to similarity clusters and those with similarity to known proteins (Fisher’sP>0.1 for all species except forC. eleganswhereP= 0.003). Hence, even completely novel sORFs are sometimes conserved over wide distances.
We then hypothesized that differences in amino acid composition might give rise to different structural prop-erties. We used IUPred [66] to detect intrinsically un-structured regions, and found that novel predictions are much more disordered than known small proteins or a length-matched negative control (Fig. 4b). This could suggest that the peptides encoded by conserved sORFs adopt more stable structures only upon binding to other proteins, or else mediate protein or protein-nucleic acid interactions [67]. It has recently become clear that linear peptide motifs, which are often found in disordered regions, can be important regulators of pro-tein function and propro-tein-propro-tein interactions [68]. Indeed, when searching the disordered parts of sORF-encoded peptides for matches to motifs from the ELM database [69], we find that the increased disorder comes with a higher density of such motifs in the predicted peptides (Fig. 4c), as was also observed recently for pep-tides identified with mass spectrometry [23].
Since a recent study identifiedtoddler and a number of other non-annotated ORFs with predicted signal se-quences [30], we searched our novel candidates with signalp [70]. Figure 4d shows that a small number of our predicted sORFs contain signal sequences, but this does not exceed expectations from searching a length-matched control set. However, the typically lower amino acid conservation at the N-terminus of signal peptides [30] could imply that some genuine candidates escape our conservation filters.
Taken together, these results show that novel sORF-encoded peptides are different from annotated proteins in terms of amino acid usage and sequence homology, that they are enriched in disordered regions and peptide mo-tifs, and that only few of them contain signal peptides.
3′UTR sORFs are not consistently explained by stop-codon readthrough or alternative terminal exons
file 1: Figure S1C), and they have typically smaller phy-loCSF scores (Additional file 7: Figure S2), but nevertheless we were surprised to find so many of them (between 33 in zebrafish and 229 in human). Although the existence of conserved dORFs was observed before [61], and translation was also detected in ribosome profiling [10], to the best of our knowledge there are no known examples of functional peptides produced from 3′UTRs (with the exception of
known polycistronic transcripts). Therefore we explored the possibility that these ORFs actually represent conserved read-through events as suggested previously [35, 71, 72], or come from non-annotated alternative C-terminal exons.
We first checked 283 read-through events in
Drosophila previously predicted by conservation [71], and 350 detected using ribosome profiling [35]. None of these coincides with any of the 41 sORF candidates
A
B
C
D
[image:9.595.61.539.90.575.2]we find in fly 3′UTRs, even though three of the candi-dates in Jungreiset al.[71] were predicted as conserved and only rejected by the overlap filter. Similarly, none of 42 read-through events detected using ribosome pro-filing in human cells [35] was predicted as conserved. However, three out of eight known or predicted read-through events in human [73] (in MPZ, OPRL1, and OPRK1) and one out of five read-through events predicted inC. elegans(in F38E11.6) [71], were here incorrectly clas-sified as 3′UTR sORFs (naturally, they have an in-frame methionine downstream of the annotated stop codon).
[image:10.595.57.540.496.656.2]Given this small but finite number of false positives, we therefore explored our dORF candidates more sys-tematically. In Fig. 4a, we had already established that dORF-encoded peptides have very little homology to known proteins, in contrast to the domain homology found in Drosophila readthrough regions [71]. Next, we checked that there is a very pronounced conservation step near the stop codon of annotated ORFs containing a predicted sORF in their 3′UTR, even though it is slightly smaller than for control ORFs lacking dORFs (Fig. 5a for human; see Additional file 11: Figure S5A for other species). This indicates that sequence downstream of the stop codons is indeed much less conserved and that these stops are not recently acquired (premature) stop codons or unused due to programmed frameshifts upstream. We made a number of further observations arguing against readthrough: dORFs are not generally close to the annotated stop codon or in the same frame, since we find only a small difference in the distribution of these distances and in most cases no preference for a specific reading frame (Fig. 5b and c; Additional file 11: Figure S5B and C); further, we observe a large number
of intervening stop codons (Fig. 5d and Additional file 11: Figure S5D), and a step in conservation near the dORF start codons significantly more pronounced than for control ORFs in 3′UTRs (Fig. 5e and Additional file 11: Figure S5E). In addition, this observation makes it unlikely that dORFs represent non-annotated alternative terminal exons (where this methionine would not be associated with a conservation step). Further, if such un-annotated exons existed in large numbers, we would expect that at least some of our (overlap filter) pre-dictions overlap with already annotated alternative exons. However, except for Drosophila we only find at most two dORFs with CDS overlap, which is not more than expected compared to non-predicted dORFs (Fig. 5f and Additional file 11: Figure S5F).
In sum, these data suggest that our identification of 3′ UTR sORFs is not systematically biased by conserved readthrough events or non-annotated terminal exons. Notably, we also identified candidates that clearly repre-sent independent proteins, such as a 22 aa dORF in the fly gene CG43200 which is likely another one of several ORFs in this polycistronic transcript.
Experimental evidence for translation of and protein expression from predicted sORFs
Finally, we mined a large collection of publicly available and in-house generated data to verify translation of pre-dicted sORFs and associated protein expression. In order to form expectations as to where and how highly our novel candidates could be expressed, we first analyzed publicly available RNA-seq expression datasets for different tissues (human and mouse) or developmental stages (zebrafish, fruit fly, and worm) (Additional file 12: Table S7).
AAAAAA
read-through or frameshift?
alternative terminal exon?
A B C D E F
We then compared mRNAs coding for short proteins and lincRNAs with conserved sORFs with other mRNAs and lincRNAs, respectively (Additional file 13: Figure S6A). This analysis revealed that annotated short proteins come from transcripts with higher expression and lower tissue or stage specificity than long proteins. Conversely, we find that lincRNAs with predicted sORFs are more highly and widely expressed than other lincRNAs, but not as highly and widely as protein-coding mRNAs [55, 74]. This analysis indicates that peptide products of novel sORFs could be of lower abundance than known small proteins, and that profil-ing translation or protein expression from a limited number of cell lines or tissues might not always yield sufficient evidence [11]. We therefore used several datasets for the subsequent analysis.
First, we mined publicly available ribosome profiling datasets in various human and mouse tissues or cell lines, and from zebrafish, fruit fly, andC. elegans(Additional file 14: Table S8). Several metrics to identify translated regions from such data have been proposed [9, 14–16]; we rely here on the ORFscore method used in our previous publi-cation [10], which exploits the frame-specific bias of the 5′ positions of ribosome protected fragments to distin-guish actively translated regions from those transiently associated with ribosomes or contaminants. It requires relatively deep coverage and a very clear 3 nt periodicity in ribosomal fragments, which is not always easily achievable (for example, due to species-specific ribosome conform-ational properties [11, 35]). We evaluated the ORFscore metric for datasets from human (HEK293 cells [47], KOPT-K1 cells [75] and human brain tissue [76]), mouse (embryonic stem cells [16] and brain tissue [76]), and another zebrafish dataset [9] in addition to the one used before [10]. The performance of these datasets was assessed by comparing ORFscore values of sORFs coding for annotated small proteins to those of the negative con-trol from Fig. 1 by means of the Kolmogorov-SmirnoffD statistic; available datasets forD. melanogaster[35] andC. elegans [77] did not give a satisfying separation between positive and negative control (D<0.55) and were not used. Figure 6a shows that predicted lincRNA sORFs have significantly higher ORFscores than the negative control (P values between 8e-7 and 0.002), and similarly 5′UTR sORFs (P = 2.5e-7 to 0.005) and sORFs in the‘other’ cat-egory (P = 3.5e-7 to 0.04). sORFs in 3′UTRs reach mar-ginal significance in some samples (P = 0.02 for mouse brain and zebrafish). Choosing an ORFscore cutoff of 6 as done previously [10], we find 45 novel sORFs translated in the human datasets, 15 in mouse, and 50 in zebrafish, respectively. We also find evidence for the translation of some non-conserved sORFs in non-coding regions, indi-cating that this set could contain lineage-specific or newly evolved coding ORFs or ORFs with regulatory functions.
Next, we searched for peptide evidence in mass spec-trometry datasets (Additional file 15: Table S9). We analyzed three in-house datasets to be described in detail elsewhere: one for a mix of three human cell lines (HEK293, HeLa, and K562), one for a mix of five human cell lines (HepG2, MCF-10A, MDA-MB, MCF7, and WI38), and one for murine C2C12 myoblasts and myo-tubes. Further, we mined several published datasets: one for HEK293 cells [78], one for 11 human cell lines [79], one for mouse NIH3T3 cells [80], one for mouse liver [81], and whole-animal datasets from zebrafish [82], fly [83, 84], and C. elegans [85]. All datasets were mapped with MaxQuant [86] against a custom database contain-ing our candidates together with protein sequences from UniProt. PSMs (peptide spectrum matches) were identi-fied at 1 % FDR, and those mapping to another sequence in UniProt with one mismatch or ambiguous amino acids were excluded. Using this strategy, we recover between 43 and 131 annotated small proteins per sample and confirm expression for 34 novel predictions in human, 26 in mouse, two in zebrafish, three in fly, and nine in C. elegans (Fig. 6b). For instance, we obtain PSMs for the recently described myoregulin micropep-tide [31] and for the long isoform of the fly tarsal-less gene [26–28]. In total, we find peptidomic evidence for 36 lincRNA sORFs. As observed previously in human [17, 18], mouse [23], and zebrafish [10], we also find PSMs for sORFs in 3′UTRs and 5′UTRs. The MS/MS spectra with peak annotation are shown in Additional file 16: Figure S7, Additional file 17: Figure S8, Additional file 18: Figure S9, Additional file 19: Figure S10, and Additional file 20: Figure S11.
entire human transcriptome. As expected given the sig-nificantly (7.5-fold) larger database, many PSMs (64 of 240) for annotated and novel sORFs now fall below the 1 % FDR cutoff, but none of the spectra supporting the novel identifications is assigned to a different peptide sequence, and additional PSMs identified in these runs have similarly lower quality. Low-quality identifications can also result when posttranslational modifications of known proteins are not considered during the search [87–89] (Bogdanov et al., under review). We therefore re-mapped one of the human datasets allowing for dea-midation or methylation. Both possibilities again lead to a larger search space, such that five and 27 of 117 PSMs, respectively, fail to pass the FDR cutoff. Further,
one of 14 PSMs supporting novel candidates is now at-tributed to a deamidated protein, but seven of 103 PSMs mapping to sORFs in the positive control are also re-assigned, even though most of these sORFs have in-dependent evidence from other PSMs. Even with our stringent criteria, we found that only about half of the novel sORFs identified in mass spectrometry data have read coverage (>1RPKM) in ribosome profiling data (Additional file 21: Table S10, Additional file 22: Table S11, Additional file 23: Table S12, Additional file 24: Table S13, Additional file 25: Table S14), although the lack of matched samples precludes a rigorous comparison. This uncertainty suggests that targeted mass spectrometry approaches, complementary fragmentation techniques, or
A
B
[image:12.595.57.542.89.479.2]validation runs using synthetic peptides [23] should be used to verify expression of ambiguous candidates.
In summary, we cross-checked our predictions against a variety of high-throughput data: RNA-seq indicates that sORF-harboring lincRNAs are not as highly and widely expressed as other mRNAs, but more than lincRNAs without conserved sORFs. Analyzing ribosome profiling and mass-spectrometry data, we find evidence for transla-tion and protein expression from 110 and 74 novel sORFs, respectively, across all datasets.
Discussion
In our search for functional sORF-encoded peptides, we followed the idea that evolutionary conservation is a strong indicator for functionality if the conservation signal can be reliably separated from background noise and other confounding factors, such as overlapping coding sequences or pseudogenes. We therefore used con-servation features that are very specific to known micro-peptides (and canonical proteins), namely a depletion of non-synonymous mutations, an absence of frameshifting indels, and characteristic steps in sequence conservation around start and stop codon. We then chose confident sets of positive and negative control sORFs, both of which have many members that are highly conserved on the nu-cleotide level, and combined these features into a machine learning framework with high sensitivity and specificity. Importantly, our refined pipeline also achieves a more reliable rejection of sORFs on pseudogene transcripts. Pseudogenes are important contaminants since frequent intervening stop codons imply that many of the resulting ORFs are short. While pseudogenes can be translated or under selective constraint [50], sORFs in these genes probably do not represent independent functional or evo-lutionary units.
Our integrated pipeline identifies sORFs comprehen-sively and with high accuracy, but we want to highlight a number of caveats and avenues for future research. First, the scope and quality of our predictions depends on the quality of the annotation: in some species, pseudogenes, lincRNAs, and short ncRNAs (especially snoRNAs and snRNAs) have been characterized much more comprehensively, explaining some of the differ-ences in the numbers seen in Fig. 1d. For instance, a recent study suggests that incomplete transcriptome assembly could lead to fragmented lincRNA identifica-tions that obscure the presence of longer ORFs [90]. Second, the performance of our prediction method depends on the choice of the training data: while we aimed to choose negative controls that are transcribed into important RNA species and therefore often con-served on the nucleotide level, the training set is inevit-ably already separable by length alone, since there are only very few known small peptides below 50 aa, and
very few ORFs on ncRNAs longer than that. A larger number of functionally validated very short ORFs would help to more confidently estimate prediction performance in this length range. In this context, it is important to note that even with low estimated false positive rates we expect a significant number of false discoveries, since the size of the non-coding transcrip-tome likely far exceeds the amount of true coding sequence. The phyloCSF score can be used to rank candidates by confidence (Additional file 7: Figure S2). Third, we remark that in some cases segmental duplica-tions and/or genomic repeats give rise to a number of redundant sORFs, for instance in a 50 kb region on zebra-fish chromosome 9, or on the virtual chromosome U in flies. Fourth, our analysis is currently limited to finding canonical ORFs, even though usage of alternative initi-ation codons could be widespread [15–17, 46, 47]. Alter-native start codon usage might even produce specific conservation signals that could be leveraged to confidently identify ORF boundaries.
Fifth, our approach is limited by the quality of the multiple species alignment: while the micropeptides characterized so far have very clear signatures allowing an alignment-based identification, there could be many instances where sequence conservation within the ORF and its flanking regions is not sufficient to provide ro-bust anchors for a multiple alignment. For instance, functionally homologous micropeptides can be quite di-verged on the sequence level. If additional homologous sequence regions can be reliably identified and aligned, a codon-aware re-alignment of candidate sequences [91] could also help to improve detection power. Further, we currently only tested for a depletion of non-synonymous mutations, but more sensitive tests could be implemented in a similar way [51].
Sixth, since we did not find sORFs from our positive control or other known micropeptides to overlap with each other or longer ORFs, we used a quite conservative overlap filter to choose from each genomic locus one ORF most likely to represent an independent evolution-ary and functional unit. This filter could be too restrict-ive: most importantly for sORFs overlapping annotated long ORFs in alternative reading frames, but also when the CDS annotation is incorrect, or for the hypothetical case that a micropeptide has multiple functional splice isoforms.
some mechanisms for downstream initiation have been proposed [92, 93], 3′UTRs can be expressed as distinct RNAs [94], ribosome profiling gives evidence for dORF translation in zebrafish [10], and some peptide products are found by mass-spectrometry [17–19, 22, 23]. Of course, the distinction between uORFs, main CDS, and dORFs becomes blurry for polycistronic transcripts.
To assess putative functionality of the encoded pep-tides, we tested our candidates for signatures of purify-ing selection; in addition to the expected depletion of non-synonymous mutations in the multiple alignment when comparing to conservation-matched controls, we also found a weaker (but in many cases highly signifi-cant) depletion of non-synonymous SNPs. A closer look at conservation statistics of identified sORFs revealed that many novel predictions are widely conserved be-tween species (for example, almost 350 in placental mammals and almost 40 in jawed vertebrates). By means of sequence similarity clustering, we observed that some of these novel predictions are actually non-annotated homologs of known proteins, but we also found a sizable number of widely conserved uORFs and dORFs. Based on sequence similarity, we could identify six novel predictions that are conserved between verte-brates and inverteverte-brates. This small number is to be ex-pected, since only two of 105 known annotated small proteins similarly conserved are shorter than 50 aa (OST4, a subunit of the oligosaccharyltransferase com-plex, and ribosomal protein L41), and only a minority of our predicted sORFs is longer than that (about 40 % for zebrafish and 20 % for the other species). Given the re-cently discovered functional and structural similarities be-tween different SERCA-interacting micropeptides [31, 32], we expect that additional deep homologies between novel micropeptides might emerge in the future.
We also performed a systematic comparison to 16 pre-viously published catalogs of sORF identifications, both computational and by means of high-throughput experi-ments. While underlying hypotheses, methods, and search criteria varied between studies, they shared the goal of ex-tending genome annotations by identifying novel protein-coding regions. After matching results of other studies to our set of analyzed ORFs, we found in most cases quite limited overlap (Additional file 9: Figure S3), indicating that a broad consensus about sORF characteristics has yet to emerge [37]. However, we observed consistently better indicators of purifying selection for the set of sORFs identified here but not previously versus sORFs identified elsewhere but rejected here. This suggests that our filters result in a high-stringency set of puta-tively functional sORFs. Of course, even non-conserved sORFs can be functional. Specifically, there could be a continuum between ORFs coding for micropeptides and those with regulatory functions (for example, uORFs): we
previously observed [95] that several uORFs inDrosophila with regulatory functions controlled by dedicated re-initiation factors [93] are also predicted here to encode putatively functional peptides, including the fly homolog of the uORF on the vertebrate gene FAM13B. A similar dual role could be fulfilled by sORFs on lincRNAs, whose translation could have the main or additional function of degrading the host transcript via nonsense-mediated decay [12]. Alternatively, such sORFs could represent evolutionary intermediates of novel proteins [62, 65].
To assess transcription, translation, and protein ex-pression of our predicted candidates, we mined high-throughput RNA-seq, ribosome profiling and proteo-mics datasets. First, we used RNA-seq data to show that sORF-harboring lincRNAs are less highly and widely expressed than mRNAs (this is even more the case for lincRNAs without sORFs). In contrast, mRNAs with annotated sORFs are well and widely expressed, and in fact probably often encode house-keeping genes. Unfor-tunately, RNA expression is less useful as an expression proxy for the non-lincRNA categories due to an un-known translational coupling between main ORF and uORFs or dORFs. Given these findings, we expect that experiments for many different tissues, developmental time points, and environmental perturbations, and with very deep coverage, would be necessary to exhaustively profile sORF translation and expression. With currently available data, we could confirm translation of more than 100 conserved sORFs in several vertebrate ribosome pro-filing datasets using a stringent metric (ORFscore [10]), which exploits that actively translated regions lead to a pronounced 3 nt periodicity in the 5′ends of ribosome protected fragments. We also analyzed a number of published and in-house mass spectrometry datasets, and found peptidomic evidence for more than 70 novel candidates.
sequences is also nontrivial. Especially in deep datasets, low-quality PSMs can result from mismatched database hits if the database is incomplete or frequent post-translational modifications have not been considered [87–89] (Bogdanovet al., under review). It is therefore recommended to combine data from multiple sources when selecting candidates for future studies.
Conclusions
We present an extensively annotated catalog of conserved sORFs in the transcriptomes of five animal species. In addition to recovering known small proteins and recently described micropeptides, we discovered many novel sORFs in non-coding transcriptome regions. Most of these novel candidates show robust and confident signatures of purifying selection and are very short, and some are even widely conserved between species. The encoded micro-peptides tend to be disordered and rich in protein inter-action motifs. We mined multiple experimental datasets and obtained evidence for translation and protein expres-sion of about 100 and 70 of our candidates, respectively, while RNA expression data suggest that many other novel sORFs will escape detection due to their restricted expres-sion. In summary, combining evolutionary with experi-mental evidence, our findings provide a confident starting point for functional analysesin vivo.
Materials and methods
Transcriptome annotation and alignments
For all species, we used the transcript annotation from Ensembl (v74). Additionally, we used published lincRNA catalogs for human [55, 96], mouse [97], zebrafish [38, 98], and fruit fly [99], and added modENCODE [56] tran-scripts forC. elegans.
We downloaded whole genome multiple species alignments from the UCSC genome browser (human: alignment of 45 vertebrates to hg19, October 2009; mouse: alignment of 59 vertebrates to mm10, April 2014; zebrafish: alignment of seven vertebrates to dr7, May 2011; fruit fly: alignment of 14 insect species to dm3, December 2006; worm: alignment of five nematodes to ce6, June 2008).
ORF definition and classification
Spliced sequences for each transcript were scanned for the longest ORF starting with AUG and with a mini-mum length of at least 27 nucleotides. We scanned 4,269 unstranded lincRNA transcripts from Young et al. [99] on both strands. ORFs from different tran-scripts but with identical genomic coordinates and amino acid sequence were combined in groups and classified into different categories (using the first matching category for each group): ‘annotated’ if an ORF was identical to the annotated coding sequence of
a protein-coding transcript (that is, biotype‘protein cod-ing’, and a coding sequence starting at the most upstream AUG, without selenocysteins, read-through, or frameshift events). We classified ORFs as ‘pseudogene’if a member of a group came from a transcript or a gene locus anno-tated as pseudogene. We designated as ‘ncRNA’ ORFs (negative controls) those with biotypes miRNA, rRNA, tRNA, snRNA, or snoRNA. Next, ‘3′UTR’ ORFs were classified as such if they resided within the 3′UTRs of canonical protein-coding transcripts, and if they did not overlap with annotated CDS (see below). Analogously, we assigned‘5′UTR’ORFs. In the category‘CDS overlap’we first collected ORFs that partially overlapped with 3′UTR or 5′UTR of canonical coding transcripts. ORFs in the ‘other’category were the remaining ones with gene bio-type ‘protein coding’, or non-coding RNAs with biotypes ‘sense overlapping’, ‘nonsense-mediated decay’, ‘retained intron’, or other types except ‘lincRNA’. Only those non-coding RNAs with gene and transcript biotype‘lincRNA’ were designated‘lincRNA’. To exclude the possibility that alternative reading frames could be translated on tran-scripts lacking the annotated CDS, we finally added those ORFs that were completely contained in the annotated CDS of canonical transcripts to the‘CDS overlap’category if other group members did not fall into the ‘other’ category. Transcripts not from Ensembl were generally designated lincRNAs, except for C. elegans: in this case, we merged the modENCODE CDS annotation with Ensembl, and classified only the‘RIT’transcripts as non-coding, while the ones that did not match the Ensembl CDS annotation were put in the‘other’category. We then added Swiss-Prot and TrEMBL identifiers from the UniProt database (18 November 2014) to our ORFs by matching protein sequences.
Predicting conserved sORFs using a SVM
From the multiple alignments for each ORF, we ex-tracted the species with at least 50 % sequence coverage and without frameshifting indels (using an insertion index prepared before stitching alignment blocks), re-cording their number as one feature. Stitched align-ments for each putative sORF were then scored with
PhyloCSF [51] in the omega mode (options –
strate-gy=omega -f6 –allScores) and the phylogenetic trees available at UCSC as additional input, yielding a second feature. Finally, we extracted phastCons conservation scores [100] in 50 nt windows around start and stop codon (excluding introns but extending into flanking gen-omic sequence if necessary) and used the Euclidean distance of the phastCons profiles from the base-wise average over the positive set as third and fourth feature.
positive and negative sets of sORFs. The positive set con-sisted of those sORFs in the ‘annotated’ category with encoded peptide sequence listed in Swiss-Prot, with at most 100 aa (101 codons) length, some alignment cover-age, and with positive phyloCSF score. The negative set consisted of sORFs from the‘ncRNA’category with align-ment coverage, but without overlap with annotated CDS.
We estimated the performance of the classifier by 100 re-sampling runs, where we chose training data from posi-tive and negaposi-tive set with 50 % probability and predicted on the rest. Prediction of pseudogene sORFs (inset of Fig. 1b) was done either with the SVM, or based on the phyloCSF score alone, using a cutoff of 10 estimated from the minimum average error point in the ROC curve.
Overlap filter
Refining our previous approach [10], we designed an over-lap filter as follows: in the first step, we only kept anno-tated sORFs or those that did not intersect with conserved coding exons. Here we took among the annotated coding exons in Ensembl (v74) or RefSeq (2 September 2014 for mouse, 11 April 2014 for the other species) only those with conserved reading frame, requiring that the number of species without frameshifting indels reaches a threshold chosen from the minimum average error point in the ROC curves of Fig. 1b and Additional file 1: Figure S1 (11 species for human, 10 for mouse, four for zebrafish, seven for fruit fly, and two for worm). In a second step we also required that the remaining ORFs were not contained in a longer ORF (choosing the longest one with the best phyloCSF score) that itself was predicted by the SVM and did not overlap with conserved coding exons.
To exclude CDS overlap for the definition of 3′UTR and 5′UTR sORFs and the design of additional negative controls, we used Ensembl transcripts together with RefSeq (6 February 2014), and added FlyBase (12 December 2013) or modENCODE transcripts [56] for fruit fly and worm, respectively (using intersectBed and a minimum overlap of 1 bp between the ORF and CDS).
Conservation analysis
For the analysis in Figs. 2a and 3, we computed adjusted phyloCSF scores as z-scores over the set of ORFs in the same percentile of the length distribution. Control ORFs were chosen among the non-annotated ORFs without CDS overlap and with their phyloCSF scores chosen among the 20 % closest to zero and then sampled to obtain a statistically indistinguishable distribution of aver-aged phastCons profiles over the ORF.
SNPs were downloaded as gvf files from Ensembl (for human: v75, 1000 Genomes phase 1; for mouse, zebra-fish, and fly: v77); for C. eleganswe took a list of poly-morphisms between the Bristol and Hawaii strains from Vergara et al. [101] and used liftOver to convert ce9
coordinates to ce6. We removed SNPs on the minus strand, SNPs falling into genomic repeats (using the RepeatMasker track from the UCSC genome browser, March 2015), and (if applicable) rare SNPs with derived allele frequency <1 %. We then recorded for each ORF and its conceptual translation the number of synonymous and non-synonymous SNPs, and the number of synonym-ous and non-synonymsynonym-ous sites. For a set of sORFs, we aggregated these numbers and calculated the dN/dS ratio, where dN is the number of non-synonymous SNPs per non-synonymous site, and dS the number of synonymous SNPs per synonymous site, respectively. The control was chosen as before but without matching for nucleotide level conservation.
Alignment conservation in Fig. 2c was scored by ana-lyzing for each ORF the multiple alignment with respect to the species where start and stop codons and (if applicable) splice sites were conserved, and where pre-mature stop codons or frameshifting indels were absent. We then inferred the common ancestors of these species and plotted the fraction of ORFs with common ances-tors at a certain distance to the reference species.
For the graph in Fig. 2d we blasted sORF amino acid se-quences from the different reference species against them-selves and each other (blastp with options‘-evalue 200000 -matrix PAM30 -word_size=2’). We first constructed a directed graph by including hits between sORFs of similar size (at most 20 % deviation) for E-value <10 and an effective percent identity PIDeffgreater than a dynamically
adjusted cutoff that required more sequence identity be-tween shorter matches than longer ones (PIDeff= (percent
identity) × (alignment length) / (query length); after inspecting paralogs or orthologs of known candidates such astarsal-lessandtoddlerwe used the criterion PIDeff> 30
+70 exp(- (query length + subject length)/20)). We then removed non-reciprocal edges, and constructed an undir-ected graph by first obtaining paralog clusters within species (connected components in the single-species sub-graphs) and then adding edges for different reference spe-cies only for reciprocal best hits between paralog clusters. Finally, we removed singletons. For Fig. 2d, we combined isomorphic subgraphs (regarding sORFs in the same spe-cies and of the same type as equivalent), recorded their multiplicity, and plotted only the ones that contain sORFs from at least two different reference species and at least one novel prediction. We then analyzed synteny between vertebrate sORFs in these clusters by using liftOver to convert their genomic coordinates between species, and scored a cluster as syntenic if at least one edge was con-firmed by synteny (allowing for a coordinate mismatch of 10 kb to account for splicing changes).
mouse, and zebrafish; 11 November 2014 for human and 27 November 2014 for the other species) and intersected with our set of ORFs; partial overlap means more than 50 % but less than 99 % on the nucleotide level.
Comparison to other studies
We obtained results from other studies in different formats (Additional file 8: Table S6). Tryptic peptide se-quences were mapped against the set of ORFs we analyzed (requiring preceding lysine or arginine). Amino acid sequences were directly matched to our set of ORFs, and ORF coordinates were matched to our coordinates (in some cases after conversion between genome versions or the removal of duplicate entries). Since different studies used different annotations and different length cutoffs, we then excluded from the matched ORFs the ones not in the category under consideration, for example, longer ORFs, or sORFs that have since then been annotated or with host transcripts classified as pseudogenes. The remaining ones were compared to our set of predictions.
Sequence analysis of encoded peptides
For Fig. 4a, we used blastp against the RefSeq database (December 2013) and collected among the hits with E-value >10-5, percent identity >50, and query coverage >80 % the best hit (based on percent identity) to entries of the same or larger length that were not flagged as ‘PREDICTED’, ‘hypothetical’,‘unknown’,‘uncharacterized’, or‘putative’.
For the disorder prediction in Fig. 4b, we used IUPred [66] in the ‘short’ disorder mode and averaged disorder values over the sequence. For the motif discovery in Fig. 4c, we downloaded the file‘elm_classes.tsv’from the ELM database website ([102]; 27 January 2015). We then searched translated ORF sequences for sequence matches to any of the peptide motifs and kept those that fell into regions with average disorder >0.5. For the signal peptide prediction in Fig. 4d, we used signalp v. 4.1 [70]. Controls in Fig. 4b-d were chosen as in Fig. 2 but matched to the length distribution of novel predicted sORFs.
For Additional file 10: Figure S4A, we counted amino acid usage (excluding start and stop) for all ORFs; amino acids were sorted by their frequency in the positive con-trol (‘long ORFs’), which consists of annotated protein-coding ORFs from Swiss-Prot, whereas the negative control is the same as in Figs. 2 and 4 (not matched for conservation or length). We used hierarchical clustering with the correlation metric and average linkage on the frequency distribution for each group, and checked how often we obtained the same two clusters in 100 re-sampling runs where we took a random sample of ORFs in each group with 50 % probability. For Additional file 10: Figure S4B, we counted codon usage, normalized by the amino acid usage, and then calculated a measure of
codon bias for each amino acid using the Kullback-Leibler divergence between the observed distribution of codons per amino acid and a uniform one (in bits). We then performed clustering and bootstrapping as before.
Analysis of 3′UTR sORFs
For all sORFs in the 3′UTR we obtained the annotated CDS of the respective transcript. We then computed the step in the phastCons conservation score (average over 25 nt inside minus average over 25 nt outside) at the stop codon of the annotated CDS and compared protein-coding transcripts with dORFs that are predicted and pass the overlap filter against other protein-coding transcripts. Similarly, we compared the step around the start codons of dORFs. We also compared the distance between the annotated stop and the start of the dORF, the distribution of the reading frame of the dORF start with respect to the annotated CDS, and the number of intervening stops in the frame of the annotated CDS. We finally checked how many predicted dORFs before applying the overlap filter overlap with annotated coding sequence and compared against the remaining dORFs.
We obtained read-through candidates from Supplemen-tary Data 1 in Jungreiset al.[71] and from Supplementary Tables 2 and 4 in Dunnet al.[35] and matched the corre-sponding stop codons to stop codons in our set of 3′UTR sORFs.
Expression analysis
For the expression analysis of sORF-containing transcripts we used RNA-seq data for 16 human tissues (Illumina Body Map), for 19 mouse tissues [103], for eight develop-mental stages of zebrafish [98], 24 developdevelop-mental stages for fruit fly from modENCODE, and eight developmental stages in C. elegans [85] as shown in Additional file 12: Table S7. Reads were mapped to the reference genome using bowtie2 (with options –very-sensitive) except for human where we downloaded bam files from Ensembl; replicates were merged and then quantified using cufflinks and the Ensembl (v74) transcript annotation file together with the corresponding lincRNA catalogs. We ignored transcripts with all FPKM values below 10-4and converted to TPM (transcripts per million [104]) as TPM= 106 FPKM / (sum of all FPKM). Mean expression values were calculated by directly averaging TPM values of transcripts with non-zero TPM values over samples. Tissue or stage specificity was calculated as information content (IC) over the normalized distribution of relative log-transformed ex-pression values rt¼Xlog2ðTPMtþ1Þ
s
log2 TPMð sþ1Þ
across tissues or
stages, respectively, using the formula IC¼ 1 log2N
X
t
rt
Analysis of published ribosome profiling data
We obtained published ribosome profiling data as sum-marized in Additional file 14: Table S8. Sequencing reads were stripped from the adapter sequences with the Fastqx toolkit. The trimmed reads aligning to rRNA sequences were filtered out using bowtie. The remaining reads were aligned to the genome using STAR, allowing a maximum of five mismatches and ignoring reads that mapped to more than 10 different genomic locations. To reduce the effects of multi-mapping, alignments flagged as secondary alignments were filtered out. We then ana-lyzed read phasing by aggregating 5′read ends over 100 nt windows around start and stop of annotated coding sequences from Ensembl to assess dataset quality and obtain read lengths and 5′ offsets for use in scoring. From the datasets in Additional file 14: Table S8 we calculated the ORFscore as described previously [10], pooling the reads from all samples if possible.
Analysis of in-house and published mass spectrometry datasets
We used three in-house generated mass spectrometry datasets that will be described in detail elsewhere: one in a mixture of HEK293, HeLa, and K562 cells, one in a mixture of HepG2, MCF-10A, MDA-DB, MCF7, and WI38 cells, and one in mouse C2C12 myoblasts and myotubes. Further, we mined published datasets using HEK293 cells from Eravci et al. [78], using 11 human cell lines from Geiger et al. [79], using mouse NIH3T3 cells from Schwanhäusser et al. [80], using mouse liver from Azimifar et al.[81], using zebrafish whole animals from Kelkar et al. [82], using flies from Suryet al. [84] and Xing et al. [83], and using C. elegans from Grün et al. [85]. All datasets (Additional file 15: Table S9) were searched individually with MaxQuant v1.4.1.2 [86] against a database containing the entire UniProt refer-ence for that species (Swiss-Prot and TrEMBL; 18 November 2014) merged with a database of common contaminant proteins and the set of predicted (anno-tated and novel) sORFs (after overlap filter). For fly datasets, an additional E. coli database was used. Max-Quant’s proteinFDR filter was disabled, while the peptide FDR remained at 1 %. All other parameters were left at default values. To be conservative, we then remapped the identified peptide sequences against the combined database (treating Leucin and Isoleucin as identical and allowing for up to four ambiguous amino acids and one mismatch) with OpenMS [105] and used only those peptides that uniquely mapped to our predictions. Fea-tures of PSMs (length, intensity, number of spectra, An-dromeda score, intensity coverage, and peak coverage) were extracted from MaxQuant’s msms.txt files. When re-mapping two human datasets (HEK293 [78] and five cell lines) against the 3-frame translation of the transcriptome,
we created a custom database from all sequences longer than 7 aa between successive stop codons on tran-scripts from Ensembl v74 or published lincRNAs [55, 96]. For the re-analysis of the HEK293 dataset [78], we allowed deamidation (NQ) and methylation/methylester (KRCHKNQRIL) as additional variable modifications [88].
Availability of supporting data
Accession codes for the RNA-seq, ribosome profiling and mass spectrometry datasets re-analyzed in this study are listed in Additional file 12: Tables S7, Additional file 14: Table S8, and Additional file 15: Table S9, respectively. The in-house generated mass spectrometry proteomics data have been deposited to the ProteomeXchange Con-sortium via the PRIDE partner repository with the dataset identifiers PXD002400, PXD002383, and PXD002583.
Additional files
Additional file 1: Figure S1.Overview of the pipeline (relating to Fig. 1).AMany sORFs from the positive control and from the negative control overlap fully or partially with phastCons conserved elements.B The four conservation features all permit to separate positive from negative control (bottom panels); however, the phyloCSF score contributes most strongly to the SVM classifier.CFraction of sORFs predicted as conserved (pre-overlap filter) for each category.DFraction of sORFs retained after overlap filter in each category.ENumber of exons spanned by sORFs in different length ranges. (PDF 1063 kb)
Additional file 2: Table S1.All sORF information for human. (TXT 6997 kb)
Additional file 3: Table S2.All sORF information for mouse. (TXT 3192 kb)
Additional file 4: Table S3.All sORF information for zebrafish. (TXT 734 kb)
Additional file 5: Table S4.All sORF information for fly. (TXT 535 kb)
Additional file 6: Table S5.All sORF information for worm. (TXT 1536 kb)
Additional file 7: Figure S2.(Relating to Fig. 2) non-adjusted phyloCSF scores for sORFs in different categories. (PDF 27 kb)
Additional file 8: Table S6.Summary of datasets used in Fig. 3 (other sORF predictions). (ODS 13 kb)
Additional file 9: Figure S3.Comparison between previous studies (relating to Fig. 3) by Venn diagrams for sORFs in the human transcriptome (A), in human lincRNAs (B), in the mouse transcriptome (C), and zebrafish lincRNAs (D). Results from this study are used before overlap filter. (PDF 999 kb)
Additional file 10: Figure S4.Sequence features of novel peptides (relating to Fig. 4).AAmino acid frequencies in long annotated ORFs, ORFs from non-coding control regions, predicted annotated sORFs and novel predicted sORFs are compared (shown forH. sapiens), and a hierarchical clustering is performed. Percentage values indicate how often the same clusters are obtained in a re-sampling analysis. Hydrophobic, acidic, basic, and hydroxyl residues are colored red, blue, magenta, and green, respectively.BCodon bias is evaluated from the Kullback-Leibler divergence (Materials and methods). Clustering done as in A. (PDF 911 kb)
Additional file 11: Figure S5.Properties of 3′UTR sORFs (same as Fig. 5 for the other species). (PDF 1026 kb)
Additional file 12: Table S7.Summary of datasets used in Additional file 13: Figure S6A and B (RNA-seq). (ODS 11 kb)