M E T H O D
Open Access
Predicting chromatin organization using
histone marks
Jialiang Huang
1,2, Eugenio Marco
1,2,4, Luca Pinello
1,2and Guo-Cheng Yuan
1,2,3*Abstract
Genome-wide mapping of three dimensional chromatin organization is an important yet technically challenging task. To aid experimental effort and to understand the determinants of long-range chromatin interactions, we have developed a computational model integrating Hi-C and histone mark ChIP-seq data to predict two important features of chromatin organization: chromatin interaction hubs and topologically associated domain (TAD) boundaries. Our model accurately and robustly predicts these features across datasets and cell types. Cell-type specific histone mark information is required for prediction of chromatin interaction hubs but not for TAD boundaries. Our predictions provide a useful guide for the exploration of chromatin organization.
Background
Chromosomal DNA is packaged into the nucleosomes, each containing an octamer of histone proteins. Histone modifications are known as post-translational modifica-tions at histone tails, such as acetylation, methylation, phosphorylation, and ubiquitination [1]. Genome-wide distribution of histone modifications can be profiled using chromatin immunoprecipitation followed by high-throughput sequencing (ChIP-seq) [2]. Functionally, histone modifications serve as distinct markers for tran-scriptional regulation and many other biological processes through controlling the accessibility of DNA and recruit-ment of specific proteins [3–6].
In addition to the nucleosome positioning and histone modifications, the chromatin also undergoes additional layers of compaction through DNA looping and folding, forming complex, dynamic 3D structures. Genome-wide mapping of the 3D chromatin organization and its dy-namic changes will provide important insights into the cell-type specific gene regulation and functions of genetic information [7]. A number of technologies, including 3C, 4C, 5C, ChIA-PET and Hi-C, have been developed to experimentally map long-range chromatin interactions [8]. Among these technologies, Hi-C provides the most
comprehensive view of genome-wide chromatin interac-tions [9].
Recently, several Hi-C datasets have been generated and deposited in the public domain [9–15]. Analyses of these data reveal distinct features such as chromatin compart-ments [9], topologically associated domains (TADs) [10], and chromatin loops [12]. However, it remains difficult and costly to map genome-wide chromatin interactions at high-resolution. In contrast, ChIP-seq experiments can be routinely carried out by many labs at much lower cost, and there is already a large amount of data in the public domain. It has been noted that chromatin interactions are associated with distinct patterns of histone modifications [9, 10, 16, 17], suggesting computational predictions may be a cost-effective approach to guide the interrogation of the global landscape of chromatin interactions.
To this end, we have developed a computational model to predict two important features of chromatin organization: chromatin interaction hubs ("hubs" for short) and TAD boundaries. We define hubs as the gen-omic loci with frequent chromatin interactions. Intui-tively, these hubs serve as the nucleation sites of chromatin looping thereby playing an important role in gene regulation. Our analysis shows that these hubs are highly enriched with previously annotated regulatory re-gions. We find that both features can be predicted from histone modification patterns with good accuracy, but these patterns differ significantly in terms of predictive marks and cell-type specificity. The predictions are ro-bust across datasets and cell types.
* Correspondence:[email protected] 1
Department of Biostatistics and Computational Biology, Dana-Farber Cancer Institute, Boston, MA 02215, USA
2
Department of Biostatistics, Harvard T.H. Chan School of Public Health, Boston, MA 02115, USA
Full list of author information is available at the end of the article
Results
Chromatin interaction hubs are enriched with regulatory regions
We analyzed a public, high-resolution Hi-C dataset by
Jinet al.[11], obtained from IMR90 cells, a human fetal
lung fibroblast cell line. In their study, the Hi-C data was normalized by adapting a method previously devel-oped by Yaffe and Tanay [18] to further incorporate nor-malized distance and fragment size jointly [11]. Then, by
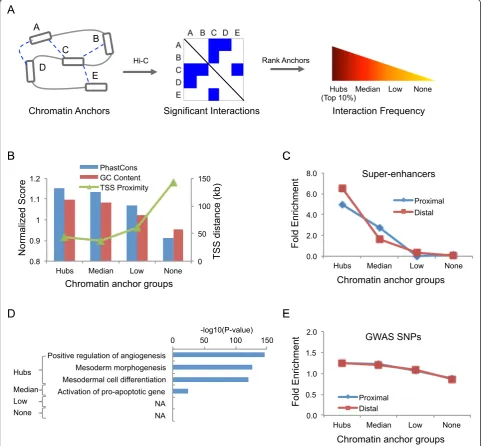
applying a peak calling algorithm, Jin et al. identified a total of 1,116,312 statistically significant chromatin inter-actions among 518,032 chromatin anchors at 5–10 kb resolution by combining multiple consecutive restriction fragments [11]. Based on these significant chromatin in-teractions, we ranked the chromatin anchors according to interaction frequency and classified them into 4 groups (Fig. 1a and Additional file 1: Figure S1A). The “Hubs” group, containing top 10 % of chromatin anchors; the
Fig. 1Overview of chromatin interaction hubs.aDefinition of chromatin interaction hubs. Chromatin anchors are ranked based on the frequency
[image:2.595.57.540.210.656.2]“None” group (~55 %) contains chromatin anchors with-out significant interactions; and the rest was divided into two roughly equal-sized groups, named the “Median” group and the“Low”group, respectively.
We focused on the hubs and hypothesized they may play an important role in gene regulation. To gain insights into their biological functions, we began by searching for distinct genetic features. We found that the DNA se-quence at the hubs was highly conserved (P = 3.9E-60, Student’s t-test; Fig. 1b) compared with the genomic back-ground. The GC content at these hubs was significantly higher (P-value < 2.2E-16, Student's t-test; Fig. 1b). The hubs tended to be closer to the Transcription Start Sites (TSS), with a median distance of 43 kb, compared to other chromatin anchors (Fig. 1b). We also compared the hub locations with super-enhancers, which were previously shown to play an important role in the control of cell identity and diseases [19], and observed a 5-fold enrich-ment comparing to the genomic background. Further analysis showed that the enrichment was slightly higher in distal hubs than proximal ones (Fig. 1c). In total, 75 % of super-enhancers overlapped with at least one hub (Additional file 1: Figure S1B). Furthermore, func-tional enrichment analysis using GREAT [20] showed that genes nearby the hubs were significantly enriched for development-related processes, such as mesoderm
morphogenesis (P-value = 1.0E-126) (Fig. 1d). Recently, integrative analysis of 111 reference human epigenomes reveals that tissue-specific regulatory elements are enriched in disease- and trait-associated genetic variants [21]. Thus, we tested whether these hubs were associ-ated with disease associassoci-ated variants. We found that these hubs were 1.3-fold enriched for the single nucleo-tide polymorphisms (SNPs) in the genome-wide associ-ation studies (GWAS) catalog (Fig. 1e, Methods). Taken together, the above results strongly suggest that the hubs play an important role in the establishment of cell-type specific gene regulatory programs and that genetic variation at these loci may lead to increased risk of diseases.
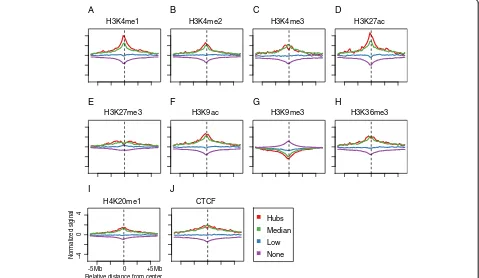
Histone marks are highly effective for predicting hubs To characterize the epigenetic determinants of hubs, we examined the spatial patterns of CTCF and 9 histone marks adjacent to each chromatin anchor (Methods) (Fig. 2). The most distinct features were the elevated levels of H3K4me1 and H3K27ac, both are well-known markers for enhancer elements, around the center of the hubs compared to other chromatin anchors. In addition, there were also significant albeit weaker differences among several other histone marks. In order to systemat-ically investigate how well these hubs could be predicted
Hubs
Low Median
None
Normalized siginal
-5Mb 0 +5Mb
H3K4me1
CTCF
H3K4me2 H3K4me3
H3K9ac H3K9me3
H3K27ac
H3K27me3 H3K36me3
H4K20me1
−4
0
4
Relative distance from center
A B C D
E F G H
I J
Fig. 2Histone mark signatures of hubs.a-jThe distribution of 9 histone marks and CTCF around the center of chromatin anchors. In each panel,
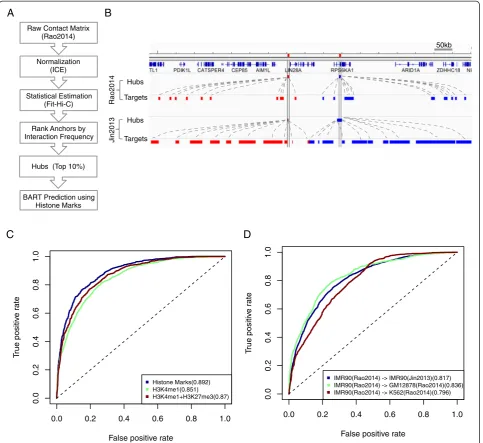
[image:3.595.60.539.414.692.2]from the combination of multiple histone marks, we built a Bayesian Additive Regression Trees (BART) model to classify chromatin anchors based on histone mark ChIP-seq data alone. BART is a Bayesian "sum-of-trees" model [22], averaging results from an ensemble of regression trees (Fig. 3a). Previous studies have shown that BART is effective in modeling various computational biology prob-lems [23].
For each hub, we summarized the local pattern for each histone mark by averaging the sequence reads over a 300 kb window (about twice the average distance
between an anchor and its target site [11]) centered at the hub location. These summary scores were used as input for model prediction. The Negatives set was chosen to be the chromatin anchors with fewest but non-zero interactions and had the same size as the set of hubs (Positives set). The reason for excluding chro-matin anchors associated with no detectable interac-tions was to remove the bias toward mappable genome and GC-rich sequences. To avoid over-fitting, we di-vided the Positives and Negatives sets into two equal subsets used for model training and testing, respectively.
A
B
C
BART Model
H3K4me1
H3K27me3 Yes No
Yes No
H3K27me3
Yes No
P(Y=1|X) = (T1(X) + T2 (X) + … + Tm (X))
-150kb +150kb +
H3K4me1
H3K27me3
D
0 0.1 0.2 0.3 CTCF
H3K4me2 H3K27ac H4K20me1 H3K4me3 H3K9ac H3K36me3 H3K9me3 H3K27me3 H3K4me1
Variable proportion included
Hub
Targets
H3K4me1 H3K27ac H3K27me3 H3K4me3 RNA-Seq
50kb
False positive rate
T
rue positiv
e
r
ate
0.0 0.2 0.4 0.6 0.8 1.0
0.0
0.2
0.4
0.6
0.8
1.0
Histone Marks(0.869) DNA sequence(0.735) HistoneMarks+DNA(0.877) H3K4me1(0.853) H3K27ac(0.816) H3K27me3(0.643) H3K4me1+H3K27ac(0.851) H3K4me1+H3K27me3(0.867)
Fig. 3Prediction of Jin2013 hubs in IMR90 cells.aSchematic of the BART model.bPrediction accuracy using various features. The ROC curves
[image:4.595.49.542.221.686.2]The prediction accuracy was assessed using the testing subset.
We found that the hubs were well predicted using his-tone marks (Area Under the Curve, or AUC = 0.869, Fig. 3b), whereas adding certain DNA sequence informa-tion, such as PhastCons conservation score [24], TSS proximity and GC content did not further improve the prediction accuracy significantly (Fig 3b and Additional file 1: Figure S1C). Among all the marks included in our model, H3K4me1 was the most informative pre-dictor (Fig. 3b-c, Additional file 1: Figure S1D). Of note, H3K27me3 was selected as the second most fre-quently used predictor even though it did not show significant enrichment at the hubs (Fig. 3b, Additional file 1: Figure S1C). To test if this was an artifact, we compared the performance of a reduced model with H3K4me1 and H3K27me3 only with an alternative model with H3K4me1 and H3K27ac only, and found that combination of H3K4me1 and H3K27me3 was more effective (Fig. 3b), suggesting that H3K27me3 provides non-redundant predictive information. This conclusion was further supported by visualization. For example, there was a hub between the gene SKAP1 and the HOXB genes cluster and it interacted with 8 different targets (Fig. 3d). Two of the targets corresponded to H3K27ac peaks, but they also overlapped with H3K4me1 peaks and therefore did not provide additional informa-tion. In comparison, four of the other targets around gene SKAP1 were enriched with H3K27me3 but not H3K4me1. Therefore, this hub could not be predicted without using information from H3K27me3.
Hubs prediction using histone marks is robust across datasets and cell types
To test the robustness of our prediction, we repeated our analysis on a recently published Hi-C dataset with higher spatial resolution in multiple cell-types [12]. To identify hubs from this dataset, we first normalized the raw interaction matrix (at 5 kb resolution) using the ICE (Iterative Correction and Eigenvector Decomposition) algorithm [25]. Then we identified statistically significant chromatin interactions by using Fit-Hi-C [26] (Methods). We ranked the 5 kb segments by the interaction frequency and defined the hubs as the top 10 % segments (Fig. 4a, Additional file 1: Figure S2A), and referred to this set as the Rao2014 hubs in order to distinguish it from the set of hubs defined from ref. 11 (referred to as the Jin2013 hubs). Despite the difference in experimental protocols, these two sets of hubs overlapped quite substantially. About 60 % of the Rao2014 hubs overlapped with the Jin2013 hubs. For example, the chromatin interaction profiles identified from these two datasets were very similar at the LIN28A locus, and the hub locations were nearly identical (Fig. 4b).
To evaluate the robustness of our computational pre-dictions, we used the aforementioned strategy to classify the Rao2014 hubs for the IMR90 cells and compared the results we obtained from the Jin2013 hubs. As before, the prediction accuracy was quite high (AUC = 0.892) (Fig. 4c, Additional file 1: Figure S2B). Of note, H3K4me1 and H3K27me3, the most informative predictors identified by analyzing the Jin2013 dataset, were also highly predict-ive for the Rao2014 dataset (AUC = 0.87). In addition, the BART model trained using hubs from Rao2014 well predicted the hubs in Jin2013 (AUC = 0.817) (Fig. 4d), suggesting the model performance could not be attrib-uted to platform-specific artifacts.
Since our ultimate goal is to use histone mark based predictions to guide chromatin interaction profiling, we tested whether our model developed based on the IMR90 dataset was useful for prediction of chromatin interaction hubs from a different cell-type. We applied this model to predict hubs in two different cell-types: GM12878 and K562, using the cell-type specific histone mark data as in-put. In both cases, the prediction accuracy was good (AUC = 0.836 for GM12878; and AUC = 0.796 for K562) (Fig. 4d). Taken together, these analyses strongly suggest that our model is robust and provides a useful guide for identifying cell-type specific chromatin interaction hubs.
Predict TAD boundaries using histone marks
in our model (Fig. 5c). This observation was somewhat surprising because H3K4me3 was the second most enriched mark at TAD boundaries (Fig. 5a); however, the usage of H3K4me3 in our model was less frequent com-pared to H3K4me1. We reasoned that the discrepancy might be due to the redundancy between H3K4me3 and CTCF. To test whether H3K4me1 was indeed more useful than H3K4me3 in selecting the TAD boundary associated CTCF sites, we compared the performance of model by using CTCF + H3K4me1 and by using CTCF + H3K4me3, we found that the former indeed had more prediction
power (Fig. 5b). Furthermore, we used a simpler approach using the peak information alone (Methods). Out of a total of 26,269 CTCF peaks in IMR90 cells, only 5.9 % overlapped with at least one TAD boundary. This rela-tively low precision might be in part due to the stringent threshold used for identifying the most distinct TADs. For comparison, combining CTCF peaks and negative H3K4me1 peaks (H3K4me1 was depleted at TAD bound-aries) substantially increased the precision to 10.4 %, whereas combining CTCF and H3K4me3 peaks only re-sulted in a modest improvement to 7.0 % (Fig. 5d). These
A
B
C
Raw Contact Matrix (Rao2014)
Normalization (ICE)
Hubs (Top 10%) Statistical Estimation
(Fit-Hi-C)
Rank Anchors by Interaction Frequency
BART Prediction using Histone Marks
False positive rate
T
rue positiv
e r
ate
0.0 0.2 0.4 0.6 0.8 1.0
0.0
0
.2
0.4
0
.6
0.8
1.0
Histone Marks(0.892) H3K4me1(0.851) H3K4me1+H3K27me3(0.87)
False positive rate
T
rue positiv
e r
ate
0.0 0.2 0.4 0.6 0.8 1.0
0.0
0
.2
0.4
0
.6
0.8
1.0
IMR90(Rao2014) -> IMR90(Jin2013)(0.817) IMR90(Rao2014) -> GM12878(Rao2014)(0.836) IMR90(Rao2014) -> K562(Rao2014)(0.796)
D
Targets Hubs
Targets
Rao2014
Jin2013
Hubs
50kb
Fig. 4Analysis of the Rao2014 dataset.aWorkflow for identifying hubs from the raw interaction matrix.bComparison between the Rao2014 and
[image:6.595.58.542.89.532.2]results suggest that lack of H3K4me1 is indeed a signifi-cant signature for TAD boundaries.
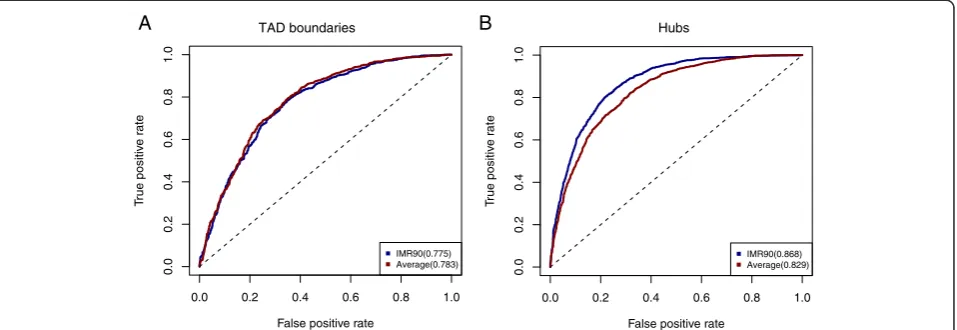
To test whether cell-type specific histone modification profiles were needed for prediction of TAD boundaries, we obtained ChIP-seq data in 8 other cell types (GM12878, H1HESC, HMEC, HSMM, HUVEC, K562, NHEK, NHLF), and used the average profile as input of the BART model (Methods). Despite the lack of data in IMR90 cells, the prediction performance was almost indistinguishable (Fig 6a), thereby supporting our hypothesis. Similarly, the precision of using the CTCF consensus peaks slightly bet-ter than using the IMR90 specific CTCF peaks (Methods, Fig. 5d). This result is consistent with the previous obser-vation that the TAD structure is stable across cell-types
[10, 28]. For comparison, we applied a similar analysis to predict the chromatin interaction hubs, and found that the cell-type specific ChIP-seq data was needed to ob-tain good prediction accuracy (Fig. 6b). Taken together, these results provide new insights into the cell-type spe-cific differences between TAD boundaries and hubs.
Discussion
Genome-wide exploration of the 3D chromatin organization remains a major challenge. Here we develop a compu-tational approach to use widely accessible ChIP-seq data to predict chromatin interaction hubs and TAD boundaries. In both cases, our models result in reason-able prediction accuracy, supporting the validity of this
B
C
A
−500kb 0 500kb
Relative distance from center
Normalized siginal
−0.2
0.0
0.2
0.4
0.6
0.8 CTCF
H3K27ac H3K27me3 H3K36me3 H3K4me1 H3K4me2 H3K4me3 H3K9ac H3K9me3 H4K20me1
D
CTCF peaks in IMR90 5.9%
10.4%
7.0%
6.3% 13.0%
7.2%
0% 5% 10% 15%
CTCF
CTCF+H3K4me1 CTCF+H3K4me3
CTCF
CTCF+H3K4me1 CTCF+H3K4me3
T
AD boundaries %
CTCF consensus peaks
False positive rate
T
rue positiv
e r
ate
0.0 0.2 0.4 0.6 0.8 1.0
0.0
0.2
0.4
0.6
0.8
1.0
Histone Marks(0.774) CTCF(0.703) H3K4me1(0.585) H3K4me3(0.675) CTCF+H3K4me1(0.737) CTCF+H3K4me3(0.734)
0 0.1 0.2 0.3 H4K20me1
H3K27me3 H3K9ac H3K4me2 H3K27ac H3K4me3 H3K9me3 H3K36me3 H3K4me1 CTCF
Variable proportion included
Fig. 5Prediction of TAD boundaries in IMR90 cells.aThe distribution of various histone marks around TAD boundaries.bPrediction accuracy
[image:7.595.56.541.90.495.2]approach. Using computational modeling, we identified distinctive combinatorial histone patterns between chromatin interaction hubs and regions with few interac-tions, and between TAD boundaries and internal domains. This information has advanced our understanding of the determinants of chromatin organization, leading to the hypothesis that these combinatorial patterns may be in-volved in mediating chromatin interactions. This hypoth-esis can now be tested experimentally, for instance by removal of characteristic histone marks via the CRISPR-Cas9 system.
The concept of chromatin interaction hubs is not new. For example, this has been discussed in a previous study of Pol II mediated chromatin interactions [29]. While previous studies have only focused on specific subsets of chromatin interactions, our current work provides an un-biased and genome-wide view of chromatin organization. It is somewhat unexpected that in this broader context the hubs remain highly enriched with regulatory elements. During the preparation of this manuscript, it came to our attention that another group used a similar ap-proach to link dynamic change of histone modification patterns with chromatin interactions [13]. In that study, H3K4me1 was found to be the most informative pre-dictor for the changes of chromatin interaction fre-quency, which is consistent with our current analysis. On the other hand, there are significant differences be-tween that study and our work. Aside from the differ-ences in our prediction outcomes, we also went further in investigating the combinatorial patterns of histone marks, and identified H3K27me3 as an additional in-formative mark for chromatin interaction hubs. Further-more, we showed that TAD boundaries could be predicted without using cell-type specific histone modification
information, which was in contrast with hubs. These re-sults provide new insights into the mechanisms for 3D chromatin structure maintenance.
Conclusions
We define hubs and show that they mark critical regula-tory regions essential in human development and dis-ease. Histone marks are highly effective in predicting hubs and TAD boundaries. H3K4me1 is the most in-formative predictor for hubs, whereas CTCF is the most informative predictor for TAD boundaries. Combination of multiple histone marks significantly improves the pre-diction accuracy. We find that prepre-diction of hubs, but not TAD boundaries, requires cell-type specific histone modification information. Our model is robust across datasets. More importantly, we show that the model built from one cell-type can be used to predict the chro-matin organization in other cell-types. Our computational approach provides a useful tool for guided exploration of the 3D chromatin organization.
Materials and methods Data availability
The Hi-C data in IMR90 cells for defining hubs was obtained from Jin et al. [11], which is available at Gene Expression Omnibus (GEO) with accession number GSE43070. Two files were downloaded from the supple-mentary data. The file“SuppData3_all_anchors.txt” con-tains the locations of all 518,032 anchors covering every HindIII fragment in the human genome, while the file
“SuppData4_target_of_all_anchors.txt” contains the loca-tion of all 1,116,312 significant chromatin interacloca-tions. The Hi-C data for TAD boundaries prediction was ob-tained from Dixon,et al.[10], which is available at GEO B
A TAD boundaries Hubs
False positive rate
T
rue positiv
e
r
ate
0.0 0.2 0.4 0.6 0.8 1.0
0.0
0.2
0.4
0.6
0.8
1.0
IMR90(0.775) Average(0.783)
False positive rate
T
rue positiv
e
r
ate
0.0 0.2 0.4 0.6 0.8 1.0
0.0
0.2
0.4
0.6
0.8
1.0
IMR90(0.868) Average(0.829)
Fig. 6Cell-type specificity of predictions.aComparison of the prediction accuracy of TAD boundaries by using cell-type specific and
[image:8.595.61.540.90.255.2]with accession number GSE35156. The file “Table S4 -Boundaries in mESC, mouse cortex, hESC, IMR90” was downloaded from the supplementary data. The list con-taining 2,208 TAD boundaries in IMR90 cells was used in our study. The ChIP-seq data of CTCF and 9 histone marks (H3K27ac, H3K27me3, H3K36me3, H3K4me1, H3K4me2, H3K4me3, H3K9ac, H3K9me3, H4K20me1) in IMR90 cells were obtained from NIH Roadmap Epige-nome Project [30, 31]. ChIP-seq data of CTCF and 8 his-tone marks (H3K4me1, H3K4me2, H3K4me3, H3K9ac, H3K27ac, H3K27me3, H3K36me3, H4K20me1) in 8 cell types (GM12878, H1HESC, HMEC, HSMM, HUVEC, K562, NHEK, NHLF) were obtained from ENCODE [32, 33]. All the ChIP-seq data mentioned were aligned to hg18 using Bowtie [34] with default parameter setting. Replicate data were merged if avail-able. RNA-Seq data in IMR90 cells were downloaded from Jinet al.[11].
Identify significant chromatin interactions from Rao2014 dataset
The high-resolution, intra-chromosomal raw interaction matrix in three cell types (IMR90, GM12878_combined and K562) at 5 kb-resolution were downloaded from GEO with accession number GSE63525. To remove the various forms of biases [25, 35] in the raw interaction matrix, we normalized it by using the ICE algorithm [25], as implemented in the Hi-Corrector package [36]. Then we used Fit-Hi-C [26] to identify statistically sig-nificant intra-chromosomal interactions, using the pa-rameters -U = 2000000, -L = 10000, with the threshold of FDR = 0.05.
DNA sequence conservation score
DNA sequence conservation was evaluated by using the 44-way multiple alignment PhastCons score, which was downloaded from [24, 37]. The average conservation score over a 300 kb window was calculated for each chromatin anchor.
GWAS catalog SNPs enrichment
The SNPs curated in NHGRI GWAS Catalog [38] were downloaded through the UCSC Table Browser [39]. We expanded the GWAS SNPs to include SNPs in strong linkage disequilibrium (LD) using SNAP [40] and per-form the enrichment using the expanded set. To remove length associated artifacts, we used a 5 kb window around the center to represent each anchor for enrich-ment analysis. An anchor is determined to be hit by GWAS SNPs if there is at least one SNP located in the 5 kb window, which was calculated by Bedtools [41]. For each chromatin anchor group, the fold enrichment over genome background was defined as (m/n)/(M/N), where m and M represent the number of within-group and
genome-wide SNPs respectively, and n and N represent the number of within-group and genome-wide chroma-tin anchors respectively.
Super-enhancer enrichment
The super-enhancers in IMR90 cells were obtained from Hnisz et al. [19]. The overlap between the 5 kb window of chromatin anchors with super-enhancers was defined as those sharing at least 1 bp, which was calculated by using Bedtools intersect [41]. Fold enrichment analysis of super-enhancers was done as for GWAS SNPs.
BART model
The BART model consists of three parts: a sum-of-trees model, a set of priors for the structure and the leaf pa-rameters, and a likelihood function for the terminal nodes [42]. For the binary classification problem, the BART model can be expressed as [22]:
P Yð ¼1jXÞ ¼ ΦðT1ð Þ þX T2ð Þ þX … þ Tmð ÞX Þ
where X represents the histone mark summary scores, Y represents the classification outcome (1 for hub; and 0 otherwise),Ti's represent thei-th regression tree, Φ
de-notes the cumulative density function of the standard normal distribution. BART also reports the usage fre-quency of each predicting variable, which is used as the basis for selecting most informative predictors. We built the BART model using the R package “bartMachine” [22] with default parameters. We also varied the model parameter values, such as different threshold of inter-actions frequency to define Hubs or different BART parameters, and repeated the prediction analysis. We found that the prediction performance was only slightly affected (Additional file 1: Figure S1E-F). The R code to run BART model for predicting chromatin interaction hubs using histone marks information is available in [43].
Prediction of TAD boundaries using CTCF peaks
Additional file
Additional file 1: Figure S1.Prediction of Jin2013 hubs. (A)
[image:10.595.306.537.85.739.2]Distribution of chromatin anchors interactions frequency. Top 10 % are defined as hubs. (B) Percentage of super-enhancers covered by hubs. (C) Prediction accuracy using DNA sequence genetic features, including PhastCons conservation score, TSS proximity and GC content. AUC scores are shown in parentheses. (D) Prediction accuracy using individual histone marks. AUC scores are shown in parentheses. (E) Hubs prediction performance for hubs defined using different thresholds of interactions frequency. (F) Hubs prediction performance with various number of trees. Figure S2.Prediction of Rao2014 hubs. (A) Distribution of chromatin anchors interactions frequency. Top 10 % are defined as hubs. (B) Prediction accuracy using individual histone marks. AUC scores are shown in parentheses.Figure S3.TAD boundary prediction accuracy using individual histone marks. (PDF 1896 kb)
Abbreviations
TAD:Topologically Associated Domains; SNPs: Single Nucleotide Polymorphisms; GWAS: Genome-Wide Association Study; ChIP-seq: Chromatin immune-precipitation followed by high-throughput sequencing; 3C: Chromosome Conformation Capture; 4C: Circularized Chromosome Conformation Capture; 5C: Chromosome Conformation Capture Carbon Copy; ChIA-PET: Chromatin Interaction Analysis by Paired-End Tag sequencing; Hi-C: Genome conformation capture; TSS: Transcription Start Site; BART: Bayesian Additive Regression Trees; ROC: Receiver Operating Characteristic; AUC: Area Under the Curve; ICE: Iterative Correction and Eigenvector Decomposition algorithm; GEO: Gene Expression Omnibus.
Competing interests
The authors declare that they have no competing interests.
Authors’contributions
GCY and JH conceived and designed the experiments. JH performed the experiments and analyzed the data. GCY, JH, EM and LP wrote the paper. All authors read and approved the final manuscript.
Acknowledgements
We thank Dr. Jian Xu for the comments on the manuscript. This work was supported by the NIH grant 5R21HG006778 to G.C.Y. L.P. is supported by NHGRI Career Development Award K99HG008399.
Author details
1Department of Biostatistics and Computational Biology, Dana-Farber Cancer
Institute, Boston, MA 02215, USA.2Department of Biostatistics, Harvard T.H. Chan School of Public Health, Boston, MA 02115, USA.3Harvard Stem Cell Institute, Cambridge, MA 02138, USA.4Present Address: Editas Medicine, Cambridge, MA 02138, USA.
Received: 10 June 2015 Accepted: 31 July 2015
References
1. Kouzarides T. Chromatin modifications and their function. Cell. 2007;128:693–705.
2. Barski A, Cuddapah S, Cui K, Roh TY, Schones DE, Wang Z, et al. High-resolution profiling of histone methylations in the human genome. Cell. 2007;129:823–37.
3. Jenuwein T, Allis CD. Translating the histone code. Science. 2001;293:1074–80. 4. Bernstein BE, Meissner A, Lander ES. The mammalian epigenome. Cell.
2007;128:669–81.
5. Rivera CM, Ren B. Mapping human epigenomes. Cell. 2013;155:39–55. 6. Dong X, Greven MC, Kundaje A, Djebali S, Brown JB, Cheng C, et al.
Modeling gene expression using chromatin features in various cellular contexts. Genome Biol. 2012;13:R53.
7. Dekker J. Gene regulation in the third dimension. Science. 2008;319:1793–4. 8. Dekker J, Marti-Renom MA, Mirny LA. Exploring the three-dimensional
organization of genomes: interpreting chromatin interaction data. Nat Rev Genet. 2013;14:390–403.
9. Lieberman-Aiden E, van Berkum NL, Williams L, Imakaev M, Ragoczy T, Telling A, et al. Comprehensive mapping of long-range interactions reveals folding principles of the human genome. Science. 2009;326:289–93. 10. Dixon JR, Selvaraj S, Yue F, Kim A, Li Y, Shen Y, et al. Topological domains in
mammalian genomes identified by analysis of chromatin interactions. Nature. 2012;485:376–80.
11. Jin F, Li Y, Dixon JR, Selvaraj S, Ye Z, Lee AY, et al. A high-resolution map of the three-dimensional chromatin interactome in human cells. Nature. 2013;503:290–4.
12. Rao SS, Huntley MH, Durand NC, Stamenova EK, Bochkov ID, Robinson JT, et al. A 3D map of the human genome at kilobase resolution reveals principles of chromatin looping. Cell. 2014;159:1665–80.
13. Dixon JR, Jung I, Selvaraj S, Shen Y, Antosiewicz-Bourget JE, Lee AY, et al. Chromatin architecture reorganization during stem cell differentiation. Nature. 2015;518:331–6.
14. Kalhor R, Tjong H, Jayathilaka N, Alber F, Chen L. Genome architectures revealed by tethered chromosome conformation capture and population-based modeling. Nat Biotechnol. 2012;30:90–8.
15. Nagano T, Lubling Y, Stevens TJ, Schoenfelder S, Yaffe E, Dean W, et al. Single-cell Hi-C reveals cell-to-cell variability in chromosome structure. Nature. 2013;502:59–64.
16. Handoko L, Xu H, Li G, Ngan CY, Chew E, Schnapp M, et al. CTCF-mediated functional chromatin interactome in pluripotent cells. Nat Genet. 2011;43:630–8.
17. Libbrecht MW, Ay F, Hoffman MM, Gilbert DM, Bilmes JA, Noble WS. Joint annotation of chromatin state and chromatin conformation reveals relationships among domain types and identifies domains of cell-type-specific expression. Genome Res. 2015;25:544–57.
18. Yaffe E, Tanay A. Probabilistic modeling of Hi-C contact maps eliminates systematic biases to characterize global chromosomal architecture. Nat Genet. 2011;43:1059–65.
19. Hnisz D, Abraham BJ, Lee TI, Lau A, Saint-Andre V, Sigova AA, et al. Super-enhancers in the control of cell identity and disease. Cell. 2013;155:934–47.
20. McLean CY, Bristor D, Hiller M, Clarke SL, Schaar BT, Lowe CB, et al. GREAT improves functional interpretation of cis-regulatory regions. Nat Biotechnol. 2010;28:495–501.
21. Roadmap Epigenomics C, Kundaje A, Meuleman W, Ernst J, Bilenky M, Yen A, et al. Integrative analysis of 111 reference human epigenomes. Nature. 2015;518:317–30.
22. Chipman HA, George EI, McCulloch RE. BART: Bayesian additive regression trees. Ann Appl Stat. 2010;4:266–98.
23. Zhou Q, Liu JS. Extracting sequence features to predict protein-DNA interactions: a comparative study. Nucleic Acids Res. 2008;36:4137–48. 24. Siepel A, Bejerano G, Pedersen JS, Hinrichs AS, Hou M, Rosenbloom K, et al.
Evolutionarily conserved elements in vertebrate, insect, worm, and yeast genomes. Genome Res. 2005;15:1034–50.
25. Imakaev M, Fudenberg G, McCord RP, Naumova N, Goloborodko A, Lajoie BR, et al. Iterative correction of Hi-C data reveals hallmarks of chromosome organization. Nat Methods. 2012;9:999–1003.
26. Ay F, Bailey TL, Noble WS. Statistical confidence estimation for Hi-C data reveals regulatory chromatin contacts. Genome Res. 2014;24:999–1011. 27. Pope BD, Gilbert DM. The replication domain model: regulating replicon
firing in the context of large-scale chromosome architecture. J Mol Biol. 2013;425:4690–5.
28. Pope BD, Ryba T, Dileep V, Yue F, Wu W, Denas O, et al. Topologically associating domains are stable units of replication-timing regulation. Nature. 2014;515:402–5.
29. Sandhu KS, Li G, Poh HM, Quek YL, Sia YY, Peh SQ, et al. Large-scale functional organization of long-range chromatin interaction networks. Cell Rep. 2012;2:1207–19.
30. Bernstein BE, Stamatoyannopoulos JA, Costello JF, Ren B, Milosavljevic A, Meissner A, et al. The NIH Roadmap Epigenomics Mapping Consortium. Nat Biotechnol. 2010;28:1045–8.
31. Roadmap Epigenome Project. ftp://ftp.ncbi.nlm.nih.gov/pub/geo/DATA/ roadmapepigenomics/.
32. Ernst J, Kheradpour P, Mikkelsen TS, Shoresh N, Ward LD, Epstein CB, et al. Mapping and analysis of chromatin state dynamics in nine human cell types. Nature. 2011;473:43–9.
34. Langmead B, Trapnell C, Pop M, Salzberg SL. Ultrafast and memory-efficient alignment of short DNA sequences to the human genome. Genome Biol. 2009;10:R25.
35. Peng C, Fu LY, Dong PF, Deng ZL, Li JX, Wang XT, et al. The sequencing bias relaxed characteristics of Hi-C derived data and implications for chromatin 3D modeling. Nucleic Acids Res. 2013;41:e183.
36. Li W, Gong K, Li Q, Alber F, Zhou XJ. Hi-Corrector: a fast, scalable and memory-efficient package for normalizing large-scale Hi-C data. Bioinformatics. 2015;31:960–2.
37. PhastCons score. ftp://hgdownload.cse.ucsc.edu/goldenPath/hg18/ phastCons44way/placentalMammals/.
38. Welter D, MacArthur J, Morales J, Burdett T, Hall P, Junkins H, et al. The NHGRI GWAS Catalog, a curated resource of SNP-trait associations. Nucleic Acids Res. 2014;42:D1001–6.
39. Karolchik D, Hinrichs AS, Furey TS, Roskin KM, Sugnet CW, Haussler D, et al. The UCSC Table Browser data retrieval tool. Nucleic Acids Res.
2004;32:D493–6.
40. Johnson AD, Handsaker RE, Pulit SL, Nizzari MM, O'Donnell CJ, de Bakker PI. SNAP: a web-based tool for identification and annotation of proxy SNPs using HapMap. Bioinformatics. 2008;24:2938–9.
41. Quinlan AR, Hall IM. BEDTools: a flexible suite of utilities for comparing genomic features. Bioinformatics. 2010;26:841–2.
42. Adam Kapelner, Bleich J. bartMachine: Machine Learning with Bayesian Additive Regression Trees. arXiv. 2013, preprint arXiv:1312.2171. 43. HubPredictor. https://github.com/huangjialiangcn/HubPredictor. 44. Zhang Y, Liu T, Meyer CA, Eeckhoute J, Johnson DS, Bernstein BE, et al.
Model-based analysis of ChIP-Seq (MACS). Genome Biol. 2008;9:R137.
Submit your next manuscript to BioMed Central and take full advantage of:
• Convenient online submission
• Thorough peer review
• No space constraints or color figure charges
• Immediate publication on acceptance
• Inclusion in PubMed, CAS, Scopus and Google Scholar
• Research which is freely available for redistribution