Periodic Pattern Surface Defects Detection Using
Gabor Filter
P. Bala Prasanthi1, M. Sirisha2, Shaik Asma3
Assistant Professor, Department of ECE, Chalapathi Institute of Engineering &Technology
Abstract: surface defects detection is an important aspect of quality control. The surface defects inspection is required on finished products like, leather, textiles, steel rolls etc in order to grade the product and value them. Till recently, these quality inspections are carried out manually by experienced people. The processing of colored images with the pair of features results in better defect analysis than the traditional gray level defect detection techniques. In this paper, for periodic patterns, we present a gabor filtering techniques that is employed to detect the defects on the gray level texture images by considering pair of features. In this, energy is obtained by convolving gabor filter with respective images. The results obtained with this method show 80% - 90% success rate in detecting the defects with different texture.
Keywords: texture, gabor filtering
I. INTRODUCTION
A. What is Digital Image Processing?
The main objective is to imitate the process of human vision electronically. Broadly the sub components of digital image processing are.
1) Image acquisition
2) Pre-processing
3) Segmentatio
4) Representation and description
5) Recognition and interpretation
B. Why Digital Image Processing?
Image is better than any other information form for human beings to perceive.
Humans are primarily visual creatures – above 90% of the information about the world is visual in nature. (A picture is better than a thousand words). However, lot of gap in human vision and machine implementation. e.g.
1) Projection of 3D world to 2D images => loss of information.
2) Dynamic scenes are “Sampled” as frames.
C. Applications of Digital Image Processing 1) Medicine
2) Defence
3) Meteorology
4) Environmental science
5) Manufacture
6) Surveillance
7) Crime investigation
D. Image Segmentation
Segmentation subdivides an image into its constituent regions or objects. The level of detail to which the subdivision is carried depends on the problem being solved. That is, segmentation should stop when the objects or regions of interest in an application have been detected.
Most of the segmentation algorithms in this are based on one of two basic properties of intensity values: discontinuity and similarity. In the first category, the approach is to partition an image based on abrupt changes in intensity, such as edges. The principal approaches in the second category are based on partitioning an image into regions that are similar according to a set of predefined criteria. Thresholding, region growing, and region splitting and merging are examples of methods in this category.
These two regions comprise the overall image region. Figure 1.1(b) shows the result of computing the boundary of the inner region based on intensity discontinuities. Points on the inside and outside of the boundary are black (zero) because there are no discontinuities in intensity in those regions. To segment the image, we assign one level (say, white) to the pixels on or interior to the boundary and another level (say, black) to all points exterior to the boundary.
[image:3.612.185.427.245.355.2]this simple segmentation problem is a predicate that differentiates between textured and constant regions. The standard deviation of pixels values is a measure that accomplishes this, because it is nonzero in areas of the texture region and zero otherwise. Figure 10.1(f) shows the result of dividing the original image into sub regions of size 4X4. Each sub region was then labeled white if the standard deviation of its pixels was positive (i.e. if the predicate was TRUE) and zero otherwise.
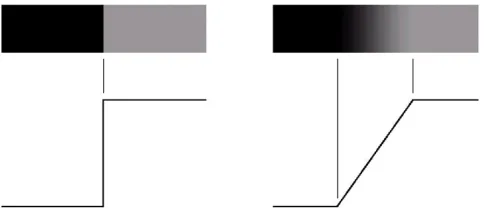
Figure 1.1: Intensity profiles of (a) step (b) ramp
E. Automated Visual Inspection
Defect detection in coloured texture surfaces like wood and tiles in industries plays an important role. For example, in the textile industry, before delivering product to customers, quality check is performed on fabric textures, because sub-standard quality would hamper the price [2]. Currently quality inspection is performed manually but it depends highly on skills of human inspectors and also fails to detect the small defects. Only three-fourth of the defects can be identified manually [3]. So we are adopting automated inspection techniques which results in high quality products and high speed production by identifying the 90% of defects. A defect breaks the homogeneity of the textural surfaces.
In automated inspection homogeneous texture which consists of small defects must be detected exactly. Textures are classified into two major types, structural and statistical [4]. Structural textures consist of periodic patterns in an image. Homogeneous texture consists of repetitive patterns in the image [6].
Texture: The regular repetition of an element or pattern on a surface.
1) Purpose of Texture Analysis
a) To identify the different textured or non-textured regions in an image.
b) To classify or segment different segments in an image.
c) To extract the boundaries between major texture regions.
In this paper, we addressed the defect detection on homogeneous and periodic pattern using gabor filter. The section 2 cover gabor filter formulation, section 3 covers the gray level gabor filtering, section 4 & 5 covers the calculation of gabor filter parameters and the algorithm to detect the defects in periodic pattern.
II. GABOR FILTER
In 1946, Dennis Gabor proposed Gabor expansion is one kind of sampled Short Time Fourier Transform (STFT). Gabor transform uses sliding window to get the local signal and then transform the masked signal into frequency domain. Gabor Transform (STFT), the simplest time-frequency representation, in two-dimensional representation.
)
exp(
*
xx
x
g
j
a
(2.1)
a
y
g
y*
exp(
j
y)
(2.2)Where
a
x is the Gabor transform in x-direction
a
y is the Gabor transform in y-directiong x is the Gaussian function in x-direction
gy is the Gaussian function in y-direction
The Gaussian function [5] along x and y directions can be obtained using the equation (2.3) and (2.4).
) 2 exp( 2 1 2 2 x x x x g
(2.3)
) 2 exp( 2 1 2 2 y y y y g
(2.4)
Where
x is the scale parameter of a Gaussian function
y is the scale parameter of a Gaussian function
The
x and
yfrequency components in equation (2.1) and (2.2) are obtained from equation (2.5) and (2.6).
x
0*
cos
*
f
(2.5)
y
0*
sin
*
f
(2.6)Where
f is frequency of the signal
∝ is the orientation of the signal = 0.1∗( 2)
The gabor transform obeys separable property, thus a 2D gabor transform can be obtained by multiplication of two 1D transforms along x-direction and y-direction. Thus the equation (2.7) gives the expression for 2D gabor transform.
a
a
x*
a
y (2.7)III. GRAY LEVEL GABOR FILTERING
Gray-level image consists of only one chromatic feature f(l,m). The gray-level image must be convolved with Gabor filter in order to get Gabor-filtered output for gray-level images.
The Gabor filter
G
,f,(
l
,
m
)
is in the form of a complex valued function. It consists of real and imaginary parts)
,
(
)
,
(
)
,
(
, , , , ,,
l
m
R
l
m
jI
l
m
G
f
f
f(3.1) Real part of the Gabor filter G,f,(l,m) is
)] sin cos ( 2 cos[ ). , ( ) ,
(l m g l m f l m
Imaginary part of the Gabor filter G,f,(l,m) is )] sin cos ( 2 sin[ ). , ( ) , ( , ,
l m g l m f l m
I f
(3.3) Real component of gabor filter applying for gray-level image
k k x k k y f R l m f f l x m y R x yG (, /, ,) ( , ). , ,( , )
(3.4)
Imaginary component of gabor filter applying for gray –level image
k k x k k y f R l m f f l x m y I x yI (, /, ,) ( , ). , ,( , )
(3.5)
The energy of a filtered image within the window of size W*W is defined by the squared modulus of G(l,m) i.e.
) , , / , ( ) , , / , ( ) , , / ,
(l m
f
G2 l m
f
G2 l m
f
E R I
(3.6)
IV. CALCULATION OF GABOR PARAMETERS
Training sample would be defect free texture of an image. The neighbourhood window is chosen such that the representation of self-similarity of a homogeneous texture pattern is sufficient.Self similarity implies texture that is similar to remaining textures of the image with irrespective of their positions in an image.
Specify the possible ranges of filter parameters σ, f and θ. σmin and σmax are the minimum and maximum values of σ. fmin and
fmax give the minimum and maximum values of the frequency parameter f, and they can be set to fmin=1 and fmax=W (the width of the neighbourhood window). The orientation parameter ∝ is 0° to 180°
The algorithm used in this paper is exhaustive search with resolution of one. Take a faultless image and make it into different no. of samples using non overlapping window. Consider a single sample and apply exhaustive search algorithm to find minimum energies for different values of
,
f
,
. Now it consists of energy values for each and every values of
,
f
,
. Among all those valuestake the least energy value of that particular faultless sample. And the values at that particular energy is considered as
min
min,
min,
f
A. Exhaustive Search Algorithm
An optimization algorithm is a procedure which is executed iteratively by comparing various solutions till an optimum or a satisfactory solution is found.
Design variables: The formulation of an optimization problem begins with identifying the underlying design variables, which are primarily varied during the optimization process. A design problem usually involves many design parameters, of which some are highly sensitive to the proper working of the design. These parameters are called design variables in the parlance of optimization procedures. Other (not so important) design parameters usually remain fixed or vary in relation to the design variables.
The final task of the formulation procedure is to set the minimum and the maximum bounds on each design variable. Certain optimization algorithms do not require this information. In these problems, the constraints completely surround the feasible region. Other problems require the search algorithm within these bounds.
V. ALGORITHM A. Steps involved in Proposed Algorithm
Step1: Take a texture surface without defects. Textures used in this paper are Periodic.
Step 2: Apply non overlapping window for an image to make into N no. of samples. Here window size is of 16 X 16 for periodic texture
N=square of the ratio of size of image to the size of window chosen.
Step 3: Consider any one of the sample in N no. of samples and find the minimum energy of that particular sample.
Step 5: In accordance to the variations of Gabor parameters values energy varies with different values. Among all different energy values have to find out the minimum value of energy by using exhaustive search algorithm. Using this algorithm Gabor filter parameters would be obtained by obeying the conditions in equations (5.1), (5.2), (5.3), (5.4) . The parameters at which the energy is minimum are called as Gabor filter parameters and described below how they are obtained.
Gabor filter parameters of Training sample is obtained based on some conditions like
Min
E
C(
l
0,
m
0/
,
f
,
)
(5.1)
min
max (5.2)
f
min
f
f
max (5.3)
0
180
0 (5.4)Step 6: The minimum energy is named as E and the parameters at which the minimum energy obtained is named as
min min min
min
,
,
,
x yf
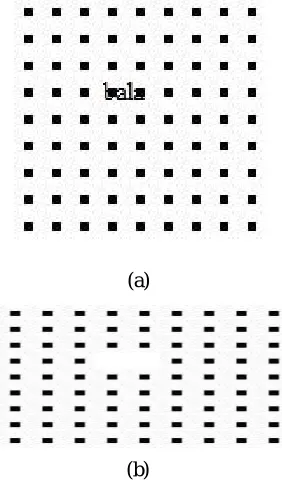
.Step 7: Now capture the texture surfaces with defects. In this Paper we have done analysis on periodic textures with defects as shown in Figure 5.2.
Step 8: Apply window for grey-level images to get the samples.
Periodic texture: If overlapping window is applied to for periodic textures then similarity between each and every sample are going to reduce. So non-overlapping window is applied for this kind of textures.
Step 9: Consider one sample for applying Gabor filter among k no. of samples.
Step 10: Take the Gabor filter parameters which are obtained by applying exhaustive search algorithm from step5. Now these Gabor
filter parameters are
xm,
ym,
f
m,
m considered as minimum and the energy obtained using these values is considered as minimum energy.Step 11: Now apply Gabor filter at parameter values
xm,
ym,
f
m,
m to get the minimum energy of particular sample. Apply those values on each and every sample. Energy must be same for each and every sample since the texture we have taken is periodic.B. Process for Defect Detection
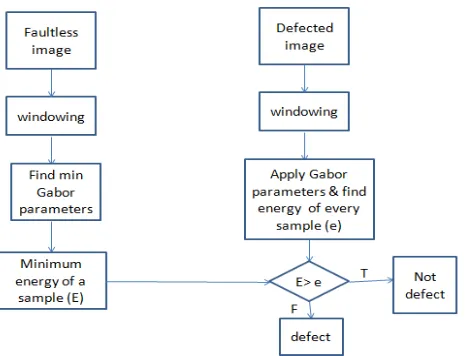
The following is the flow chart to detect the defects in periodic patterns.
[image:6.612.217.454.515.693.2]
C. Simulation Results for periodic pattern with plain surfaces
In this paper we have taken a periodic pattern with plain surface and a defect is introduced as shown in figure 5.2 (a). By applying the gabor filter the defect is detected and is removed as shown in figure 5.2(b).
(a)
[image:7.612.237.378.117.359.2](b)
Figure 5.2: (a) Defected pattern of periodic image (b) Defect detected output image for
VI. CONCLUSION
In this paper Gabor filtering approach is applied for periodic patterns. Using Gabor filter, defects are detected efficiently for different window sizes. If window size is small, defect can be localized exactly with the cost of computational complexity.
REFERENCES
[1] Du-Ming Tsai *. Department of Industrial Engineering and Management, Yuan-Ze University, 135 Yuan-Tung Road, Nei-Li, Tao-Yuan 32026,Taiwan, ROC. [2] K. Srinivasan, P. H. Dastoor, P. Radha krishnaiah, and S. Jayaraman, “FDAS: A knowledge-based framework for analysis of defects in woven textile
structures”, J. Textile Inst., pt. 1, vol. 83, no. 3, pp. 431-448, 1992
[3] H. Sari-Sarraf and J. S. Goddard, “Vision systems for on-loom fabric inspection”, IEEE Trans. Ind. Appl., vol. 35, pp. 1252-1259, Nov-Dec, 1999
[4] A. Pikaz and A. Averbuch, “An efficient topological characterization of gray-levels textures using a multi resolution representation,” Graphical Models and Image Processing, 59, pp. 1-17, 1997
[5] G. Healey, and D. Slater: 'Global color constancy: recognition of objects by use of illumination invariant properties of color distribution', Journal of the Optical Society of America A: Optics, Image Science and Vision, 1994, 11(11), 3003-3010.
[6] www.ijest.info/docs/IJEST11-03-04-032.pdf