6
I
January 2018
Quantitative Determination of Elements in
Soymida Febrifuga Medicinal Plant by Using PIXE
and ICP-MS Techniques
J. Chandrasekhar Rao1, P. Sarita2, G. J. Naga Raju3
1, 2
Department of Physics, GIT, GITAM University, Visakhapatnam-530 045, India
3
Department of Physics, JNTUK-UCEV, Vizianagaram-535 003, India
Abstract: Soymida Febrifuga, commonly known as Indian Redwood or Mamsarohini of family Meliaceae, is a reputed folk medicinal plant whose bark is extensively used in treating diabetes mellitus (DM). The main objective of the present work is to evaluate the concentrations of elements in Soymida Febrifuga medicinal plant collected from different regions by using Particle Induced X-ray Emission (PIXE) and Inductively Coupled Mass Spectroscopy (ICP-MS) techniques. In the present study, PIXE measurements were carried out by using the 3 MV Pelletron Accelerator facility available at Ion Beam Laboratory, Institute of Physics, Bhubaneswar, India. After digesting the plant species by employing Microwave Accelerated Reaction System (MARS 5), the Agilent 7700 series ICP-MS system available at Centre for Study on Bay of Bengal, Andhra University, Visakhapatnam, India was used for the ICP-MS analysis. The reliability of the experimental conditions and parameters used in the analysis of experimental data were checked by analysing Certified Reference Materials. The results obtained in this study reveal the presence of twenty-five elements Li, Be, Al, Cl, K, Ca, Ti, V, Cr, Mn, Fe, Co, Ni, Cu, Zn, As, Se, Br, Rb, Sr, Ag, Cd, Ba, Pb and U in Soymida Febrifuga medicinal plant. Among these, the elements K, Ca, V, Cr, Mn, Fe, Co, Ni, Cu and Zn are implicated in the regulation of insulin and the control of blood-sugar levels in the human body. Quantitative estimation of trace element concentrations is important for determining the effectiveness of this plant in treating DM and for understanding its pharmacological action.
Keywords: PIXE, ICP-MS, trace elements, diabetes mellitus, Soymida Febrifuga. I. INTRODUCTION
Modern lifestyle might have turned around our lives for the better in many ways but has also brought in its share of diseases. "In today's vastly changing lifestyle, the number of people who are being affected by diabetes mellitus (DM) is growing by leaps and bounds. Various research studies have shown a relationship between DM and trace elements [1]. In most of the cases, a change in the metabolism of these trace elements was exhibited [2–5]. Some trace elements like zinc, chromium, vanadium, manganese, molybdenum and selenium were found to potentiate insulin action [6]. It is suggested that trace elements influence activation of insulin receptor sites by acting as cofactors or components of enzyme systems that are engaged in glucose metabolism [7, 8]. Trace elements help in increasing insulin sensitivity and also act as antioxidants for preventing tissue peroxidation [9].Due to low cost and minimal side effects, usage of plant based medicines is increasing day by day throughout the world. Soymida Febrifuga is one among the several medicinal plants that have proven to be effective in the treatment of DM. Commonly known as Indian Redwood or Mamsarohini of family Meliaceae, Soymida Febrifugais a reputed folk medicinal plant whose bark is extensively used in treating DM. It is an endemic plant that grows wildly in all dry deciduous forests of Andhra Pradesh, India [10].Yoga Narasimhan et al. showed that the extracts of this plant have good activity against ulcers, tridosha fevers, leprosy, dysentery and diarrhoea [11]. The bark extract of Soymida Febrifugais reported to have antioxidant and hypoglycaemic activity [12,13].The main objectives of this work is to identify the elements present in Soymida Febrifuga medicinal plant collected from different regions and evaluate their concentrations by using Particle Induced X-ray Emission (PIXE) and Inductively Coupled Mass Spectroscopy (ICP-MS) techniques.
II. MATERIALSANDMETHODS A. Sample Collection
samples were collected and washed with tap water to remove surface dust and impurities. They were then rinsed in distilled water,
shade dried and cut to smaller pieces before finally drying in an oven at 600Cfor about 24 hours.
B. Sample Preparation
The oven dried samples were ground in an agate mortar for pulverizing the samples. For PIXE analysis, to monitor the beam current 60 mg of high purity graphite was mixed with each powdered sample of 90 mg.A known quantity of yttrium with known concentration (100 ppm) was added as an internal standard to the samples to check the reliability of the experimental results.The resulting mixture of each sample weighing 150 mg was pressed into a pellet using a 10-ton hydraulic press.These pellets were then used as targets for the PIXE experiment. For ICP-MS analysis, 50 mg of each powdered sample was taken into a high-pressure
closed teflon decomposition vessel and1mL of concentrated HNO3 (Trace metal grade, Fisher Make) was added to it. After 30
minutes of pre-digestion, 4 mL of Milli-Q water was added to 1mL of each acid mixture and the vessels were slowly shaken and sealed. Consequently, decomposition of the samples was carried out in a programmed Microwave Accelerated Reaction System (MARS5, SEM, USA). Finally, the digested samples were transferred to a 25 mL volumetric flask and made up the volume with Milli-Q water. Blanks were also prepared in the same manner by excluding the sample.
C. PIXE and ICP-MS Techniques
Elemental analysis was carried out by using two techniques: Particle Induced X-ray Emission (PIXE) and Inductively Coupled Plasma Mass Spectroscopy (ICP-MS). PIXE experiments were carried out at Institute Of Physics, Bhubaneswar, India using 3 MV Tandem Pelletron Accelerator facility. A 3 Me V proton beam was used to excite the samples.The characteristic X-rays emitted from the sample were recorded with a high resolution Si (Li) detector and the resultant spectra were analysed using Guelph PIXE (GUPIXWIN) software package [14]. The details of the PIXE setup used in this work can be found elsewhere in our earlier works
[15, 16].The obtained PIXE spectra of Soymida Febrifuga medicinal plant corresponding to the four different regions are shown in
[image:3.612.108.521.423.700.2]Fig. 1. ICP-MS analysis has been carried using Agilent 7700 series ICP-MS system available at Centre for Study on Bay of Bengal, Andhra University, Visakhapatnam, India. The operating parameters for ICP-MS analysis and details of the standards used to check the reliability of the techniques is discussed in our earlier works [17,18]
Fig.1. PIXE spectra of Soymida Febrifuga medicinal plant collected from four regions.
2 4 6 8 1 0 1 2 1 4 1 6 1 8
100 101 102 103 104 C o u n ts
E ner g y (Ke V )
V izi an a ga ram
S e F e (K
)
Y ( K)
Y ( K)
S r R b Br Zn ( k)
Zn ( k)
C u F e (K)
V M n T i C l K C a
2 4 6 8 10 12 14 16 18
1 00
1 01
1 02
1 03
1 04
E n er gy (Ke V )
V isa kh ap atn am
S e F e (K)
Y( K)
Y (K)
S r R b Br Zn ( k)
Zn (k
)
C u F e ( K)
V Mn Ti C l K C a
2 4 6 8 1 0 1 2 1 4 1 6 1 8
100 101 102 103 104 C o u n ts
E ner g y (Ke V )
V i ja ya w a d a
Se F e (K)
Y (K)
Y ( K)
S r
R b B r Zn ( k)
Zn ( k)
C u F e (K)
V M n T i C l K C a
2 4 6 8 10 12 14 16 18
1 00
1 01
1 02
1 03
1 04
E n erg y ( KeV )
T a de p alligu d em
S e Fe ( K)
Y( K)
Y (K)
S r
R b Br Zn ( k)
Zn (k)
C u F e (K)
III.RESULTSANDDISCUSSIONS
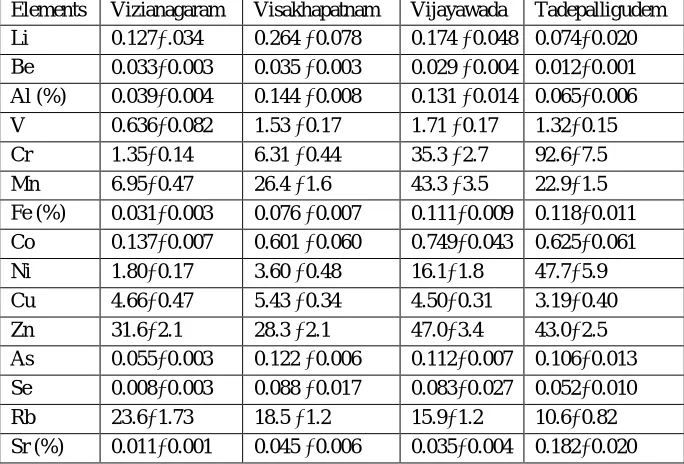
[image:4.612.136.477.292.459.2]The results of PIXE and ICP-MS measurements of the Soymida Febrifuga medicinal plant under investigation are presented in Table 1 and Table 2 respectively. The depicted concentration of each element is the mean value of ten samples along with the standard deviation (SD). The concentrations of all the elements are in parts per million (ppm) unless otherwise specified. Reasonably good agreement was found between our PIXE and ICP-MS results for reference standards and the certified values. Eleven different elements namely Cl, K, Ca, Ti, V, Mn, Fe, Cu, Zn, As and Sr were determined by using PIXE whereas twenty different elements Li, Be, Al, V, Cr, Mn, Fe, Co, Ni, Cu, Zn, As, Se, Rb, Sr, Ag, Cd, Ba, Pb and U were determined by using ICP-MS in Soymida Febrifuga medicinal plant. Some of the elements detected in this medicinal plant such as K, Ca, Mn, Cu, Zn and V are involved in controlling blood glucose levels in human body. The anti-oxidant activities of these elements also help in managing DM. Moreover these elements are known to have insulin generating property via secretion of insulin from the beta cells of the islets of Langerhans. Hence, it is very essential to ensure that these elements have to be maintained within the required levels in the human body. If the studied plant does not contain any poisonous organic constituents then the detection of these elements in this plant signifies the importance of its traditional medical use in the treatment of DM.
TABLE.1
CONCENTRATION OF ELEMENTS(PPM) IN SOYMIDA FEBRIFUGA MEDICINAL PLANT FROM FOUR REGIONS BY PIXE ANALYSIS
Elements Vizianagaram Visakhapatnam Vijayawada Tadepalligudem
Cl (%) 0.494±0.398 0.419±0.073 0.267±0.045 0.626±0.205
K (%) 1.32±0.15 0.479±0.015 0.705±0.011 1.15±0.04
Ca (%) 3.66±0.02 5.15±0.03 5.90±0.033 1.95±0.11
Ti 0.011±0.002 0.012±0.002 0.022±0.001 0.017±0.002
V 2.0±0.36 2.90±0.54 7.90±1.27 2.7±0.486
Mn 15±2.85 32±6.72 55±17 23±4.60
Fe (%) 0.123±0.041 0.156±0.015 0.167±0.026 0.175±0.091
Cu 7.7±4.9 18±2.90 7.1±1.21 6.7±1.07
Zn 32±5 26±20 92±10 85±44
As 0.143±0.024 1.81±0.342 4.39±0.746 0.89±0.186
[image:4.612.135.477.501.733.2]Sr (%) 0.029±0.001 0.054±0.008 0.021±0.003 0.191±0.018
TABLE 2
CONCENTRATION OF ELEMENTS (PPM) IN SOYMIDA FEBRIFUGA MEDICINAL PLANT FROM FOUR REGIONS BY ICP-MS ANALYSIS
Elements Vizianagaram Visakhapatnam Vijayawada Tadepalligudem
Li 0.127.034 0.264 0.078 0.174 0.048 0.0740.020
Be 0.0330.003 0.035 0.003 0.029 0.004 0.0120.001
Al (%) 0.0390.004 0.144 0.008 0.131 0.014 0.0650.006
V 0.6360.082 1.53 0.17 1.71 0.17 1.320.15
Cr 1.350.14 6.31 0.44 35.3 2.7 92.67.5
Mn 6.950.47 26.4 1.6 43.3 3.5 22.91.5
Fe (%) 0.0310.003 0.076 0.007 0.1110.009 0.1180.011
Co 0.1370.007 0.601 0.060 0.7490.043 0.6250.061
Ni 1.800.17 3.60 0.48 16.11.8 47.75.9
Cu 4.660.47 5.43 0.34 4.500.31 3.190.40
Zn 31.62.1 28.3 2.1 47.03.4 43.02.5
As 0.0550.003 0.122 0.006 0.1120.007 0.1060.013
Se 0.0080.003 0.088 0.017 0.0830.027 0.0520.010
Rb 23.61.73 18.5 1.2 15.91.2 10.60.82
Ag 0.1700.067 0.119 0.054 0.0170.007 0.0090.005
Cd 0.0430.007 0.161 0.016 0.0960.013 0.0690.008
Ba 1033.3 135 5 99.27.8 2379
Pb 0.430.05 0.231 0.034 0.8020.110 0.1040.010
U 0.0390.008 0.010 0.002 0.0020.0004 0.0030.001
From the studies of Kowluru et. al. tis evident that Zn regulates the body metabolism and due to its anti-oxidant property it also helps in proper function of immune system [19].The relationship between DM, insulin and Zn is complex, with no clear cause and effect relationships. Zinc plays an important role in the generation, secretion and storage of insulin. It also has the ability to manage both blood glucose and lipids [20]. In the studied plant the concentration of Zn is in the range of 26 ppm to 92 ppm which is within the permissible limit. Vanadium contributes to carbohydrate metabolism including glucose transport, glycolysis, glucose oxidation, and glycogen synthesis [21]. Vanadium acts as an insulin simulating agent, which increases insulin activity and insulin sensitivity. Although some symptoms associated with DM were found to improve by Vtreatment, it supplementation is not suggestible because of severe toxic side effect associated with it [22]. In our studied plant, the concentration of V is in the range of 0.636 ppm to 7.90 ppm which is within the permissible limit. Various studies have shown that the enzymes activated byMn play key roles in the metabolism of carbohydrates, amino acids and cholesterol. Manganese helps in glucose metabolism and it is required for normal synthesis and secretion of insulin [23]. The concentration of Mn is in the range of 15 ppm to 55 ppm which is within the permissible limit. In our present study the samples collected from Vijayawada region have the highest concentration of Zn, V and Mn.
Insufficiency of Cucauses glucose intolerance, decreased insulin response and increased glucose response. It is linked with hypercholesterolemia and atherosclerosis. Copper possesses an insulin-like activity and promotes lipogenesis. Recent studies however show no statistical difference in the level of Cu in diabetic and healthy subjects [24, 25]. The concentration of Cu is in the range of 3.19 ppm to 18 ppm which is within the acceptable limit and is found to be high in the samples collected from Vijayawada region. The adequate supply of Fe is essential for the functioning of many biochemical processes, including electron transfer reactions, gene regulation, binding and transport of oxygen, regulation of cell growth and differentiation and is also involved in the proper function of immune system [26]. Impaired glucose metabolism and DM are common clinical manifestations of Fe overload in patients with hemochromatosis [27]. In our studied plant Fe is in the range of 0.031% to 0.175% which is within the acceptable limit and is found to be high in the samples collected from Tadepalligudemregion. Selenium is a basic component of selenoprotein which is an important enzyme in the human body. The antioxidant property of Sehelps in preventing the development of complications in diabetic patients [28, 29]. The concentration of Se is in the range of 0.052 ppm to 0.088 ppm which is within the acceptable limit and is found to be high in the samples collected from Vizianagaram region.
Macro elements are the natural elements which play a significant role and are highly needed by the body. Macro elements include potassium (K), calcium (Ca) and chlorine (Cl). Potassium is an electrolyte and previous studies have shown that an electrolyte imbalance results in kidney failure, dehydration, fever and vomiting which are one of the contributing factors for complications observed in DM and other endocrine related disorders [30]. In our studied plant the concentration of K is in the range of 0.479% to 1.32% which is within the acceptable limit and is found to be high in the samples collected from Vizianagaram region. Calcium has been related with faulty insulin release, insulin resistance and glucose intolerance in humans [31]. In this study Ca is in the range of 3.66% to 5.9% which is within the acceptable limit and is found to be high in the samples collected from Vijayawada region. Arsenic and Cd have no beneficial purpose inside the body and are highly toxic. Several studies have shown that As causes insulin resistance and oxidative stress while Cd inhibits insulin release and damages insulin receptors. Cadmium damages the key pathways through which the body regulates glucose metabolism. Very low concentrations of As, Cd and Pb have been determined by ICP-MS technique in our studied samples. The presence of As, Cd andPb, though at very low levels, warrant great caution to be exhibited while prescribing this plant for the treatment of DM in order to avoid metal toxicity.
IV.CONCLUSIONS
V. ACKNOWLEDGMENT
The authors thank the authorities and staff of Ion Beam Laboratory, Institute of Physics, Bhubaneswar, for providing the Pelletron Accelerator facility and for rendering technical assistance. One of the authors, J Chandrasekhar Rao, is thankful to UGC, New Delhifor sanctioning minor projectto carry out this work. Sri .G. Suryanarayana Varma, local herbal practitioner is appreciated his constant help during the sample collection..
REFERENCES
[1] R.K. Murray, D. Granner, P. Mayes and V. Rodwell, Harper’s Biochemistry USA: Appleton and Lange, 2000. [2] M.A. Powers, Handbook of Diabetes Nutritional Management. Maryland: Aspen Publishers Inc, 1987, p. 195. [3] A.B. Chausmer, Zinc, insulin and diabetes, J Am College Nutr, vol.17, pp.109–14, 1998.
[4] H. Nielsen Forrest, “New essential trace elements for the life sciences,” Biological Trace Element Research. Vol. 26-27(1), pp. 599–611, 1990.
[5] A.G. Nerlich, U. Sauer, V. Kolm-Litty, E. Wagner, M. Koch and E. D. Schleicher, “Expression of glutamine: fructose-6-phosphate amidotransferase in human tissues: evidence for high variability and distinct regulation in diabetes,” Diabetes, vol.47, pp. 170–178, 1998.
[6] D.J. Candilish, Minerals, J. Am. Coll. Nutr, vol. 17, pp. 286–310, 2000.
[7] J.B. Vincent, “Quest for the molecular mechanisms of chromium action and its relationship to diabetes,” Nutr. Rev. Vol.58, pp. 67–72, 2000.
[8] K. Waltr Monika, B. Zimmermann Michael, A. SpinasGiatgen and F. Hurrell Richard, “Low plasma magnesium in type 2 diabetes,” Swiss Med Wkly, vol. 133, pp. 289–92, 2003.
[9] J.D. Kruse-Jarres and M. Rukguaer, “Trace Elements in Diabetes Mellitus.Peculiarities and Clinical Validy of determinations of red blood cells,” J Trace Elem. Med. Biol. Vol.14, pp. 21–27, 2000.
[10] K.R. Kirtikar and B.D. Basu, “Indian Medicinal Plants,” Oriental Enterprises, Dehradun, vol. 1, 2, pp. 559–60, 778–80, 2003. [11] S.N. Yoga Narasimhan, “Medicinal Plants of India,” Interline Publishing Pvt. Ltd, Bangalore, p 1, 1996.
[12] B.S. Reddy, B.P. Reddy, S.V. Raghavulu, S. Ramakrishna, Y. Venkateswarlu and P.V. Diwan, “Evaluation of antioxidant and antimicrobial properties of Soymidafebrifugaleaf extracts,” Phytother Res, vol.22, pp.943–7, 2008.
[13] VaricolaKarunasree, CiddiVeeresham,Krothapalli RS SambasivaRao and KaleabAsres, “Evaluation of the anti diabetic activity of column fractions obtained from the bark extract of Soymidafebrifuga,” A Juss, Phcog J, Vol. 4(31), pp. 37-43, 2012.
[14] J.L. Campbell, N.I. Boyd, N. Grassi, P. Bonnick, and J.A. Maxwell, “The Guelph PIXE software package IV,” Nuclear Instruments and Methods in Physics Research Section B, vol. 268, no. 20, pp. 3356-3363, Oct. 2010.
[15] G. J. Naga Raju, P. Sarita, M. Ravi Kumar, G. A. V. RamanaMurty, B. Seetharami Reddy, S. Lakshminarayana, V. Vijayan, P. V. B. Rama Lakshmi, G. Satyanarayana and S. Bhuloka Reddy, “Trace elemental correlation study in malignant and normal breast tissue by PIXE technique,” Nuclear Instruments and Methods in Physics Research Section B, vol. 2, no. 247, pp. 361-367, Jun. 2006.
[16] G. J. Naga Raju, P. Sarita, G. A. V. RamanaMurty, M. Ravi Kumar, B. Seetharami Reddy, S. Lakshminarayana, K. Prema Chand, A. Durga Prasad, S. Bhuloka Reddy, V. Vijayan, P. V. B. Rama Lakshmi, and G. Satyanarayana, “Trace elemental analysis of normal, benign hypertrophic and cancerous tissues of the prostate gland using the particle-induced X-ray emission technique,” European journal of cancer prevention, vol. 16, no. 2, pp. 108-115, May 2007. [17] G. J. Naga Raju, P. Sarita, G. A. V. RamanaMurty, M. Ravi Kumar, B. Seetharami Reddy, M. John Charles, S. Lakshminarayana, T. Seshi Reddy, S. Bhuloka
Reddy and V. Vijayan, Appl. Radiat. Isot, vol.64, p.893, 2006.
[18] J. Chandra Sekhar, B.G Naidu, P.Sarita, and G.J. Naga Raju, “PIXE and ICP-MS analysis of AndrographisPaniculata Medicinal Plant,” IOP Conf. Series: Materials Science and Engineering 225 (2017) 012235.
[19] R. A. Kowluru and A. Kennedy, Expert. Opin. Invest. Drugs, vol.10, pp.1665–76, 2000. [20] Andrews Chris, Zinc, Diabetes Mellitus and Oxidative Disease, A Nutritional, 2005, vol.22.
[21] C. Orvig, K. H. Thompson, M. Battell, and J. H. McNeill, “Vanadium compounds as insulin mimics,” Metal Ions in Biological Systems, vol. 31, no. 1, pp. 575–594, 1995.
[22] M. S. Refat and S. A. El-Shazly, “Identification of a new anti-diabetic agent by combining voso1 and vitamin e in a single molecule: studies on its spectral, thermal and pharmacological properties,” European Journal of Medicinal Chemistry, vol. 45, no. 7, pp. 3070–3079, 2010.
[23] M. Korc, “Manganese action on pancreatic protein synthesis in normal and diabetic rats,” The American Journal of Physiology, vol. 245, no. 5, part 1, pp. G628–G634, 1983.
[24] T. G. Kazi, H. I. Afridi, N. Kazi et al, “Copper, chromium, manganese, iron, nickel, and zinc levels in biological samples of diabetes mellitus patients,” Biological Trace Element Research, vol. 122, no. 1, pp. 1–18, 2008. ·
[25] C. Ekmekcioglu, C. Prohaska, K. Pomazal, I. Steffan, G. Schernthaner, and W. Marktl, “Concentrations of seven trace elements in different hematological matrices in patients with type 2 diabetes as compared to healthy controls,” Biological Trace Element Research, vol. 79, no. 3, pp. 205–219, 2001.
[26] C. Hershko, T. E. A. Peto, and D. J. Weatherall, “Iron and infection,” British Medical Journal, vol. 296, no. 6623, pp. 660–664, 1988.
[27] D. L. Yee, C. M. Bollard, and S. M. Geaghan, “Appendix: normal blood values: selected reference values for neonatal, pediatric, and adult populations,” in Hematology: Basic Principles and Practice, R. Hoffman, E. J. Benz, S. S. Shattil, et al., Eds., Elsevier Churchill Livingstone, Philadelphia, Pa, USA, 5th edition, 2008.
[28] R. F. Burk, “Selenium, an antioxidant nutrient,” Nutrition in Clinical Care, vol. 5, no. 2, pp. 75–79, 2002.
[29] R. A. Sunde, “Selenium,” in Modern Nutrition in Health and Disease, A. C. Ross, B. Caballero, and R. J. Cousins, Eds., p. 225, Lippincott Williams & Wilkins, Philadelphia, Pa, USA, 11th edition, 2012.
[30] F. Husain, M. ArifMaan, M. A. Sheikh, et al., “Trace elements status in type 2 diabetes,” Bangladesh Journal of Medical Science, vol. 8, no. 3, pp. 52–56, 2009.