R E S E A R C H
Open Access
Comprehensive evaluation of structural
variation detection algorithms for whole
genome sequencing
Shunichi Kosugi
1,2, Yukihide Momozawa
3, Xiaoxi Liu
3, Chikashi Terao
1,2, Michiaki Kubo
4and Yoichiro Kamatani
1,2*Abstract
Background:Structural variations (SVs) or copy number variations (CNVs) greatly impact the functions of the genes encoded in the genome and are responsible for diverse human diseases. Although a number of existing SV detection algorithms can detect many types of SVs using whole genome sequencing (WGS) data, no single algorithm can call every type of SVs with high precision and high recall.
Results:We comprehensively evaluate the performance of 69 existing SV detection algorithms using multiple simulated and real WGS datasets. The results highlight a subset of algorithms that accurately call SVs depending on specific types and size ranges of the SVs and that accurately determine breakpoints, sizes, and genotypes of the SVs. We enumerate potential good algorithms for each SV category, among which GRIDSS, Lumpy, SVseq2, SoftSV, Manta, and Wham are better algorithms in deletion or duplication categories. To improve the accuracy of SV calling, we systematically evaluate the accuracy of overlapping calls between possible combinations of algorithms for every type and size range of SVs. The results demonstrate that both the precision and recall for overlapping calls vary depending on the combinations of specific algorithms rather than the combinations of methods used in the algorithms.
Conclusion:These results suggest that careful selection of the algorithms for each type and size range of SVs is required for accurate calling of SVs. The selection of specific pairs of algorithms for overlapping calls promises to effectively improve the SV detection accuracy.
Keywords:Structural variation, SV, Copy number variation, CNV, Next generation sequencing, WGS
Background
Genomic structural variations (SVs) are generally defined as deletions (DELs), insertions (INSs), duplications (DUPs), inversions (INVs), and translocations (TRAs) of at least 50 bp in size. SVs are often considered separately from small variants, including single nucleotide variants (SNVs) and short insertions, and deletions (indels), as
these are often formed by distinct mechanisms [1]. INVs
and TRAs are balanced forms, with no net change in a genome, and the remaining SVs are imbalanced forms. Imbalanced deletions (DELs) and duplications (DUPs)
are also referred to as copy number variations (CNVs), with DUPs comprising tandem and interspersed types depending on the distance between the duplicated copies
[2,3]. INSs are categorized into several classes based on
the insertion sequences: mobile element insertions (MEIs), nuclear insertions of mitochondrial genome (NUMTs), viral element insertions (VEIs; referred to in this study), and insertions of unspecified sequence.
SVs are largely responsible for the diversity and evolu-tion of human genomes at both individual and
popula-tion level [3–6]. The genomic difference between
individuals caused by SVs has been estimated to be 3–10
times higher than that by SNVs [2, 6, 7]. Consequently,
SVs could have higher impacts on gene functions and phenotypic changes than do SNVs and short indels. Ac-cordingly, SVs are associated with a number of human diseases, including neurodevelopmental disorders and
cancers [3,8–11].
© The Author(s). 2019Open AccessThis article is distributed under the terms of the Creative Commons Attribution 4.0
International License (http://creativecommons.org/licenses/by/4.0/), which permits unrestricted use, distribution, and
reproduction in any medium, provided you give appropriate credit to the original author(s) and the source, provide a link to the Creative Commons license, and indicate if changes were made. The Creative Commons Public Domain Dedication waiver (http://creativecommons.org/publicdomain/zero/1.0/) applies to the data made available in this article, unless otherwise stated.
* Correspondence:[email protected]
1Laboratory for Statistical Analysis, RIKEN Center for Integrative Medical
Sciences, 1-7-22 Suehiro-cho, Tsurumi-ku, Yokohama 230-0045, Japan 2Laboratory for Statistical and Translational Genetics, RIKEN Center for
Integrative Medical Sciences, 1-7-22 Suehiro-cho, Tsurumi-ku, Yokohama 230-0045, Japan
Two types of methods have been used to detect SVs: (1) array-based detection, including microarray com-parative genome hybridization (array CGH), and (2)
sequencing-based computational methods [2,12].
Array-based methods are advantageous for high-throughput analysis, but they only detect certain types of SVs, have a lower sensitivity for small SVs, and have a lower reso-lution for determining breakpoints (BPs) than the sequencing-based methods. Although sequencing re-quires more time and money than the array-based method, it would be necessary for detecting a broad range of SVs to adopt the sequencing-based methods, as in recent projects aimed at identifying SVs on a
popula-tion scale [6,13–15].
Sequencing-based methods take several conceptual ap-proaches to derive information about SVs from short
read sequencing data [2, 9, 16–18]. Read pairs (RP) and
read depth (RD) approaches utilize the discordant align-ment features and depth features of paired-end reads that encompass or overlap an SV, respectively. The split read (SR) approach uses split (soft-clipped) alignment features of single-end or paired-end reads that span a BP of a SV. The assembly (AS) approach detects SVs by aligning the contigs, assembled with the entire or un-mapped sequencing reads, to the reference sequence. A number of recently developed SV detection algorithms use a combination (CB) of the above four methods (here, we refer to these five basic SV detection methods as
“methods”and each specific SV detection tool as an “
al-gorithm”). Irrespective of the strategy, sequencing-based
methods suffer from a high rate of miscalling of SVs be-cause they involve errors in base call, alignment, or de novo assembly, especially in repetitive regions unable to be spanned with short reads. To overcome the short-comings of short read sequencing, long reads generated using single-molecule sequencing technology have re-cently been used to detect SVs in a human sample using
the AS and/or SR approach [19–22]. However, the high
cost and the low throughput of this strategy currently limits its general use.
Although the sequencing-based methods can in theory detect any type of SV, no single computational algorithm can accurately and sensitively detect all types and all
sizes of SVs [23]. Therefore, most projects use multiple
algorithms to call SVs, then merge the outputs to
in-crease the precision and/or the recall [6,13–15,17,24–
29]. Many projects use popular SV detection algorithms,
including BreakDancer [30], CNVnator [31], DELLY
[32], GenomeSTRiP [33], Pindel [34], and Lumpy [35],
which give calls with relatively high accuracy. Although one study has investigated for the performances of 13
SV detection algorithms [36], there has been no
system-atic investigation of which algorithms can accurately de-tect which types of SVs. Importantly, while it is common
practice to do so, there has been no systematic investiga-tion into optimal strategies to combine the results of multiple algorithms to come to the most complete characterization of SVs in a genome. In this study, we evaluated 69 algorithms for their precision and recall for both single and overlapping SV callings, using multiple simulated and real datasets of WGS datasets.
Results
Evaluation of SV detection algorithms using simulated and real WGS data
We accessed 79 publicly available SV detection algo-rithms that can handle the human WGS data but do not require multiple samples such as matched datasets (e.g., control and tumor samples). We excluded 10 algorithms that did not work in our computational environment. Completed results were obtained with 69 algorithms using simulated and real human WGS data
(Add-itional file1: Tables S1 and S2, please see Additional file
1: Table S1 for the reference for each algorithm
de-scribed below and Additional file1: Table S2 for the list
of unworked algorithms) to calculate the precision and recall. A simulated short read dataset was generated
using the VarSim simulator [37]: first, a simulated
GRCh37 human diploid genome into which known SVs had been introduced at the known sites was generated, then this was used to generate simulated paired-end short reads (125 bp) with 500 bp insert size averaging 30× coverage of the simulated genome (Sim-A). The number of simulated SVs of each type was slightly larger than the mean numbers detected for an individual
hu-man genome in the 1000 Genome project [6] (e.g.,
1.3-fold higher for DELs, Additional file 1: Table S4-A and
S4-C). Four sets of the NA12878 Illumina short read data (data1, data2, data3, and data4) and three sets of PacBio long read data (PacBio-data1, PacBio-data2, and PacBio-data3) were used as real datasets and were ac-quired from different sources with different read lengths
and/or insert sizes (Additional file 1: Table S3). A
refer-ence SV dataset for the real data was generated by mer-ging the DGV dataset corresponding to NA12878 and the INS, DEL, and INV data detected from NA12878
long read assemblies (Additional file1: Table S4; see the
“Methods”section for details).
These datasets, including the simulated data and four or three NA12878 datasets, were aligned with the
GRCh37d5 reference genome using bwa [38] or other
specific alignment tools (see the“Methods”section). The
three categories, respectively, depending on their sizes
(DEL-SS: 50–100 bp; DEL-S and DUP-S, 100 bp to 1 kb;
DEL-M and DUP-M, 1–100 kb; DEL-L and DUP-L, 100
kb to 1 Mb). We defined true called SVs as the called SVs that significantly overlap with the reference SVs by
proportions (≧50% [or ≧80% for the simulated data]
re-ciprocal overlap for DELs, DUPs, and INVs; overlap with a BP ± 200 bp for INSs). The outline of the entire evaluation
processes is presented in Figure S1 in Additional file1.
We observed changes in precision and recall by using different filtering thresholds; the minimum number of
reads supporting the called SVs, termed “RSS” (Reads
Supporting SV) in this study (see Additional file 1:
Fig-ure S2 for representative examples). Thus, to compare the performance of each algorithm as objectively as pos-sible, we selected an RSS for each call set at which the numbers of calls for an SV type approximates the simu-lated reference data or the expected number of SVs in
an individual (see the“Methods”section for detail). Both
precision and recall were calculated for each size range
of DELs (Additional file 1: Figure S3), DUPs (Additional
file 1: Figure S4), INSs, and INVs (Additional file 1:
Fig-ure S5); for the real data, the mean precision and recall from the four short read datasets are presented. The nu-merical data for all the results for the Sim-A and mul-tiple NA12878 real datasets are presented in Tables
S5-S9 in Additional file3. The precision and recall values at
the selected RSSs for the four NA12878 real datasets and the mean and the standard deviation (SD) are
pre-sented in Table S10 in Additional file3.
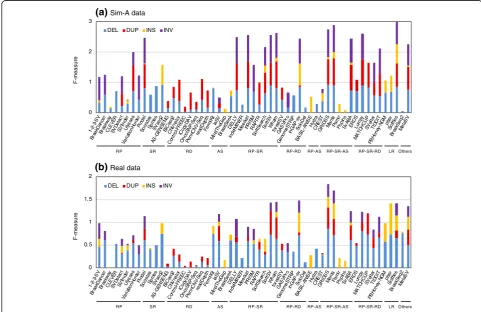
The precision and recall for calling SVs varied greatly depending on the algorithm, the SV type, and the size of
the SV. Figures1and2highlight a number of algorithms
that specifically and/or sensitively detected SVs for each type of SV and for each size range of SV (also see
Add-itional file 1: Figures S3–S5 for precision–recall plots).
Figure 1 shows the combined statistics (F-measure) for
the precision and recall of each algorithm for calling each SV type and highlights a subset of algorithms that can call many SVs with a high level of precision and re-call for both simulated and real datasets, which include
1-2-3-SV [39], DELLY [32], GRIDSS [40], inGAP-sv [41],
F -m eas ur e F -m eas ur e 0 1 2 3 1 -2-3-S V Brea kDan cer Brea kway CLE VER
SV Dete
ct SV find er Ulys ses Var iationH unt er Pin del So cra tes Sp rite s SV seq2 AS -GEN SE NG BIC seq2 CN Vna tor Co ntro
l-FR EEC
iCo pyD AV On coS NP -Se q Penn CN V-Se q read Dep th Ferm iKit laS V Mind Th eGa p Brea kSe ek DE LLY inde lMIN ER Mee rka t PR ISM RA PTR
So ftSe arc h Sof tSV Wha m fore stS V GA SVPr o Ge nome
STRi P inG AP -sv SoloD el BAS IL-A NIS E Hyd ra CR EST GR IDS S Ma nta Pa mir Po pIn s
SvABAERDSLum py MA TC HCL IP SV elte r TID DIT PB Hone
y-NGM pb sv Sn iffle s Brea kSe q2 Me taS V
(a) Sim-A data
DEL DUP INS INV
0 0. 5 1 1. 5 2 1- 2-3-S V Brea kD ance r Brea kway CL EV ER SV De tec t SV find er Ulys ses Var iationH unt er Pin del Socr ate s Spri tes SV seq2 AS -GEN SE NG BIC seq2 CN Vna tor Con trol-FR
EE C iCo pyD AV On coS NP -Se q Pen nC NV -Se q read Dep th Ferm iKitlaSV
Mind TheGa
p Bre akS eek DE LLY inde lMIN ER Me erk at PR ISM RA PT R Sof tSea rch Soft SV Wh am fore stS V GA SV Pro Ge nom eST RiP inG AP -sv So loD el BA SIL-A NIS E Hy dra CR EST GR IDSSMant
a Pam ir Pop Ins Sv ABA ER DS Lum py MA TCHCL IP SVe lter TID DIT PB Hone
y-NGM pb sv Sni ffles Bre akS eq2 Me taS V
(b) Real data
DEL DUP INS INV
RP SR RD AS RP -SR RP-RD RP-AS RP-SR-AS RP-SR-RD LR Others RP SR RD AS RP -SR RP-RD RP-AS RP-SR-AS RP-SR-RD LR Others
[image:3.595.55.537.354.666.2]Lumpy [35], Manta [42], MetaSV [43], Pindel [34],
SoftSV [44], SvABA [45], and Wham [46]. Although
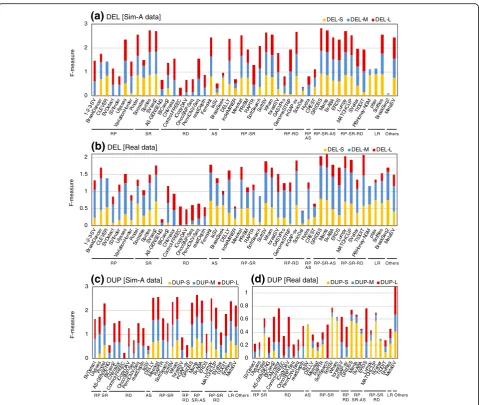
many of the algorithms that call DELs or DUPs covered all the size ranges (S, M, and L) for both the simulated and real datasets, a subset of algorithms exhibited a
lim-ited performance in a specific size range (Fig.2). For
ex-ample, CLEVER [47] less effectively detected large DELs,
and depth-based algorithms (e.g., AS-GENESENG [48],
Control-FREEC [49], CNVnator, OncoSNP-Seq [50],
readDepth [51], and GenomeSTRiP [33]) less effectively
detected small DELs and/or DUPs.
The algorithms benchmarked in this study are based on one of the 10 method classes, including RP, RD, SR, AS, or LR alone, or one of five combined methods (RP-RD,
RP-SR, RP-AS, RP-RD-S, and RP-SR-AS) (Additional file
1: Table S1). For calling DEL and DUP, the SR, LR, and
RP-SR-AS methods achieved relatively good performance both with the simulated and the real data as shown in the
precision–recall plots for the 10 categorized SV detection
methods (Additional file1: Figure S6).
In addition, we determined potential false-positive calls for each algorithm using NA12878 pedigree data, NA12878 for child and NA12891 and NA12892 for
par-ents (Additional file 1: Table S3). The variants present
only in child but not in both parents are attributable to Mendelian inheritance errors or de novo variants. Be-cause the occurrence of de novo SVs is quite low and is
thus negligible [28], the SV calls from only child are
F -m eas ur e F-m e a s u re F-m e a s u re 0 1 2 3 1- 2-3-S V Brea kDan cer CLE VER SV Dete
ct SV find er Ulys ses Var iationH unt er Pin del So cra tes Sp rite s SV seq2 AS -GEN SE NG BIC seq2 CN Vna tor Co ntro
l-FR EEC iCop yDA V On coSN P-S eq Pen nCN V-Se q read Dep th Ferm iKitlaSV
Brea kSeekDEL
LY ind elM INE R Meer kat PR ISM RAPT R So ftSe arc h So ftSV Wh am fore stS V GA SVPr o Ge nom
eSTR iP inGA P-sv Solo Del Hyd ra CRE ST GR IDS S Mant a
SvABAERDSLum py
MA TCH
CLI P SV elter TIDD IT PB Hone y-NG M pbs v Sn iffle s Bre akS eq2 Me taS V
(a)
DEL [Sim-A data] DEL-S DEL-M DEL-L0 0. 5 1 1. 5 2 1- 2-3-S V Bre akD ance r CLE VER SV Dete
ct SV finde r Ulys ses Va riat ion Hu nte r Pind el So cra tes Sp rite s SV seq2 AS -GEN SE NG BIC seq2 CN Vna tor Con trol-F
REEC iCo pyD AV On coS NP -Se q Pen nCN V-Se q read Dep th Ferm iKit laS V Brea kSe ek DE LLY ind elM INER Me erk at PR ISM RAP TR So ftSe arc h So ftSV Wh am fore stS V GA SVPr o Ge nome
STR iP inG AP -sv Solo Del Hyd ra CR EST GR IDS S Ma nta
SvABAERDSLump y
MA TCHCL
IP SV elte r TID DIT PB Ho ney -NG M pbs v
Sniffl es Brea kSe q2 Me taS V
(b)
DEL [Real data] DEL-S DEL-M DEL-L0 1 2 3
SV Dete
ct Ulys ses Pind el AS -GEN SE NG BIC seq2 CN Vna tor Con tro l-FR EEC iCo pyD AV On coSN P-Se q Pen nCN V-Se q read Dep th laS V DE LLY Me erk at RAPT R So ftSe arc h So ftSV Wh am fore stS V inGA P-sv GR IDS S Ma nta SvABAER
DS Lum
py
MA TCHCL
IP SV elte r TID DIT Sn iffle s Me taS V
(c)
DUP [Sim-A data] DUP-S DUP-M DUP-L0 0. 2 0. 4 0. 6 0. 8 1 SV De tec t Ulys ses Pind el AS -GEN SE NG BIC seq2 CNV nator Con trol-F
REEC iCo pyD AV On coSN P-Se q Pen nCN V-Se q read Dep th laS V DE LLY Me erk at RAPT R
SoftS ear
ch SoftS
V Wh am fore stS V inGA P-s v GR IDSSMan
ta
Sv ABA
ERDSLum py
MA TCHCL
IP SV elter TID DIT Sniffl es Me taS V
(d)
DUP [Real data] DUP-S DUP-M DUP-LRP SR RD AS RP -SR RP-RD RP RP-SR-AS RP-SR-RD LR Others AS
RP SR RD AS RP-SR RP RP RP-SR LR Others RD SR-AS RD
RP SR RD AS RP -SR RP RP RP-SR LR Others RD SR-AS RD RP SR RD AS RP -SR RP-RD RP RP-SR-AS RP-SR-RD LR Others
AS
[image:4.595.59.539.85.490.2]derived from Mendelian inheritance errors or false-negative call in parents. We determined Mendelian in-heritance error rate (MIER; the percentage of Mendelian inheritance errors in the total calls) for each algorithm in each SV type. We observed a weak correlation
be-tween“100−MIER”and precision for each algorithm in
each SV type (the Spearman rank correlation
coeffi-cients, 0.31~0.46 for each SV type) (Additional file 1:
Figure S7 and Additional file 3: Tables S6–S10 for
nu-merical data). The weak correlation may be due to false-negative calls in parents and/or the presence of false positives that are called commonly between parents and child.
Evaluation with HG00514 WGS data
We further evaluated SV detection algorithm using an-other WGS real data of a Han Chinese individual
HG00514 (Additional file 1: Table S3), which is one of
the data used in the Human Genome Structural Vari-ation Consortium (HGSV). In HGSV, a HG00514 SV set had been generated using 13 short read-based SV detec-tion algorithms and using an approach with long
read-based assemblies [36]. We used this SV set as a reference
SV set, although it was devoid of INVs (Additional file1:
Table S4; see the “Methods” section for detail). We
showed the performance of each algorithm for each type
of SV and for each size range of SV using F-measure
(Additional file 1: Figures S8 and S9) and using
preci-sion–recall plots (Additional file1: Figures S10 and S11,
and Additional file 3: Table S11 for numerical data), as
demonstrated for the NA12878 datasets in the previous section. Although the tendency of precision and recall between algorithms was similar to that of the NA12878 results, the overall precision values especially for DELs were lower than those of NA12878 (mean precision in HG00514: 53.6 for DEL, 22.5 for DUP, 42.9 for INS; mean precision in NA12878: 62.0 for DEL, 27.9 for DUP, 47.7 for INS).
We examined the correlation in the SV calling accur-acies between the six datasets (the four NA12878 real datasets, one HG00514 real dataset, and one simulation dataset), by comparing the accuracy ranks of algorithms between SV types and/or datasets with the Spearman
rank correlation coefficients (Additional file 1: Figure
S12). The rank correlation coefficients for these algo-rithms were high (> 0.7 for almost all cases) for all types of SV between the five real datasets, suggesting that the determined SV calling accuracies for the tested algo-rithms were robust at least among the NA12878 and HG00514 datasets. The accuracy ranks between the sim-ulated and NA12878 real datasets correlated reasonably well for DELs (0.72) and INSs (0.61) but weakly corre-lated for INVs (0.57) and DUPs (0.48). This result sug-gests that the simulated data fails to accurately model
the mechanisms of SV formation, especially the proper-ties of the real DUPs and INVs, which often involve complex SVs in which other types of SVs are integrated
[24]. Alternatively, DUPs and INVs for NA12878 may be
insufficiently represented in the reference databases. Ex-ceptionally, the accuracy ranks for DUPs between the simulated and HG00514 real datasets (0.72) were con-siderably higher than those between the simulated and NA12878 real datasets (0.49). This high correlation is probably because HG00514 DUPs reported in HGSV have been detected mainly with short read-based SV
de-tection algorithms [36], in contrast with NA12878 DUPs
that are derived mainly from array-based detection. On the other hand, the high correlation between all the datasets observed for DELs was probably because the NA12878 reference DELs were covered with the datasets derived from both array-based and assembly-based SV detection.
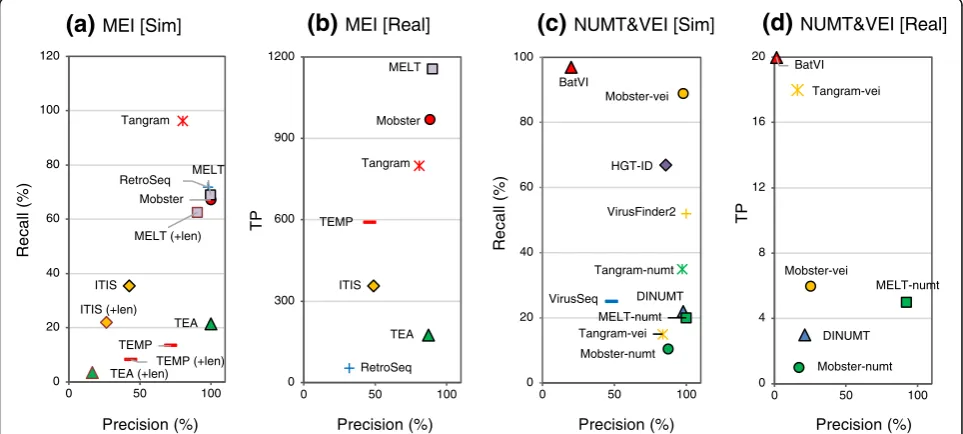
Evaluation of algorithms that call MEIs, NUMTs, and VEIs Based on the identity of the inserted sequence, some INSs can be classified into special classes including MEIs, NUMTs, and VEIs. Thus, we next evaluated the subset of computational algorithms that detect specific classes of INSs. We used three different simulated data-sets (Sim-MEI, Sim-NUMT, and Sim-VEI, generated
using only the chr17 sequence; see the “Methods”
sec-tion) and the four NA12878 real datasets to evaluate the performances of 12 algorithms and an additional five
de-rivatives of three algorithms (Fig. 3, and see Additional
file 3: Tables S5–S10 for the numerical data). For the
real data, the numbers of true positives (TPs) was deter-mined in place of recall, because MEI, NUMT, and VEI have not been defined for the NA12878 INS reference.
We added NUMT-compatible versions of Mobster [52],
MELT [53], and Tangram [54] (Mobster-numt,
MELT-numt, and Tangram-numt) and VEI-compatible versions of Mobster and Tangram (Mobster-vei, Tangram-vei) to NUMT- and VEI-detection algorithms, respectively (see
Additional file4: Supplementary methods for detail).
For MEI calling, MELT and Mobster achieved higher performances with both the simulated and real data than the other algorithms (> 88% in precision and > 50% in
recall [> 900 TPs], Fig. 3a and b). Although MELT had
the highest recall for MEI calling, RetroSeq, Tangram, and Mobster exhibited higher recall metrics in calling
simulated LINE1 than MELT (Additional file 3: Table
S5). For NUMT, MELT-numt exhibited the highest pre-cision (> 92%) both with the simulated and the real data but exhibited only 20% recall with the simulated data
(Fig. 3c and d). A more increased recall for NUMT
calls. For VEI, Mobster-vei had the highest precision
(100%) and recall (~ 90%) in the simulated data (Fig.3c).
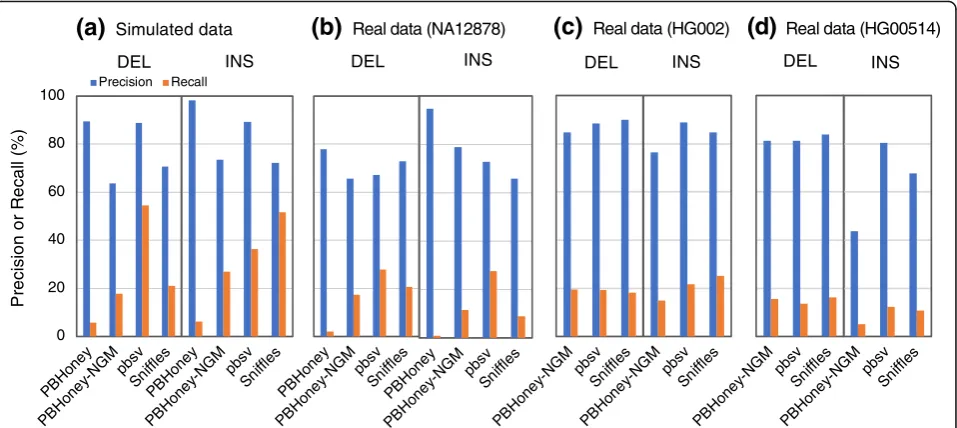
Evaluation of algorithms with long read data
We evaluated the performances of three SV detection
al-gorithms with long read data, including PBHoney [22],
Sniffles [55], and pbsv [56]. We also added a modified
PBHoney algorithm (PBHoney-NGM), which used
NGM-LR as alignment tool (see the“Methods”section).
To generate a simulated dataset of long reads, PacBio
long reads (average 7.5–20 kb) aimed at 10× coverage
were simulated with Sim-A using the PBSIM simulator
[57] (Fig.4, Additional file1: Table S3). For real data, we
used long read datasets from three individuals: NA12878
(PacBio-data1 to PacBio-data3), HG002
(PacBio-HG002), and HG00524 (PacBio-HG00524) to determine
precision and recall (Additional file 1: Table S3). pbsv
achieved the highest precision and recall in DEL calling
with the simulated data (Fig. 4, Additional file 3: Tables
S5-S10 for the numerical data). Overall, however, the three algorithms exhibited similar accuracy in the real data, especially in the HG002 data. Although the input datasets used for evaluation of short read-based and long read-based algorithms were different, we compared the evaluation results of these three detection algorithms
with those of short read-based ones (Figs. 1 and 2,
Additional file 1: Figures S3–S5 and S8–S11). The long
read-based algorithms exhibited good performances in calling short DELs (DEL-SS and DEL-S) and INSs des-pite the lower coverage of the long read data (10×) than that of the short read data (30×).
Effect of different properties of read data on detection accuracy
We examined how read and library characteristics affect the precision and recall of SV calling among algorithms with relatively high precision and/or recall for each type and each size range. We generated datasets with differ-ent read lengths (100 bp, 125 bp, and 150 bp), read coverage (10×, 20×, 30×, and 60×), and library insert size (400 bp, 500 bp, and 600 bp) and evaluated the SV calling accuracies of the algorithms with these datasets
(Add-itional file2: Figure S13).
Changes in read coverage prominently affected recall
and precision (see Additional file 1: Tables S12 and S13
for the summarized and statistical results). Data with higher coverage exhibited higher recall due to an in-creased number of signals including discordant reads and split reads. Interestingly, for many algorithms data with higher coverage resulted in lower precision than data with lower coverage when compared at the same threshold of RSS (as representative examples, see
Precision (%) Precision (%) Precision (%)
Re
ca
ll (
%
) RetroSeq Tangram
TEA Mobster
MELT
ITIS
TEMP
TEA (+len) MELT (+len)
ITIS (+len)
TEMP (+len) 0
20 40 60 80 100 120
0 50 100
(a)
MEI [Sim]DINUMT
Mobster-numt Tangram-numt
MELT-numt BatVI
HGT-ID
VirusFinder2
VirusSeq
Mobster-vei
Tangram-vei
0 20 40 60 80 100
0 50 100
(c)
NUMT&VEI [Sim]RetroSeq TEA Mobster
MELT
TEMP
ITIS Tangram
0 300 600 900 1200
0 50 100
(b)
MEI [Real]Precision (%)
Re
ca
ll (
%
)
TP TP
DINUMT
MELT-numt
Mobster-numt Mobster-vei
Tangram-vei BatVI
0 4 8 12 16 20
0 50 100
(d)
NUMT&VEI [Real] [image:6.595.57.539.90.307.2]Additional file 2: Figure S13-A, S13-N, S13-X, S13-Z, S13-AJ, S13-AN, S13-AS, and S13-AU). In many cases, the precision using high-coverage data was comparable to that with lower coverage when the threshold values of
RSS were increased (Additional file 2: Figure S13-M,
S13-T, S13-X, S13-Y, S13-AB, S13-AD, S13-AH, S13-AL, S13-AN, S13-AP, S13-AR, and S13-AU). These results suggest that increasing the read coverage results in an increased number of spuriously aligned reads that lead to miscalling of SVs. In contrast to read coverage, nei-ther read length nor insert size greatly affected recall and precision. We noted overall moderate effects on re-call and precision for INS re-calling, while larger insert sizes led to greater than 10% decreased recall for DEL calling for several algorithms including BreakDancer
[30], DELLY, inGAP-sv, Meerkat [58], and RAPTR-SV
[59] (Additional file1: Tables S12 and S13).
Accuracy for calling breakpoints, sizes, and genotypes of SVs
We evaluated the accuracy with which each algorithm called breakpoints (BPs) and SV length (both calculated in root mean squared errors, RMSEs) using the Sim-A
data (Additional file3: Table S14; also see the“Methods”
section for RMSEs). BreakSeek [60], BreakSeq2 [61],
CREST [62], DELLY, GRIDSS, PBHoney-NGM, pbsv,
SvABA, SVseq2 [63], and Wham achieved the highest
accuracy (< 60-bp RMSE) for calling BPs for all size ranges of the DELs and/or DUPs. CREST, Manta,
Fermi-Kit [64], Pamir [65], pbsv, SVseq2, SoftSearch [66],
Wham, and the specific INS detection algorithms (MEI
and NUMT algorithms) exhibited the highest accuracy (< 10-bp RMSE) for calling INS BPs. Most algorithms that called BPs accurately used the split reads-based or assembly-based methods whereas algorithms only using the read depth-based alone approach exhibited poor BP resolution. BreakSeek, BreakSeq2, CLEVER, CREST,
DELLY, FermiKit, GASVPro [67], GRIDSS, inGAP-sv,
laSV [68], Lumpy, Manta, PBHoney-NGM, pbsv, PRISM
[69], SvABA, SVseq2, and Wham provided higher
accur-acy (< 100-bp RMSV) for lengths of called DELs and/or DUPs, and most of these algorithms used the read pair-based or assembly-pair-based method. These results suggest that the basic method used in SV detection algorithms affects the resolution of the called BPs and sizes.
Twenty-two algorithms used in this study call the ge-notypes or copy number associated with the detected SVs. We determined the precision and recall of the SV genotypes called with these algorithms using the Sim-A
and NA12878 real datasets (Additional file1: Figure S14
and Table S15). In the real datasets, only 335 DELs and 120 DUPs with specified genotype information were available. For the real DEL data, most algorithms exhib-ited > 95% precision. In contrast, most of the called DUPs did not match the 120 reference DUPs, limiting
interpretation (Additional file1: Table S15). For the
sim-ulated DEL data, Manta, Lumpy, Pindel, and ERDS [70]
exhibited top performance in terms of both precision (> 90%) and recall (> 1900 TPs). PennCNV-Seq, CNVnator,
BICseq2 [71], and readDepth exhibited high precision
(> 89%) and recall (> 800 TPs) for the DUP data. For the INS data, Manta achieved the best performance, with >
0 20 40 60 80 100
PBHone
y
PBHone
y-NG
M pbs
v
Sni
ffles
DEL
Precision Recall
PBHone
y
PBHone
y-NG
M pbs
v
Sni
ffles
INS
PBH
oney
PBHone
y-NG
M pbs
v
Sni
ffles
DEL
PBHone
y
PBHone
y-NG
M pbs
v
Sni
ffles
INS
(a)
Simulated data(b)
Real data (NA12878)(c)
Real data (HG002)P
re
c
isio
n
o
r Re
ca
ll (%
)
PBHone
y-NG
M pbs
v
Sni
ffles
INS
PBHone
y-NG
M pbs
v
Sni
ffles
DEL
PBHone
y-NG
M pbs
v
Sni
ffles
DEL
PBHone
y-NG
M pbs
v
Sni
ffles
INS
(d)
Real data (HG00514) [image:7.595.60.539.88.302.2]97% precision. We note that algorithms with high per-formance genotype calling are also algorithms with good SV detection precision and recall.
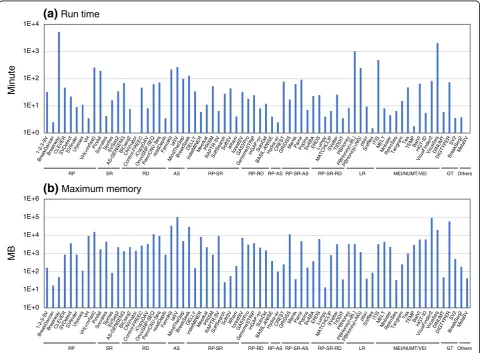
Run time and memory consumption
Figure 5 shows run time and maximum memory per
CPU for each SV detection algorithm, which were deter-mined with 30× short read data (10× for long reads) of the NA12878 data1 that were aligned to the NA12878 chromosome 8 (146 Mb). SV detection algorithms dir-ectly using fastq read files (FermiKit, laSV, MinThe-Gap, Pamir, ITIS, and VirusSeq), many of which use the assembly method, exhibited long run time and large memory consumption. Algorithms requiring
spe-cific alignment tools, including VariationHunter [72]
and long read-based algorithms, took longer run time than the standard algorithms using BWA. Pindel, known as a popular algorithm, also took longer run
time although it exhibited good SV calling accuracy. Many of algorithms using the read depth method or detecting viral element insertions consumed larger memory than the others.
Systematic identification of pairs of algorithms showing high accuracy in their overlapping, called SVs
The above results revealed that the precision and recall with which a given algorithm calls SVs varies widely and depends on the types and size ranges of the SVs. How-ever, few algorithms could call SVs with high precision, especially for DUP, INS, and INV of the real data, al-though the real dataset is likely to be incomplete (i.e., there are unidentified true SVs not present in our refer-ence SV set). Several studies have taken the strategy of selecting SVs that are commonly called by multiple
algo-rithms to increase the precision of the called SVs [13,
14, 24–29]. However, there has been no systematic
1E+0 1E+1 1E+2 1E+3 1E+4 1- 2-3-S V Bre akD an cer Bre akw ay CL EV ER SVD ete ct SVf inde r Ulys sesVH
VH (+m
rfast ) Pind el So crat es Spr ites SVSe q2 AS-GE NS EN G BIC seq2 CN Vn ato r Con tro l-FR EEC iCop yD AV On coSN P-S EQ Pen nC NV-S eq read Dep th Ferm iKit laS V Mind Th eGa p Bre akS eek DE LLY ind elM INE R Me erk at PR ISM RAPT R-S V So ftSe arch Soft SV Wh am fores tSV GASVPro Ge nom eS TR iP inG AP-s v So loD el BASI L-A NIS E Hyd ra-sv CR EST GR IDSSMant
a Pami r Pop Ins Sv ABA ER DS Lum py MA TCHCL IP SVe lter TIDDI T PBH one y PBH oney (+B L) PBH one y(+ NG ) pbsv Sniffl esITIS
MEL T Mobs ter Re troS eq Tan gra m Te a TEM P BatV I HG T-ID Viru sFin der2 Viru sSe q DINU MT DIG TY PE R SV2 Bre akS eq2 Me taS V
(a)
Run time1E+0 1E+1 1E+2 1E+3 1E+4 1E+5 1E+6 1- 2-3-S V Bre akD anc er Bre akw ay CL EV ER SVD ete ct SV finde r Ulys sesVH
VH (+m rfa st) Pind el Socr ate s Sp rite s SVSe q2 AS-G EN SEN G BIC seq2 CNV nato r Co ntro l-FR EEC iCop yDA V On coSN P-S EQ Pe nnC
N V-Seq read Dep th Fe rmiK it laS V Min dThe Ga p Brea kSe ek DE LLY inde lMIN ER Mee rkat PR ISM RAPT R-S V Soft Se arc h So ftSV Wh am fores tSV GASVPro Ge nom eST RiP inG AP-s v Solo Del BASI L-AN ISE Hyd ra-s v CR EST GR IDSSMant
a Pa mir Po pIn s
SvABAER DS Lump y MA TCHCL IP SVe lter TID DIT PBH one y PBH oney (+B L) PBH oney (+N G) pbsv Sn iffle s ITIS MEL T Mob ster Re tro Seq Tan gram Te
a TEM P Ba tVI HG T-ID Viru sFin der 2 Viru sSe q DINUM T DIG TYPE R SV2 Bre akSe q2 Me taS V
(b)
Maximum memoryM
inut
e
MB
RP SR RD AS RP-SR RP-RD RP-AS RP-SR-AS RP-SR-RD LR MEI/NUMT/VEI GT Others
RP SR RD AS RP-SR RP-RD RP-AS RP-SR-AS RP-SR-RD LR MEI/NUMT/VEI GT Others
Fig. 5a,bRun time and memory consumption for SV detection algorithms. A bam or fastq files of the reads aligned to the NA12878
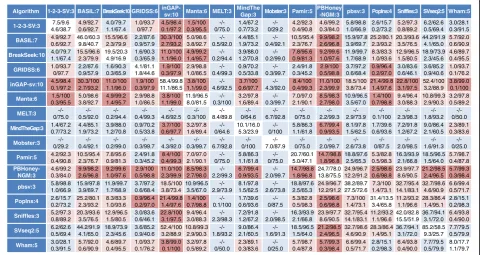
[image:8.595.58.541.312.665.2]investigation into optimal strategies to combine the re-sults of multiple algorithms. We selected a total of 51
al-gorithms (12–38 algorithms for each SV type and size
range) that exhibited relatively high precision and recall [the sum of recall (or precision) of the simulated and the NA12878 real data is > 10 for INS and INV or > 30 for the other types of SVs] for each type and each size range, and determined the precision and recall of the SVs that were commonly called for each combination of pairs of
algorithms (Fig. 6 for INS and Additional file1: Figures
S15–S22 for DEL, DUP, and INV, also see Additional file
3: Table S16). The set of SVs called in common by two
algorithms was more precise than the SVs called with ei-ther algorithm alone, as expected, yet this came at the cost of decreased recall. The degree of increased preci-sion and decreased recall was varied depending on the algorithm combination. Combinations of algorithms that yielded more precise calls for a given type and size range of SV in both the simulated and real data are highlighted
(Fig. 6 and Additional file 1: Figures S15–S22). We
cal-culated the mean precision and recall values of over-lapped calls between pairs of algorithms for each SV
category (Additional file 1: Figure S23, Additional file3:
Table S17). As expected, high precision in the over-lapped calls was often observed in pairs containing an algorithm exhibiting high precision by itself. Interest-ingly, however, several algorithms with a moderate level of precision in an SV category yielded higher precision
in their overlapped calls. Examples of such good “team
players”include CREST and VariationHunter in the DEL
category and BASIL-ANISE [73] and BreakSeek in the
INS category, each of which showed over twofold in-crease in combination with another algorithm.
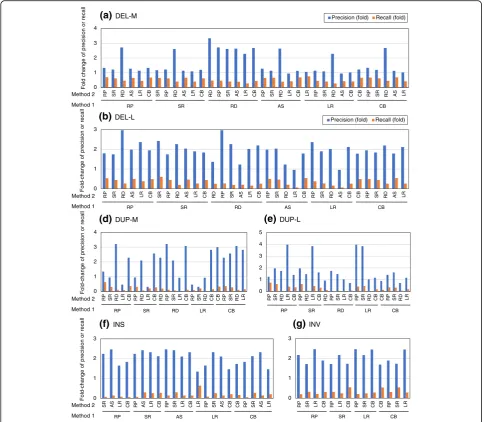
We then examined how precision and recall change when combining algorithms across the six SV detection methods, including RP, SR, RD, AS,
LR, and CB (Fig. 7 and Additional file 3: Table S18)
. The DEL-calling precision increased less than the other types of SV because precision was already high. In general, combinations of algorithms from two different method class led to higher precision but lower recall than two algorithms using the same methods (mean fold change of precision: 1.63× for the same method and 1.82× for different methods;
Algorithm 1-2-3-SV:3 BASIL:7 BreakSeek:10 GRIDSS:6
inGAP-sv:10 Manta:6 MELT:3 MindThe
Gap:3 Mobster:3 Pamir:5 PBHoney
-NGM:3 pbsv:3 PopIns:4 Sniffles:3 SVseq2:5 Wham:5 1-2-3-SV:3 7.5/9.6 4.6/38.7 4.9/92.7 0.6/92.7 4.0/79.7 1.1/67.4 1.0/93.7 0/97.7 4.5/98.4 0.1/97.2 1.5/100 0.3/95.5 -/-0/75.0 1.4/67.2 0.7/73.2 -/-0/29.2 4.2/92.3 0.4/90.8 4.6/99.2 0.3/84.0 5.8/98.8 1.0/66.9 2.6/15.7 0.2/73.2 5.2/97.3 0.8/89.2 6.2/62.6 0.5/69.4 3.0/28.1 0.3/91.5 BASIL:7 4.9/92.7 0.6/92.7 46.0/60.3 9.8/40.7 15.5/96.6 2.3/79.9 2.2/87.6 0.9/57.9 30.3/100 2.7/93.2 5.0/98.6 3.8/92.7 -/-0.5/92.0 4.4/85.1 1.9/73.2 -/-0.4/92.1 10.5/95.4 2.3/76.7 9.9/98.2 2.6/96.8 15.9/97.8 3.9/69.7 25.2/80.1 2.3/93.2 20.3/93.6 3.5/76.5 44.2/91.9 4.1/65.0 5.7/92.0 0.6/90.9 BreakSeek:10 4.0/79.7 1.1/67.4 15.5/96.6 2.3/79.9 19.5/20.3 4.9/16.9 1.6/90.3 0.3/65.9 11.0/100 1.1/96.0 4.9/99.2 1.4/95.7 -/-0.2/94.4 3.9/88.0 1.2/70.8 -/-0.2/99.0 7.8/95.6 0.9/81.3 9.2/99.6 1.0/97.6 11.9/99.7 1.7/68.9 8.3/83.3 1.0/93.6 12.9/96.5 1.5/80.5 18.9/73.9 2.3/45.6 4.6/89.7 0.4/95.5 GRIDSS:6 1.0/93.7 0/97.7 2.2/87.6 0.9/57.9 1.6/90.3 0.3/65.9 4.1/81.1 1.8/44.6 1.9/100 0.3/97.9 2.9/98.8 1.0/86.5 -/-0.4/99.3 0.9/70.2 0.5/33.8 -/-0.3/99.7 2.4/91.8 0.3/45.2 2.9/100 0.5/98.8 3.7/97.2 0.6/68.4 0.9/96.4 0.2/97.0 3.0/83.6 0.6/46.1 3.6/85.2 0.9/40.6 1.0/93.7 0.1/76.2 inGAP-sv:10 4.5/98.4 0.1/97.2 30.3/100 2.7/93.2 11.0/100 1.1/96.0 1.9/100 0.3/97.9 58.4/99.8 11.1/86.5 3.8/100 1.1/99.0 -/-4.6/92.5 3.7/100 0.6/97.7 -/-4.3/92.0 8.4/100 0.4/99.3 11.0/100 2.3/99.9 18.5/100 3.8/73.4 21.4/99.8 1.4/97.6 22.8/100 3.1/97.5 52.4/100 3.2/88.9 3.8/99.0 0.1/100 Manta:6 1.5/100 0.3/95.5 5.0/98.6 3.8/92.7 4.9/99.2 1.4/95.7 2.9/98.8 1.0/86.5 3.8/100 1.1/99.0 11.9/96.5 8.0/81.5 -/-0.3/100 3.2/97.8 1.6/89.4 -/-0.3/99.7 7.0/97.0 2.1/90.1 8.5/98.3 2.7/98.0 10.9/96.5 3.5/67.0 1.4/100 0.7/98.8 9.4/96.4 3.0/88.3 10.8/99.3 2.9/90.3 3.2/97.8 0.5/89.2 MELT:3 -/-0/75.0 -/-0.5/92.0 -/-0.2/94.4 -/-0.4/99.3 -/-4.6/92.5 -/-0.3/100 -/-8.4/89.8 -/-0/64.6 -/-6.7/92.8 -/-0/75.0 -/-2.2/99.3 -/-2.9/73.9 -/-0.1/100 -/-2.3/98.3 -/-1.8/93.2 -/-0/50.0 MindTheGap:3 1.4/67.2 0.7/73.2 4.4/85.1 1.9/73.2 3.9/88.0 1.2/70.8 0.9/70.2 0.5/33.8 3.7/100 0.6/97.7 3.2/97.8 1.6/89.4 -/-0/64.6 10.1/16.0 5.3/23.9 -/-0/100 5.8/86.3 1.1/61.8 6.7/99.4 0.9/93.5 8.1/97.8 1.5/62.5 1.7/39.6 0.6/93.6 7.2/91.8 1.2/67.2 9.0/86.4 2.1/60.5 2.3/89.1 0.3/83.6 Mobster:3 -/-0/29.2 -/-0.4/92.1 -/-0.2/99.0 -/-0.3/99.7 -/-4.3/92.0 -/-0.3/99.7 -/-6.7/92.8 -/-0/100 -/-7.0/87.9 -/-0/75.0 -/-2.0/99.7 -/-2.6/73.8 -/-0/87.5 -/-2.0/98.5 -/-1.6/91.3 -/-0/25.0 Pamir:5 4.2/92.3 0.4/90.8 10.5/95.4 2.3/76.7 7.8/95.6 0.9/81.3 2.4/91.8 0.3/45.2 8.4/100 0.4/99.3 7.0/97.0 2.1/90.1 -/-0/75.0 5.8/86.3 1.1/61.8 -/-0/75.0 20.7/60.1 5.0/47.1 14.7/98.8 1.8/96.8 18.8/97.6 2.5/65.3 5.3/82.8 0.5/98.3 16.3/93.9 2.1/66.8 18.5/96.5 1.5/64.0 5.7/98.7 0.4/87.8 PBHoney-NGM:3 4.6/99.2 0.3/84.0 9.9/98.2 2.6/96.8 9.2/99.6 1.0/97.6 2.9/100 0.5/98.8 11.0/100 2.3/99.9 8.5/98.3 2.7/98.0 -/-2.2/99.3 6.7/99.4 0.9/93.5 -/-2.0/99.7 14.7/98.8 1.8/96.8 24.7/78.0 13.8/75.5 24.9/96.7 12.2/91.2 2.5/98.6 0.6/98.8 23.9/97.7 8.6/90.5 21.2/98.5 2.4/96.5 5.7/99.3 0.3/98.4 pbsv:3 5.8/98.8 1.0/66.9 15.9/97.8 3.9/69.7 11.9/99.7 1.7/68.9 3.7/97.2 0.6/68.4 18.5/100 3.8/73.4 10.9/96.5 3.5/67.0 -/-2.9/73.9 8.1/97.8 1.5/62.5 -/-2.6/73.8 18.8/97.6 2.5/65.3 24.9/96.7 12.2/91.2 38.2/89.7 27.5/72.6 7.3/100 1.4/73.1 32.7/95.4 14.1/83.1 32.7/98.6 4.6/90.9 6.6/99.4 0.5/71.7 PopIns:4 2.6/15.7 0.2/73.2 25.2/80.1 2.3/93.2 8.3/83.3 1.0/93.6 0.9/96.4 0.2/97.0 21.4/99.8 1.4/97.6 1.4/100 0.7/98.8 -/-0.1/100 1.7/39.6 0.6/93.6 -/-0/87.5 5.3/82.8 0.5/98.3 2.5/98.6 0.6/98.8 7.3/100 1.4/73.1 31.4/13.5 3.4/65.8 11.2/93.2 1.1/96.6 28.3/86.4 1.4/95.1 2.8/15.1 0.2/98.3 Sniffles:3 5.2/97.3 0.8/89.2 20.3/93.6 3.5/76.5 12.9/96.5 1.5/80.5 3.0/83.6 0.6/46.1 22.8/100 3.1/97.5 9.4/96.4 3.0/88.3 -/-2.3/98.3 7.2/91.8 1.2/67.2 -/-2.0/98.5 16.3/93.9 2.1/66.8 23.9/97.7 8.6/90.5 32.7/95.4 14.1/83.1 11.2/93.2 1.1/96.6 42.0/82.8 15.5/51.9 36.7/94.1 3.1/72.0 6.4/93.8 0.4/90.0 SVseq2:5 6.2/62.6 0.5/69.4 44.2/91.9 4.1/65.0 18.9/73.9 2.3/45.6 3.6/85.2 0.9/40.6 52.4/100 3.2/88.9 10.8/99.3 2.9/90.3 -/-1.8/93.2 9.0/86.4 2.1/60.5 -/-1.6/91.3 18.5/96.5 1.5/64.0 21.2/98.5 2.4/96.5 32.7/98.6 4.6/90.9 28.3/86.4 1.4/95.1 36.7/94.1 3.1/72.0 85.2/58.5 9.3/25.7 7.7/79.5 0.5/79.9 Wham:5 3.0/28.1 0.3/91.5 5.7/92.0 0.6/90.9 4.6/89.7 0.4/95.5 1.0/93.7 0.1/76.2 3.8/99.0 0.1/100 3.2/97.8 0.5/89.2 -/-0/50.0 2.3/89.1 0.3/83.6 -/-0/25.0 5.7/98.7 0.4/87.8 5.7/99.3 0.3/98.4 6.6/99.4 0.5/71.7 2.8/15.1 0.2/98.3 6.4/93.8 0.4/90.0 7.7/79.5 0.5/79.9 8.0/17.7 1.1/79.7
Fig. 6Recall and precision of SVs commonly called between a pair of SV detection algorithms for the INS category. INSs, called from the indicated algorithms, were filtered with the minimum number of reads supporting the called SVs, indicated with the suffix number of the algorithm name. The INSs overlapping between the filtered SV sets from a pair of the indicated algorithms were selected, and the recall and precision of the selected INSs were determined. Recall and precision percentages are presented with an intervening slash, and the recall/precision values for the simulated and real data are indicated in the upper and lower lines of each cell, respectively. Results for the real data represent the mean values of the values determined with four different NA12878 datasets (three PacBio datasets for long reads). The recall/precision values for the individual algorithm are indicated with blue letters and a white background. The data contained in the top 20th percentile of the combined precision scores (see the“Methods”section for details) for the simulated and real data are highlighted with a red background, and the next data contained in the top 21st to 50th percentile of the combined precision scores are shown with a pale red background.“–”indicates
[image:9.595.58.539.370.625.2]mean fold change of recall, 0.5× for the same
method and 0.33× for different methods) (Fig. 7).
These results suggest that combining algorithms from two different methods is a better strategy for obtaining an accurate representation of SV than using two algorithms of the same class. However, the results also suggest that the importance of obtaining overlapping SV calls with high precision and high recall to select good pairs of algorithms, irrespective of the combination of methods used in the algorithms.
Discussion
No previous study has comprehensively compared the accuracies of existing SV detection algorithms. While papers describing new SV detection algorithms often in-clude some benchmarking, they have done so using only a limited number of comparator algorithms. One recent study has compared the performances of existing seven
MEI detection algorithms [74], and the results are well
correlated with our evaluation results of MEI detection algorithms. Despite the overall consistency in accuracy rank of algorithms between the datasets (Additional file
0 1 2 3
RP SR LR CB RP LR CB RP SR CB CB RP SR LR (g) INV
0 1 2 3
SR AS LR CB RP AS LR CB RP SR LR CB LR RP SR AS CB CB RP SR AS LR (f) INS
0 1 2 3 4
RP SR RD AS LR CB SR RP RD AS LR CB RD RP SR AS LR CB RP SR RD LR CB LR RP SR RD AS CB CB RP SR RD AS LR
(a) DEL-M Precision (fold) Recall (fold)
0 1 2 3
RP SR RD AS LR CB SR RP RD AS LR CB RD RP SR AS LR CB RP SR RD LR CB RP SR RD AS CB CB RP SR RD AS LR
(b) DEL-L Precision (fold) Recall (fold)
0 1 2 3 4
RP SR RD LR CB RP RD LR CB RD RP SR LR CB RP SR RD CB CB RP SR RD LR (d) DUP-M
0 1 2 3 4 5
RP SR RD LR CB RP RD LR CB RD RP SR LR CB RP SR RD CB CB RP SR RD LR (e) DUP-L
F
ol
d
c
hange of
pr
ec
is
ion or
r
e
c
al
l
F
o
ld
-c
hange
of pr
ec
is
io
n or
r
e
c
a
ll
F
o
ld
-c
hange
of pr
ec
is
io
n or
r
e
c
a
ll
F
o
ld
-c
hange
of pr
ec
is
io
n or
r
e
c
a
ll
Method 1 Method 2
RP SR RD AS LR CB
Method 1 Method 2
Method 1 Method 2
Method 1 Method 2
RP SR RD AS LR CB
RP SR RD LR CB RP SR RD LR CB
RP SR AS LR CB RP SR LR CB
[image:10.595.56.541.88.510.2]1: Figure S12), the recall values for the real data were overall low relative to those for the simulated data. This would be in part due to the presence of overlapping re-dundant SVs in the NA12878 reference SV data, because the DGV data is derived from multiple sources of stud-ies. Alternatively, several falsely detected SVs might be included in the reference set. In addition, lower levels of precision observed in the real data, especially for DUP and INV calls, would in part be due to a number of un-identified DUPs/INVs absent from the NA12878 refer-ence SV dataset. More elaborate refinement, involving experimental validation, of the NA12878 SV reference data should be made in the future. Despite these short-comings, the recall and precision values for the real data can be considered as relative values for ranking the rela-tive performances of the algorithms.
Based on our evaluation results, we list the algo-rithms exhibiting higher precision and recall values for both the simulated and NA12878 real datasets
(Table 1, see also Additional file 1: Table S19 for an
extended list), although this list can be changed de-pending on what level of precision or recall is
re-quired. It shows the top 2–7 (the top 30% for Table
S19) algorithms for each category exhibiting high
values of the sum of the normalized F-measures of
the simulated and real data and exhibiting short run
time (< 200 min in Fig. 5). Overall, GRIDSS, Lumpy,
SVseq2, SoftSV, and Manta show good performances
in calling DELs of diverse sizes. TIDDIT [75],
for-estSV [76], ERDS, and CNVnator call large DELs well
whereas SV detection algorithms using long reads, in-cluding pbsv, Sniffles, and PBHoney, are good at de-tecting small DELs. For DUP detection, good choices include Wham, SoftSV, MATCHCLIP, and GRIDSS.
CNVnator, ERDS, and iCopyDAV [77] achieve good
performances in calling large sizes of DUPs. For INSs, MELT, Mobster, inGAP-sv, and SV detection algo-rithms with long read data would effectively call
reli-able variants. AS-GENESENG, Control-FREEC,
[image:11.595.57.538.349.700.2]OncoSNP-Seq, and GenomeSTRiP may more
Table 1List of tools providing good SV calling results for both the simulated and NA12878 real datasets
SV type Tools Simulated data Real data nF*1
Precision Recall Precision Recall
DEL GRIDSS 98.9 (5) 86.6 (2) 87.6 (7) 28.9 (2) 3.57 (1)
Lumpy 99.1 (4) 81.4 (6) 87.1 (8) 26.1 (4) 3.41 (2)
SVseq2 96.2 (11) 86.1 (3) 75.7 (17) 24.9 (5) 3.28 (3)
SoftSV 96.8 (10) 83.6 (4) 80.2 (13) 23.2 (8) 3.25 (7)
Manta 95.9 (12) 83.1 (5) 74.2 (20) 24.3 (6) 3.21 (5)
MATCHCLIP 99.4 (2) 71.7 (10) 91.6 (4) 20.9 (11) 3.12 (6)
inGAP-sv 91.1 (18) 78.6 (7) 78.3 (14) 22.5 (8) 3.10 (7)
DUP Wham 96.9 (4) 81.7 (4) 57.1 (4) 10.2 (5) 3.92 (1)
SoftSV 84.2 (14) 67.8 (13) 47.3 (6) 14.3 (3) 3.91 (2)
MATCHCLIP 87.6 (11) 77.5 (8) 58.0 (3) 9.9 (6) 3.79 (3)
GRIDSS 91.1 (9) 77.9 (7) 58.4 (2) 9.6 (7) 3.78 (4)
Manta 99.0 (1) 83.2 (1) 40.4 (9) 6.5 (11) 3.35 (5)
SvABA 82.6 (15) 69.6 (11) 42.7 (8) 7.2 (9) 3.02 (6)
INS [Unspecified] pbsv 89.7 (3) 38.2 (5) 72.7 (8) 27.5 (2) 6.68 (1)
inGAP-sv 99.7 (1) 58.5 (2) 85.5 (2) 11.8 (3) 6.27 (2)
Sniffles 74.8 (5) 52.5 (3) 65.9 (10) 9.0 (5) 5.08 (3)
SVseq2 70.4 (8) 64.2 (1) 38.5 (19) 7.1 (9) 4.87 (4)
INS [MEI] MELT 99.7 (3) 68.9 (3) 88.9 (1) 85.6*2(1) 3.21 (1)
Mobster 100 (1) 67.1 (4) 88.3 (2) 71.9*2(2) 3.04 (2)
INV DELLY 94.7 (8) 81.8 (4) 38.9 (4) 15.6 (2) 3.07 (1)
TIDDIT 89.2 (14) 77.9 (8) 49.1 (1) 11.7 (5) 2.89 (2)
1–2-3-SV 70.7 (19) 81.2 (5) 31.8 (9) 14.8 (3) 2.67 (3)
GRIDSS 96.6 (6) 84.7 (3) 34.2 (8) 10.4 (7) 2.67 (4)
*1
Sum of normalizedF-measures of the simulated and the real data. NormalizedF-measure =F-measure/the meanF-measure for the corresponding category *2
Provisional recall value: the number of true positives was calculated by dividing by the provisional number of reference MEIs (1350), which was estimated using the data from the 1000 Genome project
accurately detect SVs in other types of applications, such as somatic SV detection or SV calling with whole exome sequencing data or multiple sample data because these algorithms have been more intensively designed for such applications. We also listed the poor performing algorithms in Table S20 in
Add-itional file 1.
In almost all cases, SVs called in common between multiple algorithms exhibit higher precision and lower recall than those called with a single algorithm, but the degree of the increased precision and the decreased re-call varies based on the specific combination of algo-rithms, including both short read- and long read-based algorithms. Mills et al. examined the accuracy of over-lapping calls between five methods and demonstrated that combining algorithms based on the same method increased precision, but the increase was lower than when combining algorithms based on different methods
[14]. This is consistent with our observations. However,
combining algorithms based on same methods gives a moderate increase in precision and less decrease in re-call. Previous studies have selected SV calls overlapping between at least two sets from multiple SV call sets in
order to increase precision [13, 14, 24–28]. However,
this strategy could take overlapping calls from “bad”
pairs of algorithms whose overlapping calls give only a small increase in precision with a considerable decrease in recall. It is promising, therefore, to iteratively merge the overlapping calls from the selected pairs of algo-rithms, giving high quality of overlapping calls, thereby generating an SV call set with high accuracy and recov-ery. Furthermore, the use of overlapped calls should also improve the accuracies of the BPs, sizes, and genotypes of the SVs because we can select the BPs/sizes/genotypes from algorithms providing higher accuracy for these SV properties, shown in this study.
Conclusion
We evaluated the SV detection accuracy, including the precision of BPs, sizes, and genotypes of called SVs, of 69 existing computational algorithms using simulated and real data in terms of both precision and recall. This is the largest benchmarking study for genomic variant discovery performed to date. Our evaluation tests reveal that most algorithms exhibit their best performance for specific types of SV and, in several cases, for specific size ranges. These findings indicate that specific algorithms suitable for each type of and each size range of SV should be selected to obtain the desired results. Further-more, systematic evaluation for overlapping calls from each combination of algorithm pairs demonstrates that several specific pairs of algorithms give a higher preci-sion and recall for specific SV types and size ranges compared with other pairs.
Methods WGS datasets
The simulated dataset Sim-A was generated with the
VarSim simulator [37] and the GRCh37d5 reference,
which contains 41.8 Mb of extra decoy sequences com-prising of 61 sequences. VarSim introduced a total of 8310 SVs (3526 DELs, 1656 DUPs, 2819 INSs, and 309 INVs) with sizes ranging from 50 bp to 1 Mb, in addition to SNPs and short indels corresponding to 0.1% and 0.02% of the genome size, respectively, into simulated paternal and maternal haploid genomes, containing
ap-proximately 67% heterozygous alleles (Additional file 1:
Table S4). The number of introduced SVs was larger and smaller than the number of SVs detected for an
individ-ual human genome in the 1000 Genome project [6] and
the numbers of SVs identified from the NA12878
assem-bly generated with long reads [20], respectively. Eighty
percent of the introduced SVs were derived from known SVs, and the remaining were derived from artificial novel SVs automatically generated by the VarSim simulator. The introduced known SVs in the Sim-A genome were derived from the DGV variant data contained in the Var-Sim package, and the sizes and chromosomal positions of the introduced SVs faithfully reproduced the corre-sponding DGV variants. The Sim-A read set generated from both the paternal and maternal genomes consisted of 125 bp of paired-end reads with 30× coverage and with 500 bp insert size with 100 bp standard deviation
(Additional file 1: Table S3). A variety of read sets of
Sim-A with different statics in read length (100 bp, 125 bp, and 150 bp), insert size (400 bp, 500 bp, and 600 bp), and coverage (10×, 20×, 30×, and 60×) were generated with the simulated paternal and maternal genomes of
Sim-A using the ART simulator [78]. The simulated
Pac-Bio reads (Sim-A-PacPac-Bio) were generated with the simu-lated paternal and maternal genomes of Sim-A using
PBSIM [57], which was conducted using the
model-based mode with the following options: --depth = 10,
--length-mean = 75,000, and --length-sd = 8000. The
other simulated datasets (Sim-MEI, Sim-NUMT, and Sim-VEI) were generated with in-house scripts. The NUMT sequences (766 NumtS sequences) to be intro-duced were obtained from the UCSC Genome Browser
site (https://genome.ucsc.edu), and the genome
and short indels corresponding to 0.1% and 0.02% of the genome size, respectively, were introduced into chromo-some 17 from the GRCh37d5 reference (Additional file
1: Table S4). Similarly, 200 randomly selected NUMT
se-quences at least 100 bp long and 100 randomly selected VEI sequences were introduced into chromosome 17 to generate Sim-NUMT and Sim-VEI, respectively. To di-versify the VEI sequences, 500 bp to 10 kb fragments were extracted from randomly selected regions of the virus sequences, and random artificial substitutions were
made for 0–5% of the VEI nucleotide bases to be
intro-duced. Using the simulated paternal and maternal chromosome 17 containing VEIs, NUMTs, or VEIs, sim-ulated paired-end reads were generated with the ART simulator, as with VarSim. The read length, insert size, and coverage of the Sim-MEI, Sim-NUMT, and Sim-VEI read sets were the same as the Sim-A data (Additional
file1: Table S3).
The real datasets of NA12878, including Illumina HiSeq and PacBio RS data, were downloaded from DDBJ (http://www.ddbj.nig.ac.jp) and DNAnexus ( https://plat-form.dnanexus.com/login). The NA12878 short and long read sets included four (data1 to data4) and three (Pac-Bio-data1 to PacBio-data3) datasets from different
sources or libraries, respectively (Additional file1: Table
S3). To determine Mendelian inheritance errors for SV calling, Illumina HiSeq WGS datasets of NA12891 and NA12892, which correspond to father and mother of NA12878, were also downloaded from DDBJ. The real datasets of HG00514, including Illumina HiSeq and
Pac-Bio RS data [36], and HG002 PacBio RS dataset from
the Genome in a Bottle (GIAB) Consortium [79] were
downloaded from DDBJ.
Reference SV dataset for real data
A reference SV dataset corresponding to NA12878 was generated by combining the DGV variant data (the 2016-05-15 version for GRCh37) obtained from the
Database of Genomic Variants (http://dgv.tcag.ca/dgv/
app/home) with the PacBio SV data identified from the
NA12878 assembly generated with long reads [20]. The
DGV data contained 1127 DELs (28% of the total DELs) with < 1 kb and 3730 INSs (79% of the total INSs) with < 1 kb or undefined length. We removed these short DELs and INSs from the DGV data because the long read-/assembly-based data covers a higher number of these size ranges of DELs (6550) and INSs (13,131) and is likely to be more reliable than the DGV data. We
fur-ther removed DELs, DUPs, and INVs with ≧95%
recip-rocal overlap (≧90% reciprocal overlap for > 1 kb
variants) in the DGV and long read/assembly data, resulting in the removal of 450 variants in total. The merge of both the datasets was conducted by removing
shorter ones of overlapped DELs with ≧70% reciprocal
overlap, resulting in the inclusion of 1671 DELs, 979 INSs, 2611 DUPs, and 233 INVs specific to the DGV SV data. Although there were still many overlaps within this SV data, they were not removed, because we were un-able to judge which sites were inaccurately defined SVs. All the SVs < 50 bp, except for INSs, were removed. In addition, a high confidence NA12878 SV set (2676 DELs
and 68 INSs) of the svclassify study [80], which has been
deposited in GIAB (ftp://ftp-trace.ncbi.nlm.nih.gov//
giab/ftp/technical/svclassify_Manuscript/Supplemen-tary_Information), was merged, resulting in inclusion of 248 DELs (7%) and 4 INSs (6%) as nonoverlapping vari-ants. Furthermore, 72 experimentally verified nonredun-dant INV dataset from the studies with the long reads
[20,81] and the InvFEST database (http://invfestdb.uab.
cat) was merged, resulting in inclusion of 41 unique
INVs. For the HG00514 SV reference, a minimal 30 bp
of HG00514 variants was extracted from
nstd152.GRCh37.variant_call.vcf.gz, which was obtained
at the NCBI dbVar site (ftp://ftp-trace.ncbi.nlm.nih.gov//
pub/dbVar/data/Homo_sapiens/by_study/vcf)
(Add-itional file1: Table S4). Variants specified as“BND”type
were removed, and variants specified as “CNV” were
reassigned to both DEL and DUP as SV type. For the HG002 SV reference, a minimal 30 bp of variants was extracted from HG002_SVs_Tier1_v0.6.vcf, which was
obtained at the GIAB download site (ftp://ftp-trace.ncbi.
nlm.nih.gov//giab/ftp/data/AshkenazimTrio/analysis/ NIST_SVs_Integration_v0.6) (Additional file1: Table S4) .
SV calling with simulated and real datasets
The simulated and real datasets were each aligned with the GRCh37d5 reference using bwa mem to generate bam files. For Meerkat and Mobster, bam files were modified by adding XA tags and with removing hard-clipped reads to mimic bam files generated with bwa aln although later versions of these algorithms can use bam files generated using bwa mem. For Tangram, bam files were generated by aligning the read set with a reference containing a subset of mobile element sequences using
Mosaik [82]. For VariationHunter, reads were aligned
using mrfast [8] to generate divet files. PacBio long reads
were aligned with blasr [83] for PBHoney and using
NGM-LR [55] for PBHoney-NGM, Sniffles, and pbsv.
These alignment data were used for calling SVs with all the algorithms, except for FermiKit, laSV, BatVI, Mind-TheGap, Pamir, and VirusSeq, for which read data was directly used. PBHoney-NGM was conducted with a custom PBHoney setting, obtained from Dr. Aaron
Wenger at Pacific Biosciences (http://www.pacb.com/
Tangram to call NUMTs or VEIs by modifying their ref-erence or input files, although these algorithms were ori-ginally designed to detect only MEIs (see Additional file
4: Supplementary methods for detail). Detailed
explana-tions for calling SVs with each algorithm are provided in
Supplementary methods in Additional file4.
Evaluation of the SV detection accuracy of SV algorithms For DELs and DUPs, called SVs were divided into four and three fractions, respectively, depending on their size, and precision and recall were calculated for each SV-type and for each size range. Precision was calculated by dividing the number of truly called sites with the total number of called sites, and recall was calculated by div-iding the number of truly called sites with the total number of corresponding reference SVs. The true posi-tive (TP) calls were judged when the called DELs, DUPs,
and INVs exhibited≧80% reciprocal (60% reciprocal for
≦1 kb) and≧50% reciprocal overlaps with the reference
SVs for the simulated and real data, respectively, or when the BPs of the called INSs were placed within 200 bp of those of the reference INSs. We further detmined the SV calls exhibiting Mendelian inheritance er-rors with the WGS datasets of NA12878, NA12891, and NA12892 trio. When the SV calls of the child NA12878
overlap with neither from the parent SV call sets (≦200
bp distance for INSs and ≧50% overlaps for the others),
the corresponding sites were regarded as Mendelian in-heritance errors. Because these sites could attribute to false negatives in parents, we used 1.7-fold coverage of parent WGS datasets relative to the child data to minimize false negatives in parents. Called DELs or DUPs were divided into size ranges and searched against the total DEL or DUP reference sets but not against the divided reference set for the corresponding size range, because the overlap-based search sometimes hits sites with out of the size range. When size-ranged DEL/DUP calls matched the reference, the matched calls were used as true calls for calculating precision for the correspond-ing size range; in contrast, for the calculation of recall, the matched calls were used for the size range of the matched reference site. INSs and DUPs are sometimes
complementary [84] and could be confusedly called by
several types of algorithms. Thus, to judge whether the called INSs are true, we also searched them against the reference DUPs when the called INSs had no matched INS references. When INS calls were matched with the DUP references, the number of hit was added to both the TP calls and the INS reference to calculate precision and recall, respectively. Similarly, called DUPs were also searched against the reference INSs. The precision and recall values for many algorithms varied depending on the RSS threshold values. For several algorithms (e.g., CNVnator, readDepth), information on RSS values was
lacking and thus other information, such as read depth or scores, was converted to a provisional number of RSS
value (see Additional file4: Supplemental methods). To
determine the best precision/recall points for each algo-rithm and for each SV category, we selected an RSS threshold at which the numbers of calls for an SV type approximates but does not exceed 90% of the corre-sponding simulated reference data or the expected SV number in an individual (DEL: 3500, DUP: 550, INS: 3000, and INV: 100, estimated from the previous stud-ies).
Evaluation of accuracy for BP, SV length, and genotype calls
To determine the accuracies of the called BPs and the called SV lengths for each algorithm and for each SV category, we calculated the root mean squared errors (RMSEs) using the results obtained with the Sim-A data (the formula used to calculate RMSEs is presented below). The genotyping accuracy (i.e., homozygous or heterozygous) of called SVs was determined with the Sim-A and the NA12878 real datasets. The reference
data (Real-GT, Additional file 1: Table S4) for NA12878
were generated by merging the array-based CNV data (estd195, nstd22, and nest6) from the dbVar database (https://www.ncbi.nlm.nih.gov/dbvar). Genotyping of DELs/DUPs called with the depth-based SV detection al-gorithms, including AS-GENSENG, CNVnator, Control-FREEC, and readDepth, is described in detail in
Supple-mentary methods in Additional file 4in detail. Precision
was calculated by dividing the number of correctly called genotypes with the number of truly called sites (Preci-sion1) or with the number of truly called sites with
ge-notyped information (Precision2), and recall was
calculated by dividing the number of correctly called ge-notypes by the total number of the corresponding refer-ence SVs.
Evaluation of overlapped calls between pairs of algorithms
Based on the evaluation results for SV detection
algo-rithms, we selected 51 algorithms (12–38 algorithms for
practical use. For every combination of algorithm pairs for each SV category, we selected overlapped calls with
≧60% reciprocal overlap between the call sets from the
two algorithms (filtered with the specified RSS thresh-olds). Both the mean precision and mean recall values for the overlapped calls were calculated with the TP calls determined for each of the algorithm pair. The tested al-gorithms, except for MetaSV, were categorized into six groups based on SV detection methods (RP, SR, RD, AS, long-read (LR) and combined (CB)) that involved any combinations of RP, SR, RD, and AS, and the method-based results of the overlapped calls were summarized by determining the mean values.
Statistical analysis for SV detection accuracy
Precision (Pr) and recall (Rc) were calculated as follows:
Pr¼ TP
Call100
Rc¼ TP Ref100
where TP, Call, and Ref are the numbers of true posi-tives, called SVs, and the corresponding reference SVs, respectively.
To determine the degree of variance in both precision and recall between the different library properties (e.g., different ranges in read length), the coefficient of vari-ation (CV; the ratio of the standard devivari-ation to the mean) in precision and recall was determined for each algorithm for each SV category. The determined CVs were further summarized for each SV category by taking
the mean of the CVs of 6–18 algorithms belonging to
the same SV category.
To determine the rank of precision of overlapped calls for each SV category, a combined precision score (cPr), in which the precision values both for the simulated and real data were integrated, was calculated as follows:
cPr¼ Pr simð Þ Pr realð Þ mPr simð Þ mPr realð Þ
where Pr(sim) and Pr(real) are precision (%) of over-lapped calls for the simulated and real data, respectively, and mPr(sim) and mPr(real) are the mean precision values (%) for the simulated and real data, respectively. These values were calculated using all the overlapped calls in each SV category.
To examine the consistency of the determined SV call-ing accuracies between the simulated and the five real datasets, the accuracy ranks of the algorithms were com-pared between SV types and/or datasets using the Spear-man rank correlation coefficients. The accuracy of algorithms within a dataset was ranked with a modified
F-measure (F) using the following equations:
F¼ 2 PrRcNrc PrþRcNrc
ð Þ0:01
where Pr, Rc, and Nrc are precision (%), recall (%), and the normalization index for an algorithm, respectively. Because the recall values for the real datasets were con-siderably lower than those for the simulated dataset due to an excess of overlapped reference SVs for the real data, we normalized the recall values between the simu-lated and real datasets with the normalization index. The normalization index is a constant value specific to the SV type to normalize recall values for the real data; its value were 2.9, 4.0, 2.4, and 2.4 for DEL, DUP, INS, and INV, respectively.
When the accuracies of the algorithms were ranked
using the F-measures for two datasets, the Spearman
rank correlation coefficients (rs) between the two
data-sets were determined as follows:
rs¼1−
6Pdi2
n3−n
where di is the difference between the ith algorithm’s
ranks of each dataset, andnis the number of algorithms for either dataset.
The root mean squared errors (RMSEs) were calcu-lated according to the following formula to determine the statistical errors of the called BPs and SV lengths for each algorithm:
RMSE¼
ffiffiffiffiffiffiffiffiffiffiffiffiffiffiffiffiffiffiffiffiffiffiffiffiffiffiffiffiffiffi 1
N
XN
i¼1 Ci−Ri
ð Þ2
v u u t
whereNis the number of truly called SVs,Ciis a break-point (or SV length) of theith truly called SV, andRiis a breakpoint (or SV length) of the corresponding refer-ence SV.
Additional files
Additional file 1:Figures S1-S12,Figures S14-S23, andTables S1-S4, S12, S13, S15, S19, S20.(PDF 1464 kb)
Additional file 2:Figure S13.Effect of read length, read coverage, and insert size on recall and precision for various SV algorithms. (PDF 2174 kb)
Additional file 3:Table S5.Recall and precision of SV-calling results with the simulated data (Sim-A, Sim-MEI, Sim-NUMT, Sim-VEI).Table S6.
Recall and precision of SV-calling results with the real data (NA12978 data1 or PacBio-data1).Table S7.Recall and precision of SV-calling results with the real data (NA12978 data2 or PacBio-data2).Table S8.Recall and precision of SV-calling results with the real data (NA12978 data3 or PacBio-data3).Table S9.Recall and precision of SV-calling results with the real data (NA12978 data4 or PacBio-HG002).Table S10.SV calling re-sults (recall, precision, Mendelian inheritance error, mean, and standard error) obtained with the four (or three) NA12878 real datasets. (including the numerical data of Fig.3and Additional file1: Figures S3–S5).Table S11.Recall and precision of SV-calling results with the HG00514 real data.