R E S E A R C H
Open Access
The bread wheat epigenomic map reveals
distinct chromatin architectural and
evolutionary features of functional genetic
elements
Zijuan Li
1,2†, Meiyue Wang
1,2†, Kande Lin
3†, Yilin Xie
1,2†, Jingyu Guo
1,4, Luhuan Ye
1,2, Yili Zhuang
1,2, Wan Teng
2,5,
Xiaojuan Ran
1,2, Yiping Tong
2,5, Yongbiao Xue
2,5, Wenli Zhang
3*and Yijing Zhang
1,2*Abstract
Background:Bread wheat is an allohexaploid species with a 16-Gb genome that has large intergenic regions, which presents a big challenge for pinpointing regulatory elements and further revealing the transcriptional regulatory mechanisms. Chromatin profiling to characterize the combinatorial patterns of chromatin signatures is a powerful means to detect functional elements and clarify regulatory activities in human studies.
Results:In the present study, through comprehensive analyses of the open chromatin, DNA methylome, seven major chromatin marks, and transcriptomic data generated for seedlings of allohexaploid wheat, we detected distinct chromatin architectural features surrounding various functional elements, including genes, promoters, enhancer-like elements, and transposons. Thousands of new genic regions and cis-regulatory elements are identified based on the combinatorial pattern of chromatin features. Roughly 1.5% of the genome encodes a subset of active regulatory elements, including promoters and enhancer-like elements, which are characterized by a high degree of chromatin openness and histone acetylation, an abundance of CpG islands, and low DNA methylation levels. A comparison across sub-genomes reveals that evolutionary selection on gene regulation is targeted at the sequence and chromatin feature levels. The divergent enrichment of cis-elements between enhancer-like sequences and promoters implies these functional elements are targeted by different transcription factors.
Conclusions:We herein present a systematic epigenomic map for the annotation of cis-regulatory elements in the bread wheat genome, which provides new insights into the connections between chromatin modifications and cis-regulatory activities in allohexaploid wheat.
Keywords:Bread wheat, Allohexaploid, Epigenomic map, Chromatin signature, Regulatory element, Promoter, Enhancer
© The Author(s). 2019Open AccessThis article is distributed under the terms of the Creative Commons Attribution 4.0 International License (http://creativecommons.org/licenses/by/4.0/), which permits unrestricted use, distribution, and reproduction in any medium, provided you give appropriate credit to the original author(s) and the source, provide a link to the Creative Commons license, and indicate if changes were made. The Creative Commons Public Domain Dedication waiver (http://creativecommons.org/publicdomain/zero/1.0/) applies to the data made available in this article, unless otherwise stated.
* Correspondence:[email protected];[email protected] †Zijuan Li, Meiyue Wang, Kande Lin and Yilin Xie contributed equally to this
work. 3
State Key Laboratory for Crop Genetics and Germplasm Enhancement, Jiangsu Collaborative Innovation Center for Modern Crop Production, Nanjing Agricultural University, No.1 Weigang, Nanjing 210095, Jiangsu, China
1
National Key Laboratory of Plant Molecular Genetics, CAS Center for Excellence in Molecular Plant Sciences, Shanghai Institute of Plant Physiology and Ecology, Shanghai Institutes for Biological Sciences, Chinese Academy of Sciences, 300 Fenglin Road, Shanghai 200032, China
Background
The completion of a high-quality bread wheat reference genome sequence [1] provided researchers with a good opportunity for a thorough analysis of gene regulation in hexaploid wheat. A previous study indicated that the noncoding regions account for approximately 93% of the 16-Gb genome [1]. Studies in both higher plants and an-imals revealed abundant highly conserved regulatory ele-ments in noncoding regions with essential regulatory activities [2, 3], the detection of which is critical for a comprehensive characterization of the regulatory net-works. Conserved sequences are a typical feature of regulatory elements. However, considering the intrinsic shortness and degeneracy of sequence motifs underlying regulatory activities, the detection of functional elements
merely based on sequence information for large
intergenic regions is far from accurate. It is well-acknowledged that the interplay between cis-regulatory elements and epigenetic modifications is crucial for regulating gene activity. In humans, the major regulatory elements, including promoters, enhancers, and tran-scription factor-binding sites, are largely predictable based on chromatin features [4]. Various types of chro-matin modifications regulating gene activity have been described and applied for pinpointing cis-regulatory ele-ments, including histone acetylation; mono-, di-, and tri-methylations; and DNA methylation [5]. Additionally, chromatin openness has been characterized with various techniques to identify regions that are highly accessible to regulatory factors [6]. The “epigenetic code hypoth-esis”that has been proposed states that different combi-nations of chromatin modifications are associated with distinct biological consequences [7]. Thus, the integra-tion of epigenomic architecture and sequence features has become a powerful means for pinpointing the regu-latory elements in the genome and for revealing the regulatory mechanism, ultimately helping to accurately narrow down the chromosomal locations of candidate functional regions [4,5,8–11].
Because of its recent history, hexaploid wheat is a good model plant species for studying polyploidy, the major factor driving the evolution of plant genomes [12]. Alterations in the epigenetic and transcriptional regula-tion of duplicated gene copies are among the main
fac-tors contributing to the increased developmental
flexibility and adaptability of bread wheat to diverse en-vironments [13–15]. In a recent study, the transcriptome of bread wheat was comprehensively profiled across a range of tissues and cultivars, which systematically char-acterized the similarities and differences in the expres-sion of homologs [13]. Epigenetic modification is one major component regulating transcription, and how epi-genetic modifications, especially those localized in inter-genic regulatory regions, influence the transcription
across sub-genomes remains unclear. Furthermore, many gene families expanded during hexaploidization [1], and the epigenetic regulation of the newly generated gene cop-ies and the ancient genes is an interesting issue that may be correlated with the advantages of polyploidy. To ad-dress these issues, a systematic characterization and com-parison of epigenomic architectural features across hexaploid wheat sub-genomes is indispensable.
In the present study, the epigenomic maps of open chromatin, multiple histone modifications, and DNA methylation, as well as transcriptomic patterns were sys-tematically profiled. We detected the distinct chromatin architectural and sequence features associated with dif-ferent functional elements. Further comparisons across sub-genomes revealed highly conserved sequence and epigenomic architecture surrounding a subset of active regulatory regions. Additionally, the extent of the chro-matin openness and H3K9 acetylation marks was highly correlated with enhancer activities, as reflected by a re-porter assay, demonstrating that the specific combina-torial epigenomic pattern is a good predictor of cis-regulatory elements in bread wheat.
Results
Chromatin architecture of bread wheat seedlings
characterized model plant species with relatively small genomes, including A. thaliana and rice. These results suggested that these marks are potentially involved in the remote regulation of gene activity.
Chromatin signatures surrounding genes
We started by characterizing the chromatin features sur-rounding promoter and genic regions, as well as their association with gene activities. The genes targeted by these marks were divided into five groups based on the combination of marks (Fig. 1c and Additional file 2: Table S1). Highly expressed genes (group I) were prefer-entially marked by H3K4me3, H3K9ac, and H3K36me3 (Fig. 1d), similar to the pattern reported in vertebrates, bread wheat, and other plant species [13, 17, 18]. The expression of group 4 genes preferentially marked by H3K27me3 exhibited high tissue specificity (Fig. 1e), consistent with the role of the Polycomb group proteins (PcGs) responsible for catalyzing H3K27 tri-methylation to control development [19]. The most enriched protein families in each group are presented in Fig.1f. Interest-ingly, nucleotide-binding site leucine-rich repeat (NB-LRR) genes accounted for 30% of the group 4 genes, which were marked by H3K27me3, implying that PcGs may influence wheat immunity.
The polyploidization of wheat resulted in the expan-sion of many gene families [1], which generated an abundance of new genes. We wondered how these newly generated gene copies are regulated at the epigenetic level. We divided the bread wheat genes into the follow-ing two categories: “old” genes within regions highly similar to the genomes of diploid and tetraploid progeni-tors, and “young” non-conserved genes localized to re-gions with little or no similarities to the genomes of wild progenitors (see the “Methods” section). We observed a substantial enrichment of “young” genes in groups with H3K27me3 marks (Fig. 1g). Because H3K27me3 prefer-entially occurs at the distal end of chromosomes with a high recombination rate [1] (Fig. 1a), it is likely that H3K27me3 repressed new genes in specific genomic regions.
Association between sub-genome divergence in gene expression and promoter histone marker density
Bread wheat is an allohexaploid species with three sub-genomes. The divergence of redundant gene copies would be expected to increase the adaptability of bread wheat [20]. To examine the sub-genome preferential binding of the epigenetic marks in promoter regions and the associated functional consequences, a previously de-scribed ternary plot was applied [13], with a particular focus on 12,669 expressed triads (1.1:1 correspondence across the three homologous sub-genomes). All triads were divided into the following seven
sub-genome-biased binding groups: a balanced group, with similar binding across the three homologs, and six dominant or suppressed groups, with higher or lower binding in one homolog (Fig. 2a and Additional file 2: Table S2). Among these modifications, the binding of H3K4me3, H3K9ac, and H3K36me3 was highly diverse, whereas the other modifications were relatively stable across the three sub-genomes (Fig. 2b). The sub-genome-biased binding was further compared with sub-genome-biased expression. We observed that the divergent binding of H3K4me3, H3K9ac, and H3K36me3 was highly corre-lated with the biased expression of the target genes (Fig. 2c). A recent study revealed the positive correl-ation between sub-genome divergence in transcription and H3K36me3/H3K9ac binding across gene body re-gions. In the current study, we determined that these promoter region modifications were also closely associ-ated with sub-genome divergent transcription. More-over, we identified the top active histone modifications whose divergent binding is closely associated with divergent transcription among the major regulatory histone marks.
Distinct and predictive chromatin features surrounding various functional elements
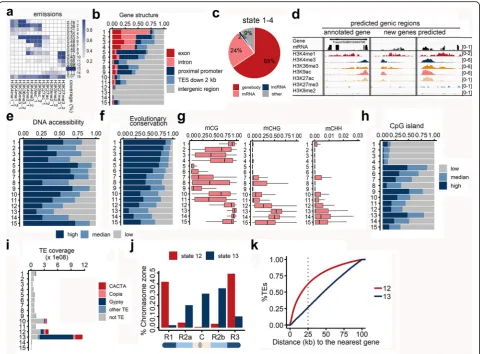
Bread wheat has extremely large intergenic regions that are five times larger than those of the human genome. These regions are likely rich in distal gene regulatory el-ements marked by various chromatin architectural fea-tures. To summarize the genome-wide combinatorial patterns of these chromatin marks, we applied a multi-variate hidden Markov model (HMM) to distinguish be-tween chromatin states [21]. This method has been widely used in human studies, in which it has enabled the detection of regulatory elements related to individual marks [21]. The genomic regions marked by these modi-fications were divided into 15 chromatin states based on the combinations of marks (Fig.3a), which were associ-ated with a distinct enrichment of biological activities. All states could be visualized with a customized genome browser (http://bioinfo.sibs.ac.cn/cs_epigenome). To functionally characterize the various chromatin states, the genomic, transcriptomic, and epigenomic features of these 15 states were examined in detail. Specifically, we analyzed the distribution of gene structures, chromatin accessibility, sequence conservation across ploidy levels, coverage of CpG islands (CGIs), and DNA methylation levels (Fig. 3). High read densities for all modifications were observed for chromatin state 15. Subsequent exam-inations revealed that this state was associated with
rela-tively low conservation regarding sequences and
Regions corresponding to chromatin states 1–4 were enriched in gene body regions, accounting for 1.7% of the whole genome. These states were mainly character-ized by the enrichment of H3K4me1 and H3K36me3, the typical histone marks present in actively expressed genes (Fig. 3a and b). We observed that most (91%) of these regions were transcriptionally active. In addition to 65% of the regions carrying annotated genes, 24% and 2% of the unannotated regions were associated with mRNA and lncRNA sequencing reads, respectively
(Fig.3c). We identified 8987 transcribed regions in states 1–4 that were not annotated in the high-confidence gene models (the coordinates are listed in Additional file 2: Table S3). Further examination revealed that 63% (5660/ 8987) of the 8987 transcripts belonged to low-confidence gene models, and the rest transcripts mostly (94%) had low coding potential, i.e., non-coding tran-scripts (Additional file 2: Table S3). Genomic tracks in Fig. 3d illustrates the transcriptional activity (reflected by the RNA-seq read density) associated with the
[image:5.595.57.540.84.546.2]regions in these states, including annotated in the high-confidence gene models (the first panel) and unanno-tated (the other two panels) regions. Thus, the combina-torial pattern of these active histone marks is a good predictor of actively expressed genes.
Increased nuclease sensitivity and H3K9ac or H3K27ac are typical characteristics of regulatory elements, includ-ing promoters and enhancers, as previously reported in humans and maize [22, 23]. Chromatin states 5–7 were typically enriched for H3K9ac, as well as H3K27ac to a lesser extent (Fig. 3a). Some regions in these states also
had a high density of H3K4me3 and H3K36me3. The last column in Fig.3a represents the genome coverage of each state, and states 5–7 with potential regulatory activities accounted for roughly 1.5% of the whole genome [0.53% (state 5), 0.48% (state 6), and 0.48% (state 7)]. These states exhibited extensive chromatin openness characterized by abundant DHS reads (Fig.3e), thus representing DNA re-gions that are easily accessed by transcription factors and other regulatory proteins. In addition to a high density of DHSs and histone acetylation, chromatin states 5–7 in-cluded several other typical features of transcriptional
Fig. 3Distinctive and predictive chromatin signatures of functional elements.aChromatin states determined with a multivariate hidden Markov model. The heatmap presents the emission parameters based on genome-wide combinations of epigenetic marks. Dark blue represents a high frequency of a given mark at regions corresponding to the chromatin state. Each row represents one state, and each column represents one chromatin mark, except the last column, which represents the genomic coverage of the given state. Replicates displayed good consistency.bBar plot indicating the distribution of genomic positions in each state for various genomic features.cPie plot presenting the fraction of regions in each chromatin state covering mRNA or lncRNA sequencing reads.dGenomic tracks illustrating three predicted genes based on the signatures of chromatin states 1–4. The first gene was annotated according to the IWGSC RefSeq genome assembly (version 1.0), whereas the other two genes were not annotated, but had a high RNA-seq read density. The data in square brackets represent the range of normalized read densities. The number of reads in each position was normalized against the total number of reads (reads per million mapped reads).e,fFor each chromatin state, the fractions of open chromatin regions characterized by DHS read density (e) and conservation score across wheat species (f) were calculated.
[image:6.595.58.539.87.441.2]regulatory elements as revealed in human studies [4,5,8, 9]. First, because regulatory elements are crucial for tran-scriptional regulation, they are generally subjected to puri-fying selection. A conservation score was calculated for each position of the wheat genome sequence by compar-ing homologous genomes with various ploidy levels (see the “Methods” section). The conservation scores for the sequences of chromatin states 5–7 were relatively high, similar to those of the gene body regions (Fig.3f ). Second, the DNA methylation levels in chromatin states 5–7 were low, especially in the CG context (Fig. 3g and Add-itional file1: Figure S2). Cis-regulatory regions are gener-ally devoid of DNA methylation, which is supposed to be responsible for chromatin compaction and gene silencing [24]. Third, CGIs in mammalian genomes are important genomic elements related to transcriptional regulation and are associated with promoters and enhancers devoid of DNA methylation [25]. Whether the CGI-like regions in plants are functionally equivalent to mammalian CGIs remains controversial [26]. We observed that in wheat, CGIs were generally sheltered from DNA methylation in the CG and CHG contexts, which represent the major types of DNA methylation (Additional file 1: Figure S3). The CGIs were relatively abundant in chromatin states 5– 7, especially in state 5 with increased chromatin accessibil-ity and sequence conservation (Fig.3h). Altogether, these results provide additional evidence that chromatin states 5–7, accounting for approximately 1.5% of the whole gen-ome, include a subset of active regulatory elements.
Our data revealed that chromatin state 13 was the lar-gest and was characterized by the binding of H3K9me2 (Fig.3a). A reinforcement loop exists between H3K9me2 and DNA methylation to repress TE activities and medi-ate chromosome condensation [27]. The regions in chromatin state 13 consistently had high DNA methyla-tion levels (Fig. 3g), high TE abundance (Fig. 3i), and low DHS densities (Fig. 3e). Interestingly, instead of an enrichment of the H3K9me2 mark, a subset of TEs was preferentially marked with H3K27me3 (chromatin state 12). A subsequent examination revealed that consider-ably fewer Gypsy-type LTR sequences were detected for H3K27me3-marked TEs (chromatin state 12) than for TEs marked by H3K9me2 (chromatin state 13) (Fig. 3i). Because Gypsy sequences are mostly localized to centromere-proximal regions, we examined the chromo-somal localization of TEs preferentially marked by H3K27me3 and H3K9me2. As expected, TEs marked by H3K27me3 were preferentially localized to the distal end of chromosomes with high gene densities, whereas TEs repressed by H3K9me2 were localized to centromere-proximal regions (Fig.3j, k). It is well-acknowledged that H3K9me2 and DNA methylation are responsible for the stable repression of TEs, whereas H3K27me3 is related to a conditional or relatively transient repression
responsible for controlling developmental transitions or environmental stress responses. Thus, it is likely that the
repression of TEs in gene-abundant regions by
H3K27me3 may restrict the condensation of chromo-somal regions surrounding genes.
Conservation of chromatin architecture surrounding functional elements across sub-genomes
To further estimate the conservation and diversity of chromatin signatures across sub-genomes at the epige-nomic level, we assessed the similarities of distinct chro-matin states between sub-genomes, with a focus on collinear regions. The chromatin states were largely similar across the three sub-genomes, with the exception of chromatin states 14 and 15 (Fig. 4a). Chromatin state 5 corresponding to regulatory elements and chromatin states 1 and 2 corresponding to gene body regions were highly similar across the three sub-genomes, with Jac-card similarity indices ranging from 0.64 to 0.67. Gen-omic tracks in Fig.4b illustrates one intergenic collinear region of the three sub-genomes with a similar epigen-etic pattern. Regions in these states are most likely func-tionally conserved given the highly conserved sequence and epigenetic activity.
Common and unique features of promoters and enhancer-like elements
To examine the differences between proximal promoter and distal regulatory elements, we compared the se-quence features and chromatin signatures between these two types of regions in chromatin state 5, which dis-played typical epigenetic features of cis-regulatory ele-ments and are highly conserved across subgenomes (Figs.3a,5a–d, and Additional file2: Table S4). On aver-age, H3K4me1 was more extensive surrounding
pro-moters than in enhancer-like elements in wheat
promoters and enhancer-like elements. The promoters were enriched with GCC/GGC-rich motifs, whereas the enhancer-like elements tended to have GA/TC- and AT/ TA-rich motifs. Similar results were obtained in earlier human studies, which concluded that the GA dinucleo-tide repeat is required for and may be used to predict broadly active enhancers [28, 29]. This differential pref-erence for sequence contexts between promoter and enhancer-like regions may reflect the diversity in the transcription factor occupancy between these two types of regulatory elements.
Functional validation of enhancer-like elements
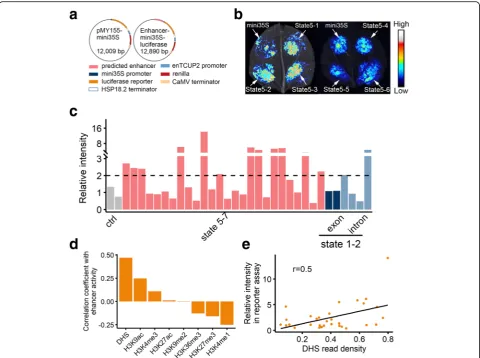
We further verified the functional potential of the pdicted enhancer-like elements based on a luciferase re-porter assay. Twenty-six gene-distant sequences (distance to the nearest gene > 20 kb) in chromatin state 5 with varying DHS densities were analyzed. Specifically, these sequences were inserted into a reporter vector under the control of the 35S promoter, after which the recombinant plasmids were used for the transient transfection of
Nicotiana benthamianaleaves (Fig. 6a). Of the 26 evalu-ated sequences, half of the regions exhibited robust activ-ity in the reporter assay, with higher signals in all three spots in all three replicates compared with the controls carrying the 35S promoter alone. Figure 6 b and c and Additional file1: Figure S4 present the results of one repli-cate. The data for all replicates are listed in Add-itional file2: Table S5. In mammals, some intronic regions may enhance the expression of nearby genes [30,31]. To test if wheat intronic regions with an active epigenetic architecture can enhance gene expression, we examined the enhancer activity of regions in states 1 and 2 with high DHS density, including four intronic and two exonic gions. Among these six regions, two of the intronic re-gions displayed robust activity (Fig. 6c, Additional file 1: Figure S4, and Additional file2: Table S5), indicating the wheat introns exhibit enhancer activity. To further deter-mine which epigenetic marks are correlated with the en-hancer activity, we calculated the Pearson correlation coefficients for the signal densities from the reporter assay and the read densities of each epigenetic mark in the
[image:8.595.60.538.89.416.2]tested regions. Enhancer activity was most correlated with DHS and H3K9ac densities (r= 0.5 and 0.3, respectively) (Fig.6d, e), indicating these marks are good predictors of enhancer activity.
Discussion
In this study, we used combinatorial patterns of chroma-tin features to analyze functional elements in hexaploid
wheat, especially the regulatory elements in large non-coding genomic regions. We revealed that approximately 1.5% of the genome potentially encodes a subset of ac-tive cis-elements, including promoters and enhancer-like elements. Among these regions, state 5 was highly con-served regarding the sequence and epigenetic activity across the sub-genomes, indicating that the purifying se-lection on gene regulation involves both sequence and
Fig. 5Epigenetic and sequence features of predicted promoters and enhancers.a–dAverage profile of H3K4me1 (a), H3K4me3 (b), DHS (c), and H3K9ac (d) read densities surrounding the center of gene-proximal and gene-distal regions in chromatin state 5 (S5) and regions in chromatin states 1 (S1) and 2 (S2) corresponding to gene bodies highly conserved across three sub-genomes.eCis-elements differentially enriched in the promoter and enhancer-like regions in state 5. The bar plot represents the relative log2fold-change of the occurrence of corresponding motifs in
[image:9.595.59.536.89.569.2]chromatin features. These findings significantly nar-rowed down the possible locations of functionally pivotal regions within the large intergenic regions of the bread wheat genome.
Comparing the conservation and divergence of tran-scriptional regulation between different ploidy levels is critical for a thorough understanding of the functional consequences of polyploidization, the major driving force for plant evolution [12]. Because of a recent hexaploidiza-tion event in bread wheat, the divergence between hexa-ploid wheat and its progenitors is not very large, thus enabling an effective comparison across wheat of different ploidy levels. To characterize the gene regu-latory mechanisms, a systematic and accurate annota-tion of regulatory elements is a prerequisite. However,
the large intergenic regions of the bread wheat gen-ome represent a major challenge for researchers attempting to pinpoint functionally important ele-ments and reveal regulatory mechanisms. Previously well-studied model plant species, including A. thali-ana and rice, have genomes with only 100–400
mil-lion base pairs, and the available information
regarding distal transcriptional regulation in plants is limited. The relationship between chromatin features and transcriptional regulatory activities revealed in the present study may be useful for predicting cis-regulatory elements and cis-regulatory activity in wheat genomes.
The chromatin architectural features surrounding
functional elements in the wheat genome share
[image:10.595.58.539.87.445.2]similarities and differences with those in mammalian ge-nomes. First, CGIs have been well-characterized in mammals as important regulatory regions devoid of methylated DNA [26], whereas the functions of plant CGI-like regions remain unclear [26]. We observed that similar to the epigenetic patterns of CGIs in mammals, the CGIs in wheat were generally lacking in the major form of DNA methylations (Additional file 1: Figure S5) and many of them were present in active cis-regulatory regions (Fig. 3h). In addition to states 5–7, CGIs were abundant in state 9, which was associated with a high density of H3K27me3. This is consistent with a previous report that indicated CGIs in animals can be repressed by a PcG-mediated H3K27me3 modification [26]. How-ever, we also detected a subset of CGIs enriched in state 13 preferentially marked by H3K9me2, which contra-dicts the results of an earlier animal study revealing the depletion of H3K9me2/3 surrounding CGI+ genes [32]. This may be associated with the difference of the epigen-etic factors involved in catalyzing H3K9 di-/tri-methyla-tion between animals and plants [33]. Second, similar cis-elements were over-represented in enhancer-like ele-ments in wheat and mammals, with a GA dinucleotide repeat as a typical example (Fig. 5e), indicating a likely ancient regulatory mechanism for distal gene regulation. Third, similar to the pattern in mammals, H3K4me3, H3K9ac, and H3K36me3 were common marks in the ac-tive wheat genes. There was a small difference in terms of the H3K4me3 pattern, which is highly enriched in the transcription start site (TSS) of mammals, but extends into the gene body regions in wheat (Additional file 1: Figure S1). Fourth, a considerable abundance of the H3K4me1 mark is a typical feature of enhancers in mammals, whereas H3K4me1 preferentially marks gene body regions in wheat and other plant species [16, 34] (Additional file 1: Figure S1). These observations imply that the regulatory role of this mark evolved independ-ently in plants and mammals. Finally, in mammals, en-hancers marked by H3K27me3 are largely in a poised state [35]. Similarly, we observed that in wheat, the fea-tures of chromatin state 9 (Fig.3a), accounting for 0.8% of the whole genome sequence, were similar to those of chromatin state 5, which corresponds to the highly con-served regulatory regions. Both states were similar re-garding chromatin accessibility, H3K9ac marks, CGI coverage, and conservation scores (Fig. 3). The only difference was that chromatin state 9 had a large abundance of H3K27me3. Whether this state repre-sents the repressed regulatory elements in wheat seedlings will need to be experimentally verified. Con-sidering that enhancers generally exhibit high tissue specificity, future studies including diverse tissues under various experimental conditions will lead to a more comprehensive characterization of the dynamic
roles of these regulatory elements influencing
transcription.
Our functional validation of the selected regions sug-gested that about 50% of the regions were associated with high luciferase expression in the reporter assay. This ratio is somewhat lower than the positive ratio (7/ 9 = 78%) for the predicted human enhancers based on a similar computational method. It is worth noting that 50% positive ratio in the present study is a stringent esti-mation which did not take in to account regions show-ing active enhancer activity in one or two of the three experimental replicates, in order to present the most re-liable enhancer-like regions validated. It is possible that the active cis-regulatory regions predicted herein may require additional temporal or spatial trans-acting fac-tors for the enhancer function. Additionally, considering the large bread wheat genome and complex interactions between the three sub-genomes, it is possible that there
are abundant inter- and long distance
intra-chromosomal interactions that may be coordinated to regulate transcriptional activity. The cis-elements pre-dicted in the present study provide good candidates for future studies of the transcriptional regulation by large-scale chromosomal interactions. Considering the dynam-ics and specificity of enhancers, future studies involving diverse tissues under various experimental conditions are needed to more comprehensively elucidate the roles of these regulatory elements influencing transcription.
Conclusion
The regulatory elements detected based on the comphensive profiling of chromatin structures are valuable re-sources for the plant community. The findings and approaches described herein provide insightful clues for future investigations of the evolution of gene regulation during wheat polyploidization events.
Methods
Plant materials and growth conditions
The bread wheat (Triticum aestivum) cultivar “Chinese Spring” was analyzed in this study. Seeds were sterilized by a 10-min incubation in 30% H2O2and then thoroughly washed five times with distilled water. The sterilized seeds were germinated in water for 3 days at 22 °C, after which the germinated seeds with residual endosperm were trans-ferred to soil. After a 9-day incubation under long-day conditions, the aboveground parts were harvested. The harvested samples were either frozen in liquid nitrogen for an RNA isolation step or vacuum-infiltrated with a for-maldehyde cross-linking solution for a ChIP assay.
ChIP and RNA sample preparation and sequencing
USA), H3 trimethyl-Lys 4 (Abcam), H3 trimethyl-Lys 36 (Abcam), H3 dimethyl-Lys 9 (Abcam), H3 monomethyl-Lys 4 (Upstate), H3 acetyl-monomethyl-Lys 27 (Upstate), and H3 acetyl-Lys 9 (Upstate). For each ChIP-sequencing assay, approximately 30 seedlings were pooled together and ground to a powder. More than 10 ng ChIP DNA, 2μg mRNA and 2μg total RNA (rRNA depleted) were used to prepare each sequencing sample. Libraries were con-structed and sequenced by Genenergy Biotechnology Co. Ltd. (Shanghai, China). For total RNA-seq, the strand-specific library was constructed as previously described [37]. The libraries were sequenced with the HiSeq 2000/ 2500 system (Illumina) to produce 150-bp paired-end reads. The sample preparation, library construction, and sequencing were completed with two biological replicates. Sequencing data for the replicates had relatively high Pear-son correlation coefficients (Additional file 1: Figure S6). The ChIP-sequencing data were highly correlated with the data from a recently published study [13], which involved a ChIP-sequencing analysis of H3K27me3, H3K4me3, and H3K9ac (Additional file1: Figure S7).
DNase-sequencing library preparation and sequencing
The harvested seedlings used to prepare
ChIP-sequencing samples were also subjected to a DNase I treatment. Specifically, to prepare DNase-sequencing li-braries, approximately 20 seedlings were fixed with 1% formaldehyde in HEPES buffer (50 mM HEPES, 1 mM EDTA, pH 8.0, 0.1 M NaCl, and 1 mM PMSF). The fixed seedlings were ground to a fine powder in liquid nitro-gen. Wheat nuclei were extracted with H1B buffer (20 mM Tris-HCl, pH 8.0, 50 mM EDTA, 5 mM spermidine, 0.15 mM spermine, 40% glycerol, and 0.1% mercap-toethanol). The extracted nuclei were purified with H1B buffer supplemented with 0.5% Triton X-100. The puri-fied nuclei were washed once with RSB buffer (10 mM Tris-HCl, pH 7.4, 10 mM NaCl, and 3 mM MgCl2). The pelleted nuclei were resuspended with 2 ml RSB buffer and then divided equally into five 1.5-ml Eppendorf tubes. The aliquoted nuclei were digested with DNase I (0, 0.01, 0.03, 0.05, and 0.08 units). The resulting digested nuclei were extracted using 1 volume of phenol, phenol:chloroform, and chloroform, after which the DNA from each digestion was resuspended in 2 volumes of cold ethanol and then pelleted. A DNase-sequencing library was prepared from 0.03 U DNase I-digested nu-clei. Approximately 2μg DNA was separated by 1.5% agarose gel electrophoresis, and DNA fragments (50– 300 bp) were cut and purified to prepare the DNase-sequencing library with the NEBNext® Ultra™II DNA Li-brary Prep Kit for Illumina (NEB). Two biological repli-cates of the libraries were prepared. The quality of the final DNase-sequencing libraries was checked, after
which the libraries were sequenced with the 150-bp paired-end mode of the Illumina NovaSeq platform.
Processing of sequencing data
Bisulfite sequencing and data analysis
Bisulfite sequencing samples were prepared with 2.2μg DNA extracted from the harvested seedlings that were also used to prepare the ChIP-sequencing and DNase-sequencing samples. The bisulfite DNase-sequencing libraries were constructed and the subsequent deep sequencing was completed by Genenergy Biotechnology Co. Ltd. (Shanghai, China). The libraries were sequenced with the HiSeq 3000 system (Illumina) to produce 150-bp paired-end reads, which were cleaned as described above. The clean reads were then aligned to the IWGSC reference sequence (version 1.0) with the default settings of the Bismark program (version 0.19.0) [44]. The de-fault settings were strict, with only the best unique align-ments reported, and all non-unique alignalign-ments were removed [44]. Thus, we applied only two additional fil-tering steps, namely the removal of reads with a map-ping quality < 20, followed by the removal of PCR duplicates with the deduplicate_bismark implemented in the Bismark program (version 0.19.0).
The extent of the cytosine methylation was deter-mined with the bismark_methylation_extractor imple-mented in the Bismark program (version 0.19.0). Next, the methylation ratio of a cytosine was calculated as the number of mCs divided by the number of reads covering the position. Bases covered by fewer than three reads were considered low-confidence positions whose methy-lation ratios were not recorded.
Definition of triad genes
High-confidence gene models from the IWGSC
RefSeq genome assembly (version 1.0) were used for defining triad genes. OrthoFinder [45] was applied to detect orthogroups for all homologous genes across the three sub-genomes. A total of 18,313 orthogroups, with only one gene copy in each sub-genome, were
defined as triads. We considered a triad was
expressed when the sum of the FPKM of homologs from three sub-genomes > 1. Thus, 12,669 expressed triads were detected.
Detection of CpG islands
The CGIs were detected with the R package makeCGI [46], which involves two HMMs for the GC content and the ratio of observed versus expected CpGs. To deter-mine the posterior probability cutoff, we assessed the sensitivity, which was defined as the percentage of TSSs covered by a CGI given the observation that CGIs were enriched surrounding TSSs (Additional file1: Figure S5, see below). The receiver operating characteristic (ROC)-like plot in Additional file1: Figure S5 presents the frac-tion of TSSs covered by a CGI (used as a measure of sensitivity) versus the total length of different CGIs
(used as a measure of specificity) defined with posterior probability cutoffs ranging from 0.5 to 0.9995. We chose 0.99 as a cutoff value because it is associated with the in-flection point of the ROC curve. With 0.99 as a cutoff, we determined that 43.4% of the TSSs were covered by a CGI, which is comparable to the ratios in humans and mice (50%–56%) [46]. A further comparison with the proportion of TSSs covered by random regions with the same number and length distribution of a given CGI suggested that CGIs are apparently enriched at TSSs in wheat (Additional file1: Figure S5).
Identification of newly formed genes in hexaploid wheat
The MUMmer 4.0 program [47] was applied to compare the genome sequences of hexaploid wheat T. aestivum (AABBDD, IWGSC version 1.0) and the progenitors, in-cludingTriticum turgidum(AABB, WEWSeq version 1.0), Triticum urartu (AA, Tu2.0), andAegilops tauschii (DD, ASM34733 version 2). Collinear regions identified by MUMmer with a sequence identity > 90% were defined as
“similar regions”. To increase the stringency of the defin-ition of old and young genes, OrthoFinder [45] was used to detect orthologous genes between hexaploid wheat and the progenitors. Orthologous genes within similar regions (sequence identity > 90%) in hexaploid wheat and the pro-genitors were defined as “old” genes (100,166 genes), whereas hexaploid wheat genes outside these similar re-gions and with no orthologues in wild progenitors were defined as“young” genes (10,624 genes). All gene models were downloaded from published annotated reference ge-nomes. TheT. urartu(AA) gene model was downloaded fromhttp://www.mbkbase.org/Tu/[48], whereas the gene model ofA. tauschii(DD) was obtained from a published study [49] and the gene model of T. turgidum (AABB) (WEWseq_PGSB_v1) was downloaded fromhttps://www. dropbox.com/sh/3dm05grokhl0nbv/AADLrcn1iV48S1pT Rpd0PJm4a/Annotation?dl=0&subfolder_nav_tracking=1 [50].
Definition of homolog expression and epigenetic-binding bias categories
in the A genome than in the other two sub-genomes were defined as A-dominant. Genic regions with a significantly lower level of binding in the A sub-genome than in the other two sub-sub-genomes were de-fined as A-suppressed. Other regions with no significant binding differences among sub-genomes were defined as balanced regions.
Detection of chromatin states
To assess the combinatorial patterns of seven chromatin marks, we applied a previously developed machine-learning method based on a multivariate HMM, ChromHMM (ver-sion 1.17) [52], which defined distinct chromatin states representing various combinatorial presence/absence pat-terns for multiple marks.
Calculation of the sequence conservation score
We completed a pair-wise comparison of the genome
se-quences from T. aestivum (AABBDD sub-genome,
IWGSC version 1.0), T. turgidum (AABB sub-genome,
WEWSeq version 1.0), T. urartu (AA sub-genome,
Tu2.0), and A. tauschii (DD sub-genome, ASM34733
version 2) with the nucmer tool implemented in the MUMmer package [47]. The minimum sequence iden-tity was set to 90 and each sub-genome was treated as an individual genome. Next, ROAST [53] was used to integrate pair-wise sequence alignments into a multiple sequence alignment. The multiple sequence alignment and tree data were fitted by PhyloFit, after which the conservation score was calculated with phastCons from the PHAST package [54].
Characterization of the coding potential
The protein coding ability of newly predicted transcripts was assessed using coding potential calculator (CPC) [55]. For 3327 transcripts belonged to neither high-confidence nor low-high-confidence gene models, 3138 (94%) have the coding potential score lower than 0.5 (Add-itional file2: Table S3).
Calculation of the similarity index of chromatin signatures between sub-genomes
To quantify the similarity of chromatin states between the collinear regions of sub-genomes, we calculated the Jaccard similarity index [56] of the 15 chromatin states for a pair-wise comparison between sub-genomes. The Jaccard similarity index was defined as A⋂B
A⋃B, where A is
the number of sequences in a certain chromatin state of
one sub-genome and B refers to the number of
se-quences in the corresponding state of another sub-genome.
Detection of transcription factor-binding motifs
To detect enriched transcription factor-binding motifs in the proximal promoter and enhancer-like regions, we first detected the proximal (3 kb upstream of the nearest TSS) and distal regions corresponding to state 5, which displayed typical epigenetic features corresponding to cis-regulatory elements, and are highly conserved across sub-genomes, thus accurately representing regulatory ac-tivities. A total of 46,834 proximal (promoter) and 23, 563 distal (enhancer-like) regions in state 5 were de-tected (Additional file 2: Table S4). For the subsequent motif analysis, we downloaded the position weight matrices of 501 plant motifs from the JASPAR database [57]. The motifs were then scanned against the regions detected using the Find Individual Motif Occurrences program [58] of the MEME software toolkit (version 5.0.2). The number of motifs in the promoter and enhancer-like regions was normalized against the total number of scanned regions.
Cloning
The minimal 35S promoter (−50 to−2 bp) derived from the CaMV 35S promoter was ligated into the pMY155 vector (from Dr. Lin Xu, SIPPE). The sequences of the predicted enhancer-like elements were amplified from the Chinese Spring genomic DNA (primers are listed in Add-itional file 2: Table S5) and were cloned into pMY155-mini35S. The pMY155-mini35S construct with or without the predicted enhancer-like elements were transferred into Agrobacterium tumefaciensstrain GV3101 cells.
Agroinfiltration ofNicotiana benthamianaleaves
Nicotiana benthamiana plants were grown in a green-house for 3–4 weeks before the agroinfiltration step. To suppress gene silencing, A. tumefaciens cells expressing the p19 protein of the tomato bushy stunt virus [59] were used in the co-infiltration procedure. Overnight cultures of A. tumefacienswere used to inoculate a 10-fold larger volume of fresh YEB liquid medium. The cells were cultured for another 4–6 h, pelleted, resuspended with infiltration buffer (10 mM MgCl2, 10 mM MES, pH 5.7, and 200μM acetosyringone), and incubated for an-other 2 h. A mixture ofA. tumefaciensstrains containing reporter plasmids and the p19 strain at an optical dens-ity (600 nm) ratio of 0.8:0.8 was prepared for the co-infiltration of the abaxial side of N. benthamiana leaves with a needleless syringe. A bioluminescence scan of at least three leaves was completed 2 days after the infiltra-tion. Experiments were repeated at least three times for each predicted enhancer-like element.
Dual luciferase assay
then incubated in darkness for 2 min. The biolumines-cence of whole leaves was visualized with the Image-Quant LAS 4000 system (GE Life Sciences) to record the photon emission over a 3-min interval. Image J soft-ware (version 1.52) was used to measure the luciferase signal and create image overlays. The dual luciferase assay was completed with the BioTek Synergy 2 micro-plate reader and the Dual-Luciferase Reporter Assay System (Promega) according to the manufacturer’s in-structions. The relative ratio of firefly luciferase: Renilla luciferase activities were calculated, and the average of three independent biological replicates was recorded for each plasmid.
Additional files
Additional file 1:Supplementary figures (DOCX 2144 kb)
Additional file 2:Supplementary tables (XLSX 15730 kb)
Additional file 3:Review history (DOCX 1422 kb)
Abbreviations
CGI:CpG island; ChIP-sequencing: Chromatin immunoprecipitation followed by high-throughput sequencing; DHS: DNase I-hypersensitive site; NB-LRR: Nucleotide-binding site leucine-rich repeat; PcG: Polycomb group; TE: Transposable element; TES: Transcription end site; TSS: Transcription start site
Acknowledgements
We thank Dr. Lin Xu from SIPPE for providing the pMY155-mini35S construct. We thank Liwen Bianji, Edanz Editing China (www.liwenbianji.cn/ac), for edit-ing the English text of a draft of this manuscript.
Review history
The review history is available at Additional file3.
Authors’contributions
YJZ, WLZ, YBX, and YPT. conceived and designed the experiments. ZJL, KDL, LHY, YLZ, and WT performed the experiments. MYW, YLX, JYG, XJR, and YJZ analyzed the data. YJZ. wrote the manuscript with input from all authors. All authors read and approved the final manuscript.
Funding
This study was supported by the Strategic Priority Research Program of the Chinese Academy of Sciences [XDA08020102 and XDB27010302], the National Natural Science Foundation of China [31571579 and 31770285], and the Fundamental Research Funds for the Central Universities (KYYJ201808).
Availability of data and materials
The ChIP-sequencing and RNA-sequencing data were deposited in the Gene Expression Omnibus database [60]. Tracks for all sequencing data, chromatin states can be visualized through our local genome browser (http://bioinfo. sibs.ac.cn/cs_epigenome). RNA-seq data for seven tissues of bread wheat, in-cluding root, spike, stem, grain, leaf, pistil, and stamen, were published previ-ously [61]. For demonstration of data reproducibility, both ChIP-seq data (H3K27me3, H3K4me3, H3K9ac, and H3K36me3) and whole-genome bisulfite sequencing data were compared with the data published recently [62].
Ethics approval and consent to participate
Not applicable
Consent for publication
Not applicable
Competing interests
The authors declare that they have no competing interests.
Author details
1National Key Laboratory of Plant Molecular Genetics, CAS Center for Excellence in Molecular Plant Sciences, Shanghai Institute of Plant Physiology and Ecology, Shanghai Institutes for Biological Sciences, Chinese Academy of Sciences, 300 Fenglin Road, Shanghai 200032, China.2University of the Chinese Academy of Sciences, Beijing 100049, China.3State Key Laboratory for Crop Genetics and Germplasm Enhancement, Jiangsu Collaborative Innovation Center for Modern Crop Production, Nanjing Agricultural University, No.1 Weigang, Nanjing 210095, Jiangsu, China.4Henan University, School of Life Science, Kaifeng 457000, Henan, China.5The State Key Laboratory of Plant Cell and Chromosome Engineering, Institute of Genetics and Developmental Biology, the Innovative Academy of Seed Design, Chinese Academy of Sciences, Beijing 100101, China.
Received: 8 May 2019 Accepted: 24 June 2019
References
1. International Wheat Genome Sequencing C, investigators IRp, Appels R, Eversole K, Feuillet C, Keller B, Rogers J, Stein N, investigators Iw-gap, Pozniak CJ, et al. Shifting the limits in wheat research and breeding using a fully annotated reference genome. Science. 2018;361:eaar7191.
2. Weber B, Zicola J, Oka R, Stam M. Plant enhancers: a call for discovery. Trends Plant Sci. 2016;21:974–87.
3. Ong CT, Corces VG. Enhancer function: new insights into the regulation of tissue-specific gene expression. Nat Rev Genet. 2011;12:283–93. 4. Heintzman ND, Stuart RK, Hon G, Fu Y, Ching CW, Hawkins RD, Barrera LO,
Van Calcar S, Qu C, Ching KA, et al. Distinct and predictive chromatin signatures of transcriptional promoters and enhancers in the human genome. Nat Genet. 2007;39:311–8.
5. Allis CD, Jenuwein T. The molecular hallmarks of epigenetic control. Nat Rev Genet. 2016;17:487–500.
6. Song L, Crawford GE. DNase-seq: a high-resolution technique for mapping active gene regulatory elements across the genome from mammalian cells. Cold Spring Harb Protoc. 2010;2010:pdb.prot5384.
7. Turner BM. Defining an epigenetic code. Nat Cell Biol. 2007;9:2–6. 8. Ernst J, Kheradpour P, Mikkelsen TS, Shoresh N, Ward LD, Epstein CB, Zhang
X, Wang L, Issner R, Coyne M, et al. Mapping and analysis of chromatin state dynamics in nine human cell types. Nature. 2011;473:43–9. 9. Xiao S, Xie D, Cao X, Yu P, Xing X, Chen CC, Musselman M, Xie M, West FD,
Lewin HA, et al. Comparative epigenomic annotation of regulatory DNA. Cell. 2012;149:1381–92.
10. Zhu B, Zhang W, Zhang T, Liu B, Jiang J. Genome-wide prediction and validation of intergenic enhancers in Arabidopsis using open chromatin signatures. Plant Cell. 2015;27:2415–26.
11. Zhang W, Zhang T, Wu Y, Jiang J. Genome-wide identification of regulatory DNA elements and protein-binding footprints using signatures of open chromatin in Arabidopsis. Plant Cell. 2012;24:2719–31.
12. Otto SP. The evolutionary consequences of polyploidy. Cell. 2007;131: 452–62.
13. Ramirez-Gonzalez RH, Borrill P, Lang D, Harrington SA, Brinton J, Venturini L, Davey M, Jacobs J, van Ex F, Pasha A, et al. The transcriptional landscape of polyploid wheat. Science. 2018;361:eaar6089.
14. Ding M, Chen ZJ. Epigenetic perspectives on the evolution and domestication of polyploid plant and crops. Curr Opin Plant Biol. 2018;42: 37–48.
15. Jackson S, Chen ZJ. Genomic and expression plasticity of polyploidy. Curr Opin Plant Biol. 2010;13:153–9.
16. Zhang X, Bernatavichute YV, Cokus S, Pellegrini M, Jacobsen SE. Genome-wide analysis of mono-, di- and trimethylation of histone H3 lysine 4 in Arabidopsis thaliana. Genome Biol. 2009;10:R62.
17. Zhang T, Cooper S, Brockdorff N. The interplay of histone modifications -writers that read. EMBO Rep. 2015;16:1467–81.
18. Wang X, Elling AA, Li X, Li N, Peng Z, He G, Sun H, Qi Y, Liu XS, Deng XW. Genome-wide and organ-specific landscapes of epigenetic modifications and their relationships to mRNA and small RNA transcriptomes in maize. Plant Cell. 2009;21:1053–69.
19. Mozgova I, Hennig L. The polycomb group protein regulatory network. Annu Rev Plant Biol. 2015;66:269–96.
21. Ernst J, Kellis M. ChromHMM: automating chromatin-state discovery and characterization. Nat Methods. 2012;9:215–6.
22. Oka R, Zicola J, Weber B, Anderson SN, Hodgman C, Gent JI, Wesselink JJ, Springer NM, Hoefsloot HCJ, Turck F, Stam M. Genome-wide mapping of transcriptional enhancer candidates using DNA and chromatin features in maize. Genome Biol. 2017;18:137.
23. Calo E, Wysocka J. Modification of enhancer chromatin: what, how, and why? Mol Cell. 2013;49:825–37.
24. Choy JS, Wei S, Lee JY, Tan S, Chu S, Lee TH. DNA methylation increases nucleosome compaction and rigidity. J Am Chem Soc. 2010;132:1782–3. 25. Bell JSK, Vertino PM. Orphan CpG islands define a novel class of highly
active enhancers. Epigenetics. 2017;12:449–64.
26. Deaton AM, Bird A. CpG islands and the regulation of transcription. Genes Dev. 2011;25:1010–22.
27. Du J, Johnson LM, Jacobsen SE, Patel DJ. DNA methylation pathways and their crosstalk with histone methylation. Nat Rev Mol Cell Biol. 2015;16:519–32. 28. Yanez-Cuna JO, Arnold CD, Stampfel G, Boryn LM, Gerlach D, Rath M, Stark
A. Dissection of thousands of cell type-specific enhancers identifies dinucleotide repeat motifs as general enhancer features. Genome Res. 2014; 24:1147–56.
29. Colbran LL, Chen L, Capra JA. Short DNA sequence patterns accurately identify broadly active human enhancers. BMC Genomics. 2017;18:536. 30. Ostrovsky O, Grushchenko-Polaq AH, Beider K, Mayorov M, Canaani J,
Shimoni A, Vlodavsky I, Nagler A. Identification of strong intron enhancer in the heparanase gene: effect of functional rs4693608 variant on HPSE enhancer activity in hematological and solid malignancies. Oncogenesis. 2018;7:51.
31. Brooks AR, Nagy BP, Taylor S, Simonet WS, Taylor JM, Levy-Wilson B. Sequences containing the second-intron enhancer are essential for transcription of the human apolipoprotein B gene in the livers of transgenic mice. Mol Cell Biol. 1994;14:2243–56.
32. Beck S, Rhee C, Song J, Lee BK, LeBlanc L, Cannon L, Kim J. Implications of CpG islands on chromosomal architectures and modes of global gene regulation. Nucleic Acids Res. 2018;46:4382–91.
33. Lu FL, Cui X, Zhang SB, Jenuwein T, Cao XF. Arabidopsis REF6 is a histone H3 lysine 27 demethylase. Nat Genet. 2011;43:715–U144.
34. Qi M, Li Z, Liu C, Hu W, Ye L, Xie Y, Zhuang Y, Zhao F, Teng W, Zheng Q, et al. CGT-seq: epigenome-guided de novo assembly of the core genome for divergent populations with large genome. Nucleic Acids Res. 2018;46:e107.
35. Zentner GE, Tesar PJ, Scacheri PC. Epigenetic signatures distinguish multiple classes of enhancers with distinct cellular functions. Genome Res. 2011;21: 1273–83.
36. Wang H, Liu C, Cheng J, Liu J, Zhang L, He C, Shen WH, Jin H, Xu L, Zhang Y. Arabidopsis flower and embryo developmental genes are repressed in seedlings by different combinations of Polycomb group proteins in association with distinct sets of cis-regulatory elements. PLoS Genet. 2016; 12:e1005771.
37. Parkhomchuk D, Borodina T, Amstislavskiy V, Banaru M, Hallen L, Krobitsch S, Lehrach H, Soldatov A. Transcriptome analysis by strand-specific sequencing of complementary DNA. Nucleic Acids Res. 2009;37:e123.
38. Bolger AM, Lohse M, Usadel B. Trimmomatic: a flexible trimmer for Illumina sequence data. Bioinformatics. 2014;30:2114–20.
39. Li H, Durbin R. Fast and accurate short read alignment with Burrows-Wheeler transform. Bioinformatics. 2009;25:1754–60.
40. Kim D, Langmead B, Salzberg SL. HISAT: a fast spliced aligner with low memory requirements. Nat Methods. 2015;12:357–60.
41. Zhang Y, Liu T, Meyer CA, Eeckhoute J, Johnson DS, Bernstein BE, Nusbaum C, Myers RM, Brown M, Li W, Liu XS. Model-based analysis of ChIP-Seq (MACS). Genome Biol. 2008;9:R137.
42. Liao Y, Smyth GK, Shi W. The subread aligner: fast, accurate and scalable read mapping by seed-and-vote. Nucleic Acids Res. 2013;41:e108. 43. Robinson JT, Thorvaldsdottir H, Winckler W, Guttman M, Lander ES, Getz G,
Mesirov JP. Integrative genomics viewer. Nat Biotechnol. 2011;29:24–6. 44. Krueger F, Andrews SR. Bismark: a flexible aligner and methylation caller for
Bisulfite-Seq applications. Bioinformatics. 2011;27:1571–2.
45. Emms DM, Kelly S. OrthoFinder: solving fundamental biases in whole genome comparisons dramatically improves orthogroup inference accuracy. Genome Biol. 2015;16:157.
46. Wu H, Caffo B, Jaffee HA, Irizarry RA, Feinberg AP. Redefining CpG islands using hidden Markov models. Biostatistics. 2010;11:499–514.
47. Kurtz S, Phillippy A, Delcher AL, Smoot M, Shumway M, Antonescu C, Salzberg SL. Versatile and open software for comparing large genomes. Genome Biol. 2004;5:R12.
48. Ling HQ, Ma B, Shi XL, Liu H, Dong LL, Sun H, Cao YH, Gao Q, Zheng SS, Li Y, et al. Genome sequence of the progenitor of wheat a subgenome Triticum urartu. Nature. 2018;557:424.
49. Zhao GY, Zou C, Li K, Wang K, Li TB, Gao LF, Zhang XX, Wang HJ, Yang ZJ, Liu X, et al. The Aegilops tauschii genome reveals multiple impacts of transposons. Nature Plants. 2017;3:946–55.
50. Avni R, Nave M, Barad O, Baruch K, Twardziok SO, Gundlach H, Hale I, Mascher M, Spannagl M, Wiebe K, et al. Wild emmer genome architecture and diversity elucidate wheat evolution and domestication. Science. 2017;357:93–6. 51. Anders S, Huber W. Differential expression analysis for sequence count data.
Genome Biol. 2010;11:R106.
52. Ernst J, Kellis M. Chromatin-state discovery and genome annotation with ChromHMM. Nat Protoc. 2017;12:2478–92.
53. TOAST and ROAST [http://www.bx.psu.edu/~cathy/toast-roast.tmp/ README.toast-roast.html]. 2008.
54. Hubisz MJ, Pollard KS, Siepel A. PHAST and RPHAST: phylogenetic analysis with space/time models. Brief Bioinform. 2011;12:41–51.
55. Kang YJ, Yang DC, Kong L, Hou M, Meng YQ, Wei L, Gao G. CPC2: a fast and accurate coding potential calculator based on sequence intrinsic features. Nucleic Acids Res. 2017;45:W12–6.
56. Levandowsky M, Winter D. Distance between Sets. Nature. 1971;234:34. 57. Khan A, Fornes O, Stigliani A, Gheorghe M, Castro-Mondragon JA, van der
Lee R, Bessy A, Cheneby J, Kulkarni SR, Tan G, et al. JASPAR 2018: update of the open-access database of transcription factor binding profiles and its web framework. Nucleic Acids Res. 2018;46:D1284.
58. Grant CE, Bailey TL, Noble WS. FIMO: scanning for occurrences of a given motif. Bioinformatics. 2011;27:1017–8.
59. Voinnet O, Rivas S, Mestre P, Baulcombe D. An enhanced transient expression system in plants based on suppression of gene silencing by the p19 protein of tomato bushy stunt virus. Plant J. 2003;33:949–56. 60. Li Z, Wang M, Lin K, Xie Y, Guo J, Ye L, Zhuang Y, Teng W, Ran X, Tong Y, et
al. The bread wheat epigenomic map reveals distinct chromatin architectural and evolutionary features of functional genetic elements data sets. Gene Expression Omnibus Database; 2019. https://www.ncbi.nlm.nih. gov/geo/query/acc.cgi?acc=GSE121903.
61. Grassroots Data Repository. https://opendata.earlham.ac.uk/wheat/under_ license/toronto/Ramirez-Gonzalez_etal_2018-06025-Transcriptome-Landscape/expvip/RefSeq_1.0/ByGene/ : DRP000768_tpm.tsv.gz,
SRP060670_tpm.tsv.gz, choulet_URGI_tpm.tsv.gz, and SRP038912_tpm.tsv.gz. 2018.
62. Ramirez-Gonzalez RH, Borrill P, Lang D, Harrington SA, Brinton J, Venturini L, Davey M, Jacobs J, van Ex F, Pasha A, et al: The transcriptional landscape of polyploid wheat. Data sets.Gene Expression Omnibus database..(2018). https://www.ncbi.nlm.nih.gov/sra/?term=SRP126222(ChIP-seq) &https:// www.ncbi.nlm.nih.gov/sra/?term=SRP133674(BS-seq).
Publisher’s Note