Technology (IJRASET)
Surface roughness model and parametric
optimization in end milling using carbide tools:
Response surface methodology and Taguchi
approach
R.Arokiadass1, D.Ommurugadhasan2, K.Saravanan3
Department of Mechanical Engineering
St.Anne’s College of Engineering and Technology, Panruti- 607 110, Tamilnadu, India.
Abstract—The surface roughness prediction model for the end milling of LM25 Al/SiCp metal matrix composite was investigated in
this study. This paper highlights the features of the development of a comprehensive mathematical model for correlating the interactive and higher-order influences of various machining parameters on the Surface roughness (Ra) through response surface methodology (RSM), utilizing relevant experimental data as obtained through experimentation. Experiments were conducted through the Taguchi’s Design of Experiments (DOE) in CNC milling machine using solid carbide end mill. The results indicate that the developed model is suitable for prediction of surface roughness in end milling of LM25 Al/SiCp metal matrix composites.
The effect of different parameters on surface roughness was analyzed. Optimal combination of these parameters can be used in order to achieve minimum surface roughness.
Keywords— Taguchi method, Metal Matrix Composite, Surface roughness, Response surface methodology, optimization.
I. INTRODUCTION
Metal matrix composites (MMC) are a relatively new class of materials characterized by lighter weight, greater strength and wear resistance than those of conventional materials. Due to their superior strength and stiffness, MMCs have good potential for application in the automotive and aerospace industries [1–3]. The machining of MMCs is very difficult due to the highly abrasive and intermittent nature of the reinforcements. Stir casting is the simplest and the most commercial technique. The development of MMCs by stir-casting technology has been one of the unique and feasible processes because of producing better matrix particle bonding, easier control of matrix structure, simplicity, higher production rate, and low cost [4]. It involves stirring the melt along with solid silicon carbide particles and then allowing the mixture to solidify. Due to the addition of reinforcing materials, which are normally harder and stiffer than matrix, machining becomes significantly more difficult than those of conventional materials [5].
LM 25 aluminum alloy reinforced with green bonded silicon carbide particles of size 25 µm with different volume fractions was used for experimentation. The machining experiments were conducted on the lathe using tungsten carbide tool inserts (K10). It was concluded that feed rate has the greater influence on surface roughness, followed by cutting speed and percent volume fraction of SiC [6].
High speed, low feed rate, and low depth of cut was recommended for achieving better surface finish during turning of Al/SiC-MMC using tungsten carbide insert [7]. Surface roughness increased due to increasing feed rate values. It was found that increase in particle ratio affects roughness negatively [8].
In this investigation, effects of process parameters on surface roughness in end milling of LM25 Al/SiCp metal matrix composites by
carbide tools are evaluated. A second order quadratic model is developed for predicting the surface roughness in end milling of LM25 Al/SiCp metal matrix composites by response surface methodology approach. The predicted and measured values are fairly close to
each other. Their proximity to each other indicates that the developed model can be effectively used to predict the surface roughness in end milling of LM25 Al/SiCp metal matrix composites.
Technology (IJRASET)
Response surface methodology is a collection of mathematical and statistical techniques useful for analyzing problems in which several independent variables influence a dependent variable or response and the goal is to optimize the response [9].
In many experimental conditions, it is possible to represent independent factors in quantitative form as given in equation (1). Then these factors can be regarded as having a functional relationship or response as follows
Y= f(x1, x2………xn) ± ε (1)
Between the response Y and x1,x2……xn of n quantitative factors, the function f is called the response surface or response function. The
residual ε measures the experimental errors. In applying the RSM, the independent variable was viewed as a surface to which a mathematical model is fitted. Representing the surface roughness (Ra), the response is a function of spindle speed (N), feed rate (f),
depth of cut (d) and %wt. of silicon carbide (S); it can be expressed as Ra =f {N, f, d, S} (2)
The second-order polynomial (regression) equation used to represent the response surface Y is given by Ra =b0+ΣbiXi+ΣbiiXi2+ΣbijXiXj (3)
and for four factors, the selected polynomial could be expressed as:
Ra=b0+b1N+b2f+b3d+b4S+b12Nf+b13Nd+b14NS+b23fd+b24fS+b34dS+b11N2 +b22f2+b33d2+b44S2 (4)
where b0 is the average of the responses, and b1, b2, b3….…b44 are regression coefficients [10] that depend on the respective linear,
interaction, and squared terms of factors.
III. EXPERIMENTAL DETAILS
The experiments were planned using Taguchi’s orthogonal array in the design of experiments (DoE), which helps in reducing the number of experiments. The four process parameters selected in the present investigation were spindle speed, feed rate, and depth of cut and various % wt. of silicon carbide (S). This needs 25 runs and has 24 degrees of freedom (DOFs). In the present experimental study, the material to be machined is LM25 Al alloy reinforced with SiCp particles, at a composition of 5%wt., 10%wt., 15%wt.,
20%wt. and 25%wt. and of 25 mm particle size. The dimensions of the specimens were of 100 mm × 50 mm × 40 mm. The composition of the LM25 Al alloy specimen is Si 7%; Mg 0.33%; Mn 0.3%; Fe 0.5%; Cu 0.1%; Ni 0.1% and Ti 0.2%.
Table.1 Experimental parameters and their levels
No Factor Levels
(-2) (-1) 0 (+1) (+2)
1 N,RPM 2000 2500 3000 3500 4000
2 F, mm/rev 0.02 0.03 0.04 0.05 0.06 3 d, mm 0.5 1 1.5 2 2.5 4 S, %wt. 5 10 15 20 25
The machining is done on HASS CNC milling machine. The tool used was carbide having diameter 12 mm and number of flutes: 4. The parameters and their levels were selected is given in the Table.1. The surface roughness (Ra) of the machined test specimens were measured using a Talysurf tester with a sampling length of 10mm.
IV. RESULTS AND DISCUSSION
Surface roughness plays a predominant role in determining the machining accuracy. The study of surface roughness characteristics of LM25 Al/SiCp MMC is more influenced by the process parameters. The influence of different process parameters in end milling of
LM25 Al/SiCp MMC can be studied by using response graph is shown in figure 1 and response table is shown in Table 2.
The observed surface roughness decreases at high spindle speed as compared to the low spindle speed. But surface roughness increases at high feed rate when compared to the low feed rate. The effect of depth of cut on end milling of LM25 Al/SiCp MMC is
Technology (IJRASET)
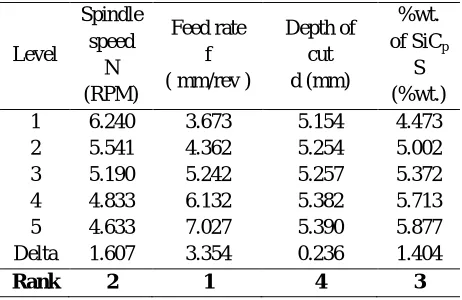
[image:4.612.191.422.287.437.2]The response table for surface roughness shows the effect of different process parameters, which is shown in Table. 2. From the table, it can be found that the feed rate is the main parameters which affect the surface roughness followed by spindle speed, %wt. of silicon carbide and depth of cut.
Table.2 Response table for surface roughness
Level Spindle speed N (RPM) Feed rate f ( mm/rev )
Depth of cut d (mm)
%wt. of SiCp
S (%wt.)
1 6.240 3.673 5.154 4.473
2 5.541 4.362 5.254 5.002
3 5.190 5.242 5.257 5.372
4 4.833 6.132 5.382 5.713
5 4.633 7.027 5.390 5.877
Delta 1.607 3.354 0.236 1.404
Rank 2 1 4 3
The experimental values are analyzed using response surface analysis and the following relation has been established for surface roughness (Ra) in un coded units as:
Ra=4.970-0.002N+57.236f+0.344d+0.131S+353.895f2-0.043d2-0.002S2- 0.003N×f+0.399f×S (5)
[image:4.612.187.432.556.647.2]A result of ANOVA for the response function surface roughness is presented in Table 3. This analysis is carried out for a level of significance of 5% i.e., for a level of confidence of 95%. From the table, it is apparent that, the F calculated value is greater than the F-table value (F0.05, 12, 12= 2.69) and hence the second order response function developed is quite adequate.
Table 3: ANOVA for the response function of the Ra
Source of variation DF
Sum of squares Mean sum of squares F value p value
Regression 12 50.6778 4.223146 687.70 0.000 Residual
Error 12 0.0737 0.006141 Total 24 50.7514
The plot of normal probability of the residual, the plots of the residuals versus the fitted values for surface roughness is shown in figure. 2 and 3 respectively. From figure 2, it is evident that the data are spread roughly along the straight line. Hence it is concluded that the data are normally distributed [11]. In addition, Fig. 3 revealed that there is no noticeable pattern or unusual structure present in the data. Hence, the RSM model developed is significant & adequate.
Technology (IJRASET)
[image:5.612.171.429.88.206.2]R2 = 99.85%
FIGURE 2: Normal Probability plot for surface roughness, Ra
FIGURE 3:Residual Vs fitted values for surface roughness, Ra
Figure 5 shows the experimental values and their corresponding predicted values through Eq. (5). From the analysis of figure, it can be observed that the predicted values were very close to the experimental results.
V. ANALYSIS FOR OPTIMIZATION OF THE RESPONSES
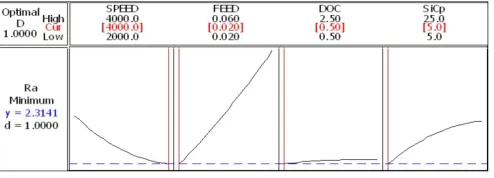
[image:5.612.176.436.240.386.2]The After building the regression model, a numerical optimization technique using desirability functions can be used to optimize the response. The objective of optimization is to find the best settings that minimize a particular response [12]. A desirability value, where 0 ≤ d ≤ 1. The value of d increases as the "desirability" of the corresponding response increases. The factor settings with maximum desirability are considered to be the optimal parameter conditions. Most of the standard statistical software packages (Minitab, Design, Expert, etc.) employ this popular technique for response optimization. In the present case, Minitab was used to optimize the response parameters. The optimization plot for surface roughness has been shown in figure. 4. It is revealed that highest desirability could be obtained at high spindle speed, low feed rate and low depth of cut and low percentage weight of silicon carbide. The goal was to minimize the surface roughness.
[image:5.612.186.433.583.672.2]Technology (IJRASET)
The upper value and target has been fixed at 8.748 and 3.040 μm, respectively. The parameter setting for achieving a surface
roughness as low as of 2.3141 μm has been predicted as spindle speed (N) 4000 rpm, feed rate (f) 0.020 mm/rev, depth of cut (d)
0.50 mm, and weight of silicon carbide (S) 5%. The desirability of optimization has been calculated as 1.0000, i.e., all the parameters are within their working range.
VI. CONCLUSIONS
The surface roughness in the end milling process has been measured for machining of LM25 Al/SiCp under different cutting
conditions with a carbide tools using Taguchi’s orthogonal array. Based on the experimental and analytical results the following conclusions are drawn.
A. The developed second-order response surface model can be used to calculate the surface roughness of the machined surfaces at different cutting conditions with the chosen range with 95% confidence intervals. Using such model, one can obtain remarkable savings in time and cost.
B. From the results, it can be asserted that moderate spindle speed, low feed rate, less %wt. of silicon carbide and moderate depth of cut are preferred for machining of LM25 Al/SiCp MMC.
C. The feed is the dominant parameter which affects the surface roughness of LM25 Al/SiCp MMC followed by spindle speed, %wt.
of silicon carbide. Depth of cut shows a minimal effect on surface roughness compared to other process parameters.
D. From the developed mathematical model, the optimal machining parametric combination, i.e., spindle speed (N) 4000 rpm, feed rate (f) 0.020 mm/rev, depth of cut (d) 0.50 mm, and weight of silicon carbide (S) 5% was found out to achieve the minimum Ra as 2.3141 m.
REFERENCES
[1] F.E. Kennedy, A.C. Balbahadur and D.S. Lashmore, “The friction and wear of Cu-based silicon carbide particulate metal matrix composites for brake applications”, Wear, vol. 203/204, pp. 715–721, 1997.
[2] A.Ravikiran and M.K,Surappa, “Effect of sliding speed on wear behavior of A356 Al 30 wt % SiCp MMC”, Wear, vol.206, pp. 33–38, 1997.
[3] J.E.Allision and G.S.Gole, “Metal-matrix composites in the automotive industry: opportunities and challenges”, J Min Met Mater Sci, vol.45 (1), pp. 19–24, 1993. [4] Y.Sahin and G.Sur, “The effect Al2 O3,TiN and Ti(C,N) based CVD coatings on tool wear in machining metal matrix composite”, Surface Coating Technology, vol.179, pp. 349–355, 2004.
[5] N.Tomac and K.Tonnessen, “Machinability of particulate aluminium matrix composites”, Annals CRIP, vol.42(1), pp. 55–58, 1992.
[6] K.Palanikumar and R.Karthikeyan “Assessment of factors influencing surface roughness on the machining of Al/SiC particulate composites”, Mater Des, vol.28, pp. 1584–1591, 2007.
[7] A.Manna and B.Bhattacharayya “Influence of machining parameters on the machinability of particulate reinforced Al/SiC- MMC”, Int J Adv Manuf Technol, vol.25, pp. 850–856, 2005.
[8] T.Ozben, E.Kilickap, and O.Cakir, “Investigation of mechanical and machinability properties of SiC particle reinforced Al-MMC”, J Mater Process Technol, vol.198, pp. 220–225, 2008.
[9] T.Ozel and A.Nadgir, “Prediction of flank wear by using back propagation neural network modeling when cutting hardened H-13 steel with chamfered and honed CBN tools,” J Machine Tools & Manufacture, vol. 42, pp. 287–297, 2002.
[10] K.G. Murti and S.Sunderesan, “Structure and properties of friction welds between high-speed steel and medium carbon steel for bimetal tools”, J Mater Sci Technol., vol. 2, pp. 865−870, 1986.
[11] S.Kumar, P.Kumar, and H.S.Shan, “Effect of evaporative pattern casting process parameters on the surface roughness of Al–7% Si alloy castings”, J Mater Processing Technol, vol.182, 615–623, 2007.