Technology (IJRASET)
Performance analysis of OADM based DWDM
System
Kajal Kiran1, Naveen Goyal2
1&2
Department of ECE, Bhai Gurdas Institute of Engineering & Technology, Sangrur
Abstract: The Dense Wavelength Division Multiplexing (DWDM) system based on Optical Add-Drop Multiplexer (OADM) is presented. The effect of Loss on Q factor and BER for different fiber lengths is analyzed. Also the effect of Bit Error rate (BER) with Channel Spacing and Data Rates for different channels is analyzed. The NRZ modulation format is used for the transmitting the signal for WDM system based on 4OADM.
Keywords: DWDM, OADM, BER, Q factor, Channel Spacing.
I. INTRODUCTION
OFDM system with OADM recently for optical-OFDM system and Monitoring and Compensation of Optical Telecommunication Channels [18].
II. SYSTEM SETUP
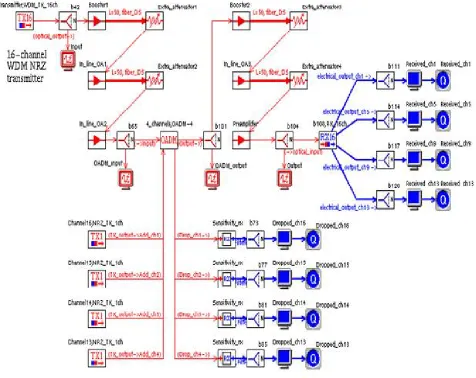
[image:3.612.70.546.226.604.2]Wavelength division multiplexing, which is used multiple channels to transmit a multiple signals over a single optical fiber, is designed in a Fig.1. Increasing the capacity of optical systems may require an increase in the bit rate, usage of WDM. Externally Modulated Subsystem simplifies the entire design process. From the beginning, the number of output ports should be entered, and then start inputting the Frequency values for each channel. The frequency values can be entered individually. An ideal Erbium Doped Fiber Amplifier is used, which is concerned with the values of Gain and Noise Figure. In this section, we design a 16-channel 40 Gb/s DWDM transmission system. The 16 x 40 Gb/s DWDM transmission system as designed is shown in Fig. 1. It consists of transmitter section, link section, 4 channel OADM and receiver section.
Fig. 1: 40 GB/s, 16 Channel WDM System
III. RESULTS & DISCUSSIONS A. Analysis of Effect of Loss on Q Factor and BER
Technology (IJRASET)
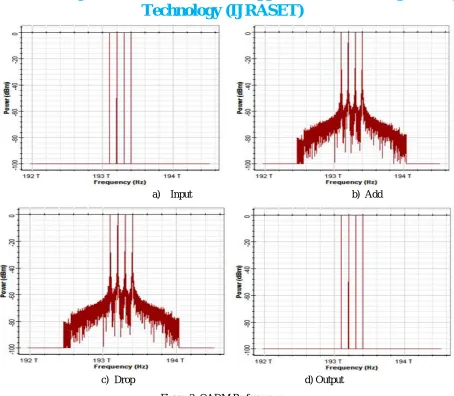
a) Input b) Add
[image:4.612.84.538.57.453.2]c) Drop d) Output
Figure 2: OADM Performance
Optical power meters are also inserted to check the power level measurement at transmitter and receiver side as shown in Figure 3.
Figure 3 (a): Power measurement at Transmitter
[image:4.612.106.503.483.695.2]Table 1: Variation of BER and Q factor with Loss for Different Lengths
Length 80km 200km 280km
Loss dB/km
Q Factor BER Q Factor BER Q Factor BER
0.10 20.7608 (db) 1.18621e-027 14.0043 (db) 3.647e-007 10.5152 (db) 0.000435189
0.15 19.9907 (db) 1.1062e-023 14.1223 (db) 1.796e-007 10.2611 (db) 0.00056028
0.20 20.7932 (db) 2.2579e-028 15.4924 (db) 2.484e-009 10.1696 (db) 0.000778691
[image:5.612.173.451.243.403.2]0.25 18.9432 (db) 2.07993e-018 14.0030 (db) 2.561e-007 10.2812 (db) 0.000217322
Table 1 discusses about the effect of loss on Q factor and BER with different optical fiber lengths. The loss is varied at the 0.10dB, 0.15dB, 0.20dB and 0.25 dB. The values of Q factor and BER have been taken at length 80km, 200km and 280km.
Figure 4: Performance analysis at different data rates and samples
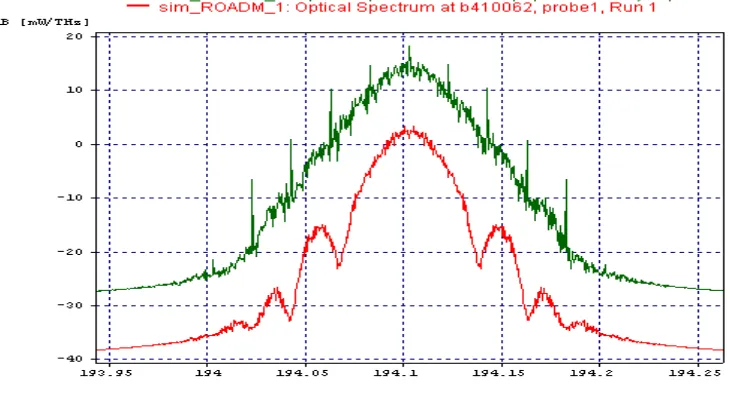
[image:5.612.149.514.495.694.2]Layout of DQPSK receiver is also explicitly simulated in order to obtain the in-phase (Eye_P) and Quadrature (Eye_Q) eye diagrams each having data rate of 20 Gbps and in total data transmitted rate is 40 Gbps and with different samples combinations varying from 4 to 22. Results showed in Fig. 4 explain the acceptable data rate of 40 Gbps with 20 samples. Power spectrum at the OADM input with different filter types is as shown in Fig. 5.
Technology (IJRASET)
B. Analysis of Effect of BER with Channel Spacing and Data Rates for DWDM System
[image:6.612.139.485.123.333.2]Bit error rate (BER) is the ratio between the number of bits received in error to the total number of bits received. In essence, BER is the probability of receiving a single bit in error. From the various results obtained the BER trend is studied for optimization.
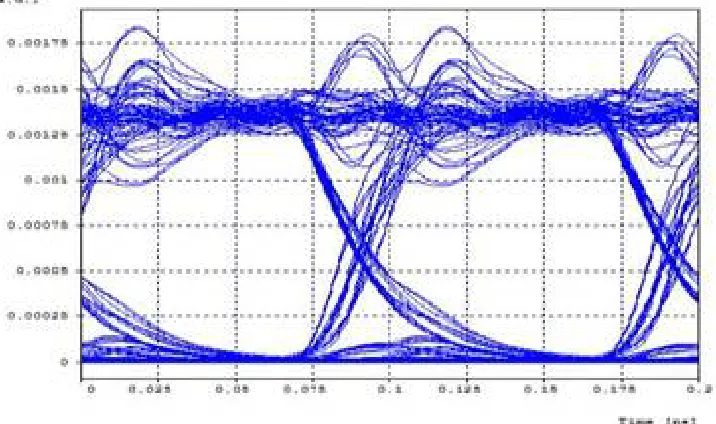
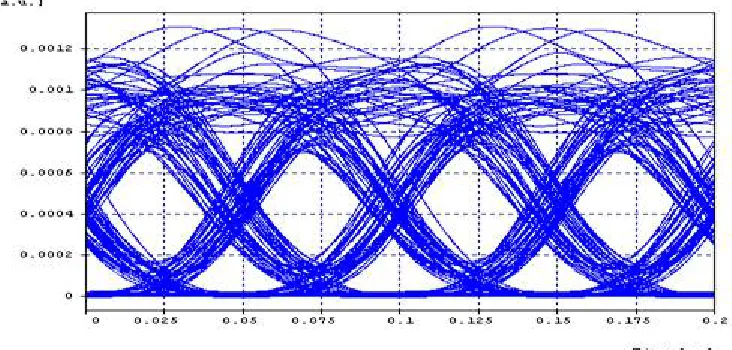
[image:6.612.130.488.404.616.2]Figure 6: Eye diagram for 30GHz, 10 Gb/s DWDM system
Fig. 6 shows the eye pattern obtained for a 16 channels DWDM system with the data rate of 10 Gb/s and channel spacing of 30 GHz having BER of 3.24e-003. The output of the system was analyzed in terms of BER by changing the number of channels from 16 to 32 and 64 channels. The analysis indicates that BER increases with number of channels.
Figure 7: Eye diagram for 50GHz, 10 Gb/s DWDM system
Figure 8: Eye diagram for 30GHz, 20 Gb/s DWDM system
Fig. 8 shows the eye pattern obtained for a 16 channels DWDM system with the data rate of 20 Gb/s and channel spacing of 30 GHz having BER of 1.12e-002. The output of the system was analyzed in terms of BER by changing the number of channels from 16 to 32 and 64 channels. As compared to Fig. 7 it is observed that as the data rate is increased from 10 to 20 Gb/s, BER also increases.
Figure 9: Eye diagram for 50GHz, 20 Gb/s DWDM system
[image:7.612.64.547.590.691.2]Fig. 9 shows the eye diagram obtained for a 16 channels DWDM system having 50 GHz channel spacing and a data rate of 20 GB/s. A typical value of BER obtained is 1.58e-025. The output of the system was analyzed in terms of BER by changing the number of channels from 16 to 32 and 64 channels. Comparing with Fig. 8, it is observed that BER becomes very small when we increase the channel spacing from 30 to 50 GHz. All the results of BER obtained from different setups are summarized in Table 2 below:
Table 2: BER trends for DWDM System with different data Rates and Channel Spacing
Data Rates Gb/s
30 GHz Channel Spacing 50 GHz Channel Spacing
16 Channels 32 Channels 64
Channels 16 Channels
32 Channels
64 Channels
10 Gb/s 3.24e-003 4.43e-003 5.53e-003 1.08e-029 3.32e-027 9.35e-011
20 Gb/s 1.12e-002 7.88e-003 1.87e-002 1.58e-025 2.76e-018 1.85e-012
Technology (IJRASET)
system with optimized capacity, it was observed that for applications requiring high speed communication and more number of users like 64, a DWDM system with 50 GHz channel spacing proved to give better performance.
IV. CONCLUSIONS
The performance of the system has been analyzed over different lengths of fiber. The effect of loss on Q factor and BER for different optical links length is examined. The variation of BER and Q factor with loss is calculated at lengths 80km, 200km and 280km. The performance of the 16 channel WDM system based on OADM has been evaluated by varying loss and optical links length. Also the effect of Bit Error rate (BER) with Channel Spacing and Data Rates for different channels is analyzed. It has analyzed the value of Q factor decreases with the increases in length. The OADM system gives the lowest BER for the long transmission.
REFERENCES
[1] Kurtzke, “Suppression of fiber nonlinearities by appropriate dispersion management,” IEEE Photonics Technology Letters Vol. 5, pp. 1250-1253, 1993. [2] X. Liu, X. Wei, R. E. Slusher and C. J. Mckinstrie, “Improving transmission performance in differential phase-shift-keyed systems by use of lumped nonlinear
phase-shift compensation,” Optics Letters, Vol. 27, pp. 1616-1618, 2002.
[3] K. Wang, A. Nirmalathas, C. Lim and E. Skafidas, “Impact of Crosstalk on Indoor WDM Optical Wireless Communication Systems,” IEEE Photonics Journal, Vol. 4, No. 2, pp. 375-386, 2012.
[4] M. Eiselt, L. D. Garett, and R. W. Tkach, “Experimental comparison of WDM system capacity in conventional and nonzero dispersion shifted fiber,” IEEE Photonics Technology Letters, Vol. 11, pp. 281–283, 2012.
[5] K. Nakajima, M. Ohashi, K. Shiraki, T. Horiguchi, K. Kurokawa and Y. Miyajima, “Four-wave mixing suppression effect of dispersion distributed fibers,” IEEE Journal of Lightwave Technology, Vol. 17, No. 10, pp. 1814–1822, 2009.
[6] R. W. Tkach, A. R. Chraplyvy, F. Forghieri, A. H. Gnauck and R. M. Derosier, “Four-photon mixing and high-speed WDM systems,” IEEE Journal of Lightwave Technology, Vol. 13, No. 5, pp. 841–849, 2013.
[7] A. R. Borsali, H. A. Badaoui, M. Aichi and W. Aichi, “Effect of channel wavelength spacing for WDM system on the quality of the transmission,” International Journal of Computer Science Issues, Vol. 9, No. 2, pp. 441-443, 2013.
[8] M. Ilyas and H. T. Mouftah, “The Handbook of Optical communication network,” CRC press LLC, 2003.
[9] M. Arshad and M. A. Ansari, “Performance Analysis of Dispersed Manage RZ pulse,” International Journal of Scientific and Research Publications, Vol. 3, No. 12, pp. 1-3, 2013.
[10] M. I. Hayee and A. E. Willner, “NRZ Versus RZ in 10–40-Gb/s Dispersion-Managed WDM Transmission Systems,” IEEE Photonics Technology Letters, Vol. 11, No. 8, pp. 991-993, 2014.
[11] D. Marcuse, A. R. Chraplyvy and R. W. Tkach, “Dependence of cross phase modulation on channel number in fiber WDM systems,” IEEE Journal of Lightwave Technology, Vol. 12, pp. 885–890, 2004.
[12] A. Phogat, T. Gulati and D. Malik, “Q-Factor and Jitter performance in WDM systems using RZ, NRZ and Duo binary modulation formats at different distances”, International Journal of Latest Trends in Engineering and Technology, Vol. 2, No. 4, pp. 30-34, 2013.
[13] M. I. Hayee and A. E. Willner, “NRZ versus RZ in 10-40-Gb/s dispersion-managed WDM transmission systems,” IEEE Photonics Technology Letters, Vol. 11, No. 8, pp. 991-993, 1999.
[14] H. Sunnerud, M. Karlsson and P. A. Andrekson, “A comparison between NRZ and RZ data formats with respect to PMD-induced system degradations,” IEEE Photonics Technology Letters, Vol. 13, No. 5, pp. 448–450, 2001.
[15] N. S. Bergano, “Wavelength division multiplexing in long-haul transoceanic transmission systems,” IEEE Journal of Lightwave Technology, Vol. 23, No. 12, pp. 4125–4139, 2005.
[16] L. Eldada, “ROADM architectures and technologies for agile optical networks,” In Proceeding SPIE, 2007.
[17] L. Eldada, J. Fujita, A. Radojevic, T. Izuhara, R. Gerhardt, J. Shi, D. Pant, F. Wang, A. Malek, “40-channel ultra-low-power compact PLC-based ROADM subsystem,” In Proceeding OFC/NFOEC, 2006.