Demonstration of Duty Cycle Division Multiplexing
with Bit Error Rate Estimation
S. M. Basir
#1, G. A. Mahdiraji
*2, A. Malekmohammadi
#3, N. H. Ibrahim
#4, A. F. Abas
#5,
M. K. Abdullah
##6 #Photonic and Fiber Optic Systems Laboratory, Centre of Excellence for Wireless and Photonic Networks,Engineering & Technology Complex, University Putra Malaysia, 43400 Serdang, Malaysia 1 [email protected] 3 [email protected] 4 [email protected] 5 [email protected]
*Faculty of Engineering, Architecture and Built Environment, School of Engineering, UCSI University, Kuala Lumbur Campus, 56000 Cheras, Malaysia.
2
##Significant Technologies Sdn. Bhd. 43400 Serdang, Selangor, Malaysia
6
Abstract— Experimental demonstration of Duty Cycle Division Multiplexing (DCDM) is reported which validates the potential implementation of the system in communication field. We also presented the operation of bit error rate (BER) estimation algorithm, which is specially derived for DCDM. With the increase of link attenuation, the signal amplitude decreased and the pulses are distorted. BER estimation on the received signal was performed and measured against transmission distance of 100 meter until 400 meter copper wire. It is shown that the channel with the largest duty-cycle value shows the best performance. The experimental eye diagrams at several distances are also demonstrated and compared against their back-to-back counterpart.
Keywords
—
multiplexing, optical communicationI. INTRODUCTION
In telecommunication system, to increase the network capacity and transmission medium utilization, multiple analog signals, data or channels can be combined together by a process known as multiplexing. Common predominant multiplexing techniques are Time Division Multiplexing (TDM) [1]-[2], and Frequency Division Multiplexing (FDM) [3]. The introduction of Wavelength Division Multiplexing (WDM) [6] and Polarization Division Multiplexing (PolDM) [7] in optical fiber communication systems have increased the network capacity.
Realizing the need of cost effective design for higher data rate transmission, Duty Cycle Division Multiplexing (DCDM) was introduced as a new multiplexing and demultiplexing technique that uses duty cycles to differentiate the channels [11,12]. Using this technique, it was proven by theoretical studies and simulations that the utilization of Wavelength Division Multiplexing (WDM) channel capacity can be increased significantly [12]-[13]. As PolDM can only
Simulation studies have also shown that DCDM can contribute towards narrower spectral width, which results in better tolerance to chromatic dispersion [13]. However, to date, there is no experimental work reported verifying the concept. Therefore, it is the interest of this paper to experimentally demonstrate the DCDM working principle and its Bit-Error-Rate (BER) estimation algorithm. This paper focuses on the demultiplexing part, which is more critical than the multiplexing process. By using multiplexed DCDM signal that is generated at the transmitter, the demultiplexing concept is experimentally validated by processing the received signal based on the DCDM demultiplexing rules. For performance evaluation, we experimentally perform the BER estimation on the received signal, which is reported for the first time to our knowledge.
II. WORKING PRINCIPLE
DCDM multiplexing and demultiplexing concepts are based on duty-cycle values, which allow more than two channels to be multiplexed in a WDM channel. The value of the duty-cycle for each user can be assigned in various ways. In this paper uniform distribution is used, mainly due to its simplicity.
The duration for ith user Ti is defined as
⎟
⎠
⎞
⎜
⎝
⎛
+
×
=
1
n
T
i
T
si (1)
where n represents the number of multiplexed users and Tsis
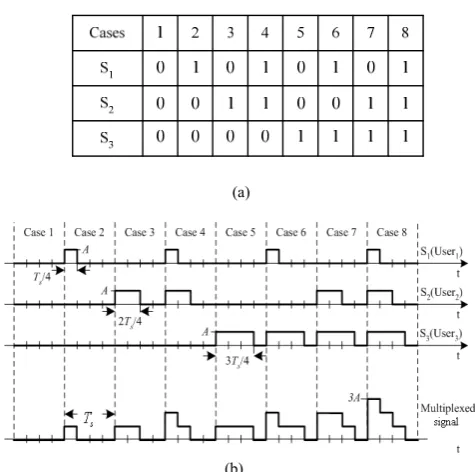
the clock period. Fig. 1(a) shows 2n possible combinations of
bits for n users. In this paper, in order to demonstrate the
feasibility of multiplexing more than two channels with lowest complexity, we focus on 3-user system where there are 8
third user uses duration of
T
s/
4
,2
T
s/
4
and3
T
s/
4
respectively to transmit bit 1s. This means User1 (S1), User2 (S2), and User3 (S3) uses 25%, 50%, and 75% of duty-cycle respectively, which are multiplexed together as shown in Fig. 1 (b). For 3-user DCDM system, the multilevel multiplexed signal has four slots within one pulse duration. If one sample per slot is taken, the 1st sample (taken from the first slot), has
n + 1 possible levels, the second sample (taken from the
second slot), has n possible levels, and the nth sample (taken
from the nth slot) has only 2 possible levels (0 or A).
At the receiver side, the original data for each user can be demultiplexed and recovered by taking 1 sample per slot (except for the last slot which is considered as the guard band for transition purposes between two consecutive waveforms). The rules shown in Table I are used for channel demultiplexing. Each multiplexed signal in Fig. 2 is sampled at three sampling points sp1, sp2, and sp3. The amplitude at each sampling point is compared against three threshold
values of thr1, thr2 and thr3 as shown in Fig. 2.There are 6, 4
and 2 rules for S1, S2, and S3 respectively as shown in Table I. As an example, for the first rule for S1, when both amplitudes at sampling point 1 (sp1) and sampling point 2 (sp2) are less than thr1, S1 is equal to 0, which is for Case 1. All rules for S1 follow the values sp1, sp2, thr1, thr2, and thr3 as shown in Fig. 2 for the decision making. For S2, the decision for 8 cases is made based on the sp2, sp3, thr1, and thr2. Finally, for S3 when sp3 is less than thr1, the regenerated amplitude is 0, which is represented by Cases 1, 2, 3, and 4. If the amplitude at sp3 is more than thr1, the regenerated amplitude is 1, which is for Cases 5, 6, 7, and 8.
(a)
(b)
[image:2.595.308.546.38.157.2]Fig. 1 (a) 8 possible combination of bits for 3-user DCDM system, and (b) Multiplexed signal
Fig. 2 Sampling points and threshold values for S1, S2, and S3 for DCDM
Recovery Rules
TABLE I DCDM RECOVERY RULES
III. EXPERIMENTAL SETUP
[image:2.595.54.292.416.652.2]Fig. 3. Experiment setup for DCDM system. (a) Experimental setup for 3-user of DCDM system. (b) Table for Microcontroller A. (c) DCDM signal for case 7. (d) Sampling process for Microcontroller C.
Based on Fig. 3(b), whenever the clock is in high state (rising edge), the bit-stream is generated by the Microcontroller A. The signals are then sent to the Microcontroller B to generate the DCDM multiplexed signal. For example, when the Microcontroller B reads Case 7 from the Microcontroller A, it will generate a step-down shape
signal as shown in Fig. 3(c). The signal is thenpassed through
the Digital-Analog-Converter (DAC) and a current-to-voltage converter. After this stage the generated 3 bits per symbol signal is ready for transmission. The signal is first transmitted in back-to-back setup and then through a copper wire of 100 meter until 400 meter with 0.033 dB loss per meter. In this setup the baseband signal is not modulated onto any carrier. At the receiver, the Microcontroller C samples each received signal at three sampling points which are sp1, sp2 and sp3. Each sampling point is compared with the three threshold values. The three threshold values which are thr1, thr2, and thr3 are determined as shown in Fig. 3(d).The DCDM signal is then recovered using DCDM recovery rules [12]. The recovered signals experience 1-bit delay due to the processing time, which in our case is 1 ms.
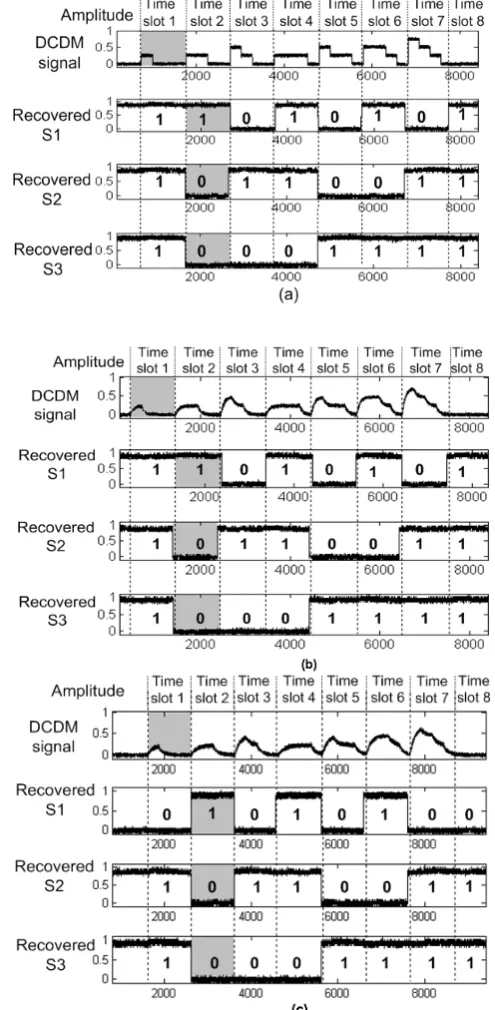
IV. RESULTS AND DISCUSSION
Fig. 4(a) shows the data quality in back-to-back transmission line. Figs. 4(b) and (c) show the DCDM signal and recovered bit-stream after copper wire of 200 meter and 300 meter with 6.6 dB and 9.9 dB loss respectively. Comparing between Figs. 4(a), (b), and (c), the amplitude of the DCDM signal is distorted after the transmission line. The distortion increases with the attenuation.
Fig. 4 Transmission and recovered data stream in back-to-back and after transmission line. (a) Back-to-back transmission. (b) 6.6 dB loss after transmission line. (c) 9.9 dB loss after transmission line.
[image:3.595.303.551.40.546.2]erroneously recovered. This error occurred after the amplitude of DCDM signal decreases, which made the signal and noise indistinguishable by the recovery circuit. Nevertheless, these results validate the concept of DCDM as the signal experienced attenuation and noise; the original signal can still be recovered. Although previous simulation work on DCDM focused on high speed of transmission, for this paper, the purpose is only to validate the DCDM demultiplexing concept. By having low transmission bitrate, the focus can be fully given to the problems in demultiplexing concept and algorithm rather than transmission impairments.
Bit error rate (BER) of 3-user DCDM system performance is showed in Fig. 5. The performance of different users is compared based on BER. Peu1, Peu2, and Peu3 which are probability error rate of S1, S2, and S3 respectively increased over several distance. The BER is calculated based on probability of error method using eye diagram which
discussed in [12]. Peu1 is greater than Peu2 and Peu3 which
increases over longer distance. This is because with lowest
pulse width, Peu1 gives the lowest delay which affected the
performance. It is clear that S3 gives the better performance
than S1 and S2 with its wider pulse width. Due to limited
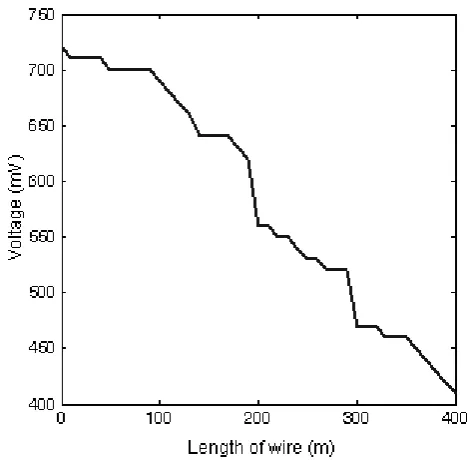
number of bits, the best BER is only as good as 10-2. Fig. 6
shows that voltage at the receiver is reduced against longer transmission line. In this experiment, the received DCDM signal of 500 mV and above can be fully recovered. DCDM signal that lower than 500mV will experienced invalid recovered bit-stream for 300 meter copper wire as shown in Fig. 4(c).
[image:4.595.311.545.35.265.2]Fig. 5: BER vs. distance
Fig. 6: Received voltage vs. Length
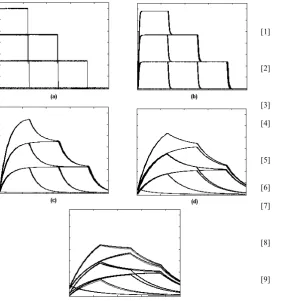
[image:4.595.47.283.380.596.2]Fig. 7 Eye diagram of DCDM signal in (a) back-to-back and after transmission line of (b) 100 meter (c) 200 meter (d) 300 meter, and (e) 400 meter
V. CONCLUSIONS
Demonstration of DCDM system with bit error rate estimation is reported. This experiment shows the feasibility of implementing DCDM as alternative solution to increase optical fiber capacity utilization. Even though this small scale experiment is performed at 1 kb/s, our aim to experimentally validate the concept of DCDM and its BER estimation algorithm was successfully achieved. This experiment is significant as the first experimental trial of DCDM system.
REFERENCES
[1] G. Schopflin, C. J. Weiske, E. Mullner, F. A. Znidarsic, U. A. Fischer, K. A. Kotten, J. A. Wildmoser, and J. A. Krapfl, “Realization of a commercial 10 Gbit/s TDM transmission system,” in Communication Technology Proc. ICCT’96 , 1996, paper 1, p. 79-82.
[2] W. S. Lee, D. Garthe, G. A. Pettitt, and A. A. Hadjifotiou, "40-Gbit/s TDM transmission over 160 km (2x80 km) of standard nondispersion-shifted fiber," in Optical Fiber Communication. OFC’07, 1997, p. 244-245.
[3] P. Bergmans and T. Cover, "Cooperative broadcasting," IEEE Transactions onInformation Theory, pp. 317-324, 1974.
[4] S. A. Aljunid, M. Ismail, A. R. Ramli, B. M. Ali, and M. K. Abdullah, "A new family of optical code sequences for spectral-amplitude-coding optical CDMA systems," Photonics Technology Letters, pp.2383-2385, 2004.
[5] J. A. Salehi and C. A. Brackett, "Code division multiple-access techniques in optical fiber networks. II. Systems performance analysis," IEEE Transactions onCommunications, pp. 834-842, 1989... [6] G.E. Keiser, “A review of WDM technology and applications,” Optical
Fiber Technology, pp. 3-39, 1999.
[7] S. L. Jansen, I. Morita, and H. Tanaka, "10x121.9-Gb/s PDM-OFDM Transmission with 2-b/s/Hz Spectral Efficiency over 1,000 km of SSMF," in National Fiber Optic Engineers Conference, OSA Technical Digest (CD) (Optical Society of America), p. PDP2, 2008. [8] Yu, Jianjun; Huang, Ming-Fang; Chang, Gee-Kung, “Polarization
insensitive wavelength conversion for 4×112Gbit/s polarization multiplexing RZ-QPSK signals”,Opt. Express, vol. 16, p. 21161-21169 (2008).
[9] Nakamura, Moriya; Kamio, Yukiyoshi; Miyazaki, Tetsuya, “Linewidth-tolerant 10-Gbit/s 16-QAM transmission using a pilot-carrier based phase-noise cancelling technique,”Opt. Express, vol. 16, pp. 10611-10616, 2008.
[10] A.H. Gnauck, G. Charlet, P. Tran, P.J. Winzer, C.R. Doerr, J.C. Centanni, E.C. Burrows, T. Kawanishi, T. Sakamoto, and K. Higuma, “25.6-Tb/s WDM Transmission of Polarization-Multiplexed RZ-DQPSK Signals,” J. Lightwave Technology, vol. 26, no. 1, pp. 79-84, 2008.
[11] M. K. Abdullah, M. F. Abdalla, A.F. Abas, G. Amouzad, “Duty-cycle Division Multiplexing (DCDM): A Novel and Economical Optical Multiplexing and Electrical Demultipexing technique for High Speed Fiber Optics Networks,” in Wireless and Optical Communications Networks, WOCN, 2007, p. 1-4 .
[12] G. A. Mahdiraji, A. M. Mohammadi, A. F. Abas, M. K. Abdullah, M. Mokhtar,” A Novel Economical Duty Cycle Division Multiplexing with Electrical Multiplexer and Demultiplexer for Optical Communication Systems,” in International Conference on Electronic Design, ICED, 2008, p. 1-5.
[13] G. A. Mahdiraji, A. F. Abas, M. K. Abdullah, A. M. Mohammadi, and M. Mokhtar, "Duty-Cycle-Division-Multiplexing (DCDM): Towards the Largest Network Capacity,” in Proc. of International Topical Meeting on Information Photonics ,paper 3-P9, pp. 158-159 ,2008.. [14] L. Chen, Q. Zhu, and S. Xu, “Delay lines based on left-handed