biij
Biomedical Imaging and Intervention JournalORIGINAL ARTICLE
Optimising the scan delay for arterial phase imaging of the
liver using the bolus tracking technique
Chan RS*, Kumar G, Abdullah BJJ, Ng KH, Vijayananthan A, Mohd. Nor H,
Liew YW
Department of Biomedical Imaging, Faculty of Medicine, University of Malaya, Kuala Lumpur, Malaysia
Received 12 September 2010; received in revised form 6 January 2011; accepted 7 January 2011
ABSTRACT
Objective: To optimize the delay time before the initiation of arterial phase scan in the detection of focal liver lesions in contrast enhanced 5 phase liver CT using the bolus tracking technique.
Patients and Methods: Delay - the interval between threshold enhancement of 100 hounsfield unit (HU) in the abdominal aorta and commencement of the first arterial phase scan. Using a 16 slice CT scanner, a plain CT of the liver was done followed by an intravenous bolus of 120 ml nonionic iodinated contrast media (370 mg I/ml) at the rate of 4 mL/s. The second phase scan started immediately after the first phase scan. The portal venous and delay phases were obtained at a fixed delay of 60 s and 90 s from the beginning of contrast injection. Contrast enhancement index (CEI) and subjective visual conspicuity scores for each lesion were compared among the three groups.
Results: 84 lesions (11 hepatocellular carcinomas, 17 hemangiomas, 39 other hypervascular lesions and 45 cysts) were evaluated. CEI for hepatocellular carcinomas appears to be higher during the first arterial phase in the 6 seconds delay group. No significant difference in CEI and mean conspicuity scores among the three groups for hemangioma, other hypervascular lesions and cysts.
Conclusion: The conspicuity of hepatocellular carcinomas appeared better during the early arterial phase using a bolus tracking technique with a scan delay of 6 seconds from the 100 HU threshold in the abdominal aorta. © 2011 Biomedical Imaging and Intervention Journal. All rights reserved.
Keywords: Arterial phase imaging of the liver, bolus tracking technique
INTRODUCTION
Multiphase CT improves the sensitivity of liver lesions detection. MRI, despite being recognised to be superior in characterising focal liver lesions, remains a secondary tool due to limited resources in most centres in Malaysia.
Approximately 30% of focal liver lesions are hypervascular and detectable exclusively on the arterial phases [1,2]. The early arterial phase of liver CT provides the best enhancement of hepatic arterial vessels and arterial-portal venous shunts [3]. Hypovascular liver metastases are most conspicuous on the portal venous phase [4,5]. Optimising the scan delay for the arterial phases is, therefore, important to improve the detection of hypervascular liver lesions.
* Corresponding author. Address: Department of Biomedical Imaging, Faculty of Medicine, University of Malaya, 50603 Kuala Lumpur, Malaysia. E-mail: [email protected] (Ruoh Shyuan Chan).
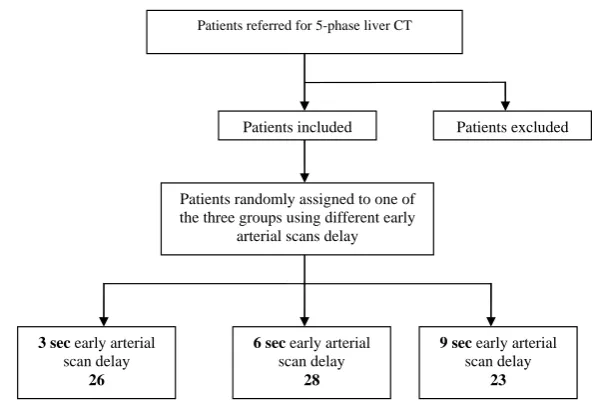
Patients referred for 5-phase liver CT
Patients excluded
3 sec early arterial scan delay
26
6 sec early arterial scan delay
28
9 sec early arterial scan delay
23
Patients randomly assigned to one of the three groups using different early
[image:2.595.145.443.83.288.2]arterial scans delay Patients included
Figure 1 Study design.
of hepatocellular carcinoma (HCC) [1,6]. Foley et al. and Francis et al. found that hypervascular hepatic tumours are best enhanced on the late arterial phase with 24.5 to 35 seconds delay from the initiation of contrast injection [7,8]. Murakami et al., however, recommended double arterial phase scan to improve the detection of hypervascular HCCs [9].
Other than the scan delay, the conspicuity of liver lesions are also affected by the lesion’s size, the patient’s body weight, cardiac output, blood pressure and pulse rate, the contrast volume, concentration and injection rate, and the scan parameters. This study aims to optimise the scan delay of contrast-enhanced 5-phase CT of the liver using a 16-slice MDCT and a bolus tracking technique to improve the detection of hypervascular liver lesions.
PATIENTS AND METHODS
This is a prospective study with approval from the ethical review committee, evaluating all patients who underwent 5-phase CT of the liver from February to October 2008 for suspected space occupying liver lesion based on clinical, laboratory or ultrasound findings.
The inclusion criteria were: age above 15 years, serum creatinine of less than 1.5 mg/dL and no contraindications to iodinated contrast material. Patients were excluded based on several criteria which may affect liver vascularity, i.e. patients with diffuse liver lesions or lesion larger than 15 cm in diameter; previous radiofrequency ablation (RFA), transarterial chemoembolisation (TACE), percutaneous transhepatic cholangiography (PTC) or transjugular intrahepatic portosystemic shunt (TIPS); portal venous thrombosis, portal hypertension, hepatic venous thrombosis, inferior vena caval thrombosis or hepatic arterial portal shunt; technical failure related to contrast medium injection, breath-holding or machine problem during CT examination.
All patients fasted for at least 6 hours prior to the CT examination. Contraindications to contrast injection were ruled out. Written informed consent was obtained. Patients were given 500 ml of plain water as oral contrast. An 18G branula was placed at the patients' antecubital vein.
The study was performed using a GE Lightspeed 16-MDCT scanner (Milwaukee, Wisconsin, USA) at the following settings: rotation time, 0.5 second; beam collimation, 16 × 0.625 mm; section thickness and intervals, 5.0 mm; pitch ratio, 1.375:1; table speed 13.75 mm/s; scan time, 0.5 s, gantry tilt, 0.0; voltage, 120 kVp; and tube current, 300 mAs. A bolus-tracking technique with automated scan-triggering software (SmartPrep, GE Healthcare) was used. A circular region of interest (ROI) was placed within the abdominal aorta just above the celiac axis level. The threshold CT value was preset at 100 HU. One of the three protocols with a scan delay of 3 seconds, 6 seconds or 9 seconds (from the time when threshold enhancement was detected to the beginning of the early arterial phase scan) was pre-selected for each patient randomly prior to the examination.
Trigger Point (threshold value 100HU)
Fixed scanner delay time 2nd Phase scan
3rd Phase scan start immediately after
4th Phase scan
5th Phase scan
3s 3-9s Start of contrast material injection 1st Phase scan
60s
90s
Commence of bolus tracking in abdominal aorta above celiac axis level
[image:3.595.132.480.83.456.2]13s
Figure 2 The CT protocols for the 3 patient groups using the bolus tracking method with the scan delays of 3s, 6s and 9s.
Patients were instructed to hold their breath in full inspiration during each scan phase (Figure 2).
Post-processing images were reconstructed into a 34–50 cm display FOV depending on the patients’ physique, at 1.250 cm sections and a window of 400:40 HU. Image analysis was performed at a single workstation (Advantage Window 4.2, GE Healthcare) on an LCD monitor with a spatial resolution of 1280 × 1024 pixels (Radiforce R22, Eizo).
IMAGE ANALYSIS
The conspicuity of each liver lesion was evaluated quantitatively and qualitatively on each scan phase. In patients with more than three lesions, the largest three lesions were assessed.
Quantitative image analysis
The attenuation of lesion was measured with a circular region of interest (ROI) by a radiologist who was blinded to the scan protocols, without changing the preset window (400:40 HU), with an attempt to maintain
an ROI area of 50 mm2 at the centre or the most homogenously enhancing part of the lesion and with care to avoid regions of rim enhancement, tumour capsule, necrosis, calcifications or vessels. The attenuation of the background liver parenchyma was measured in two areas adjacent to the lesion and averaged, using a constant ROI area of 200 mm2, at least 1 cm away from the edge of the lesion to nullify the risk of encountering fibrosis [19], excluding visible vessels, bile ducts and artefacts. The conspicuity of a lesion was expressed using the Contrast Enhancement Index (CI):
Lesion attenuation Average background liver parenchymal attenuation CI
Average background liver parenchymal attenuation
− =
Qualitative image analysis
Figure 3 Reference Images for grading visual conspicuityof lesions. Non-visualised lesions were graded 1; A poorly visualised lesion of grade 2 conspicuity (A); An adequately visualised lesion with poor margin delineation of grade 3 conspicuity (B); A lesion of grade 4 conspicuity with good delineation of almost the entire margin (C); A lesion of grade 5 conspicuity with clear demarcation of the entire margin (D).
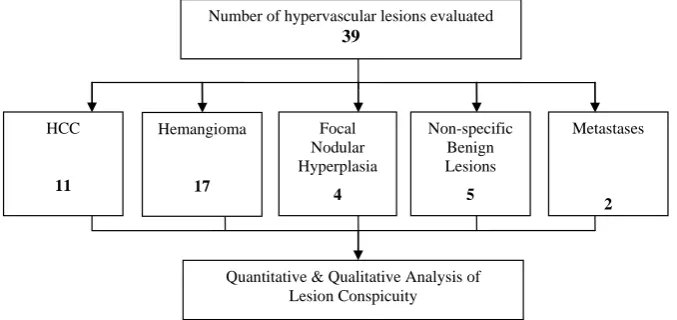
HCC
11
Quantitative & Qualitative Analysis of Lesion Conspicuity
Metastases
2
Non-specific Benign Lesions
5
Hemangioma
17
Focal Nodular Hyperplasia
4
Number of hypervascular lesions evaluated 39
Figure 4 The number and types of hypervascular lesions evaluated.
using a 5-point scale based on a set of standard reference images (Figure 3).
Statistical Analysis
Statistical analysis was performed using SPSS version 17.0 and the non-parametric Kruskal-Wallis test to examine intergroup differences among the three scan protocols for both the CI and the conspicuity scores. A p value of less than 0.05 was considered to indicate a statistically significant difference.
RESULTS
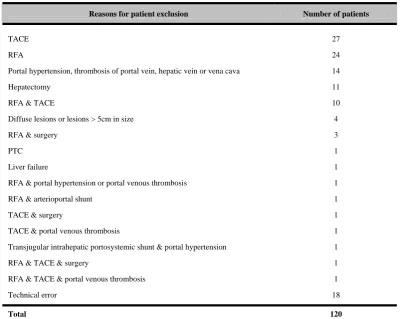
Out of 197 patients who underwent 5-phase liver CT from February to October 2008, 120 were excluded (Table 1).
Among the 77 patients who were included (40 male; 37 female; age 15–90; mean age 59, SD 13.478), 39 hypervascular liver lesions were evaluated (Figure 4).
The diagnosis of each lesion was made with a consensus achieved among the three radiologists.
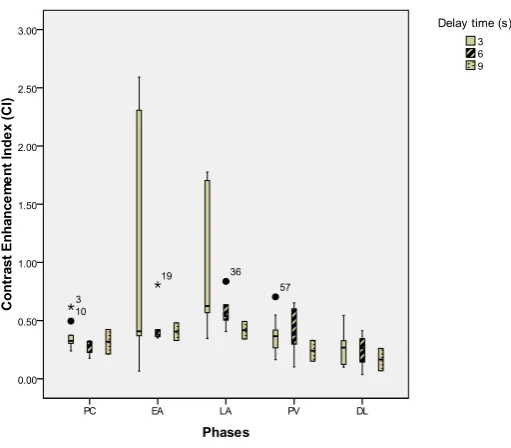
Eleven HCC were evaluated: 4 from the 3-second delay group; 3 from the 6-second delay group; 4 from the 9-second delay group. The CIs of HCC were highest in the 6-second delay group during the early arterial phase (p = 0.08) (Figure 5). The mean conspicuity scores of HCC were also higher in the 6-second delay group during both the arterial phases (p = 0.144, p = 0.465) (Figure 6).
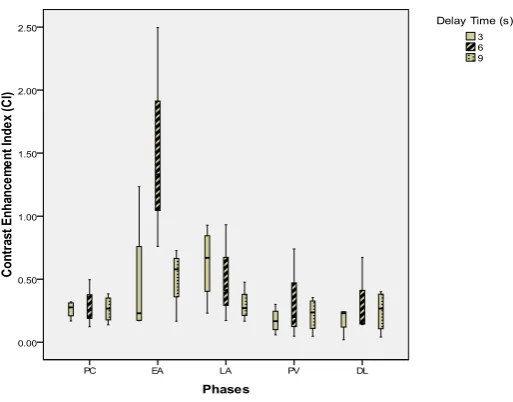
Seventeen liver hemangiomas were evaluated: 10 from the 3-second delay group; 5 from the 6-second delay group; 2 from the 9-second delay group. The CIs of liver hemangiomas were higher in the 3 seconds delay group during the early arterial & late arterial phases (p = 0.824, p = 0.163) (Figure 7). The mean conspicuity scores of liver hemangiomas were also higher in the 3-second delay group during both the arterial phases (p = 0.093, p = 0.033) (Figure 8).
[image:4.595.128.467.337.497.2]Figure 5 Box and whisker plot illustrating CI for HCC during different scan phases.
Figure 6 Mean conspicuity scores for HCCs during different scan phases.
hypervascular lesions and the hypervascular metastases, were analysed together. There were 5 hypervascular lesions in the 3-second group, 2 in the 6-second group and 4 in the 9-second group. The CI was highest in the 3-second group during the early arterial phase (p = 0.499) (Figure 9). The mean conspicuity scores for these hypervascular liver lesions are higher in the 3-second group during both the early arterial and late arterial phases (p = 0.524, p = 0.179) (Figure 10).
DISCUSSION
The automated bolus tracking technique has been widely recognised to be superior to the fixed-time delay technique in multiphase liver CT, by allowing
individualisation and better timing of the scan delay [10– 17]. However, in the authors’ institution, five-phase dynamic CT of the liver has been routinely performed using a fixed-time delay technique for the investigation, and follow-up of suspected and known liver lesions. This study aimed to determine the optimal scan delay using the bolus tracking technique for the detection of hypervascular liver lesions.
[image:5.595.170.428.348.544.2]Figure 7 Box and whisker plot illustrating CI for liver haemangioma during different scan phases.
Figure 8 Mean conspicuity scores for liver hemangiomas during different scan phases.
axis level for the detection of hypervascular HCCs. In their study, the duration of each phase scan was 4.5– 8.8 seconds and the second arterial phase scan started 6 seconds after the end of the early scan [13]. Therefore, the beginning of the early arterial phase scan ranges from 3.5 seconds to 15.2 seconds from the 100 HU threshold in the abdominal aorta.
In our study, the CIs for HCCs were significantly higher during the early arterial phase scan in the 6-second delay group (p = 0.08). Correspondingly, the mean conspicuity scores for HCCs were highest in the 6-second delay group during both the arterial phases. Given a small sample size of 11 HCCs, a p value of 0.08
inferred a statistically significant difference in a larger study population.
[image:6.595.170.428.362.562.2]Figure 9 Box and whisker plot illustrating CI for the other hypervascular lesions during different scan phases.
Figure 10 Mean conspicuity scores for the other hypervascular lesions during different scan phases.
hypervascular HCC was found to be 14–30 seconds from 100 HU threshold in the abdominal aorta at the celiac axis level [13] In our 6-second delay protocol, the actual temporal delay for the first arterial phase scan was 9 seconds from the 100 HU threshold in the abdominal aorta at the celiac axis level, which was slightly earlier than the temporal window of 14 to 30 seconds suggested by Myeong-Jin Kim et al. [13].
The injection protocols in the two studies were very similar. In the previous study, the contrast dose was adjusted according to body weight [13]. However, a standard injection protocol was applied in our study regardless of patient’s body weight. This is to avoid calculation error in contrast dosage in the setting of a busy radiology department. To overcome the potential
[image:7.595.172.429.362.548.2]Table 1. Reasons for patient exclusion.
Reasons for patient exclusion Number of patients
TACE RFA
Portal hypertension, thrombosis of portal vein, hepatic vein or vena cava Hepatectomy
RFA & TACE
Diffuse lesions or lesions > 5cm in size RFA & surgery
PTC Liver failure
RFA & portal hypertension or portal venous thrombosis RFA & arterioportal shunt
TACE & surgery
TACE & portal venous thrombosis
Transjugular intrahepatic portosystemic shunt & portal hypertension RFA & TACE & surgery
RFA & TACE & portal venous thrombosis Technical error
27 24 14 11 10 4 3 1 1 1 1 1 1 1 1 1 18
Total 120
High speed injections of up to 7 ml/s had been used in a study on HCC using dynamic 16-MDCT in cine mode by Xiaozhou Ma et al. [19] and an injection rate as high as 10 ml/s had been used by Bader et al. in a liver perfusion study. However, a moderate injection rate at 4 ml/s, which was applied in this study, has been accepted by many researchers [16] in order to avoid patients’ discomfort and to reduce the risk of extravasation. The authors also believe that the high iodine concentration of 370 mg I/mL was able to compensate for the moderate injection rate in achieving adequate conspicuity of hypervascular liver lesions.
The higher CIs of liver hemangiomas in the 3-second delay group corresponded with the higher mean conspicuity scores in the same group during both the arterial phases. The lack of statistical significance of these results may be explained by an unequal patient distribution among the three groups which had occurred by chance during random assignment of patients into one of the three groups prior to the CT examinations. There were 10 out of 17 patients (59%) with liver hemangiomas in the 3-second delay group, 5 patients (29%) in the 6-second delay group and only 2 patients (12%) in the 9-second delay group. The significantly larger sample number in the 3-second delay group compared to the other two groups could have skewed the
results to the more favourable CIs and mean conspicuity scores in this group.
Data pooling aims to increase the statistical power in the outcome of analysis. All hypervascular lesions other than HCCs and the classical hemangiomas were evaluated as a group in view of the small number of each of these lesions, which include the FNHs, the non-specific benign hypervascular lesions and the hypervascular metastases. The higher CIs of these lesions which were observed in the 3-second delay group may again be attributed to the unequal patient distribution, of which the majority (45%) was in the 3-second delay group.
observed in a nodule larger than 2 cm with a cirrhotic liver on a single dynamic imaging technique or on two dynamic imaging techniques in nodules between 1 and 2 cm [20,21]. The Asian Oncology Summit in 2009 recommended diagnosis of HCC based on characteristic image on dynamic CT or MRI regardless of tumour size without tissue biopsy (limited-resource level, level 2a evidence). The sensitivity and specificity of dynamic CT in the diagnosis of HCC was 68% (95% CI 55–80%) and 93% (89–96%); 81% (70–91%) and 85% (77–93%) for dynamic MRI, compared with pathological examination as the reference standard [22]. Although a normal serum AFP concentration (10–20 ng/mL) has been observed in 20% of HCC patients, an AFP concentration > 400 ng/mL in a patient with liver cirrhosis or chronic hepatitis (basic-resource level, level 2a evidence) [22] and a mass larger than 2 cm in a patient with an AFP > 200 ng/dL are considered diagnostic of HCC [23]. A 1–3% risk of tumour seeding during liver biopsy has been reported. Biopsy of potentially operable lesions should therefore be avoided (limited-level resource, level 2a evidence) unless a major diagnostic doubt cannot be resolved with dynamic imaging and measurement of AFP concentration (evidence grade IIa, recommendation grade B) [22, 24]. Tumour location preventing needle insertion, clotting disorders, ascites and false-negative results caused by sampling error or unfeasibility of confidently distinguishing between dysplastic changes and well-differentiated HCC are other recognised limitations of needle biopsy [21].
Liver hemangiomas were diagnosed based on the classical hypodensity similar to that of vessels on non-enhanced CT, peripheral globular enhancement isodense to that of the aorta during the arterial phases followed by centripetal fill-in pattern similar to those of the blood pool during the portal venous phase [25]. FNHs were characterised by hypervascularity during the arterial phases and isodensity in the portovenous and delayed phases. There were five lesions which did not meet the imaging diagnostic criteria of haemangioma or FNH and were unchanged on follow-up imaging. We labelled these lesions as non-specific benign hypervascular lesions. These may represent an atypical haemangioma, FNH or, less commonly, an adenoma. A definitive histopathological diagnosis was not sought because of their benign nature.
In this study, the three different CT protocols which were performed in three patient groups were compared, where the results may be affected by inter-individual variability among the different groups of patients. However, repeating the CT examination in the same patients without clear clinical indication is non-justifiable due to the large radiation dose to patient.
The biggest limitation of this study was the small sample size of each lesion group despite an acceptable size of sample population, especially for the HCC group. Almost all patients with HCCs underwent treatment which potentially altered liver vascularity prior to a follow-up imaging which made them no longer eligible for the study (85%, 112 out of 120). For patients with
hemangiomas or other benign lesions, follow-up imaging by ultrasound was preferable rather than CT or MRI.
Lesions larger than 15 cm were excluded in view of the fact that larger size lesions may affect liver vascularity. However, further analysis of data based on lesion’s size, body weight and other factors was not carried out, which may affect the conspicuity of liver lesions due to a small study sample, which is also a limitation in this study.
Thirdly, the lack of pathological proof in lesion diagnoses could be a potential limitation. Exclusion of atypical HCCs or hemangiomas, inclusion of non-HCC hypervascular lesions into the HCC group and inclusion of non-haemangiomas into the haemangioma group had been possible.
Finally, the patients in this study were not classified based on the degree of tumour angioinvasion, background cirrhosis, liver function status and fatty infiltration, which may potentially affect the enhancement pattern and the conspicuity of liver lesions.
CONCLUSION
The conspicuity of hypervascular HCCs seemed to be better on images obtained during the early arterial phase by using a bolus tracking technique with a scan delay of 6 seconds from the 100 HU threshold in the abdominal aorta at the celiac axis level, i.e. 9-second delay from the initiation of contrast injection. To compare this with delays of 15–30 seconds would require further studies as this imaging is protocol-driven. In keeping with minimising the radiation dose, it is proposed to exclude the pre-contrast phase. To exclude the delayed phase of imaging would require a larger group to be evaluated.
REFERENCES
1. Kopp AF, Heuschmid M and Claussen CD. Multidetector helical CT of the liver for tumour detection and characterization. European Radiology 2002; 12(4):745–752.
2. Oliver JH 3rd, Baron RL, Federle MP, Jones BC and Sheng R. Hypervascular liver metastases: do unenhanced and hepatic arterial phase CT images affect tumour detection? Radiology 1997; 205(3):709–715.
3. Winston CB, Koea J, Teitcher JB, Kemeny N, Brown KT and Hilton S. 3D CT angiography of the liver performed on a multidetector CT scanner. Radiology 2001; 217:417.
4. Soyer P, Poccard M, Boudiaf M, Abitbol M, Hamzi L, Panis Y, Valleur P and Rymer R. Detection of hypovascular hepatic metastases at triple-phase helical CT: sensitivity of phases and comparison with surgical and histopathologic findings. Radiology 2004; 231(2):413–420.
5. Valette PJ, Pilleul F and Crombé-Ternamian A. MDCT of benign liver tumors and metastases. European Radiology 2003; 13(Suppl 5):M31–M41.
6. Takaki H, Yamakado K, Nakatsuka A, Sakuma H, Matsumura K and Takeda K. Lesion detectability of hypervascular hepatocellular carcinoma with dynamic enhanced dual-arterial phase multidetector-row CT. Radiology 2000; 217:367.
7. Foley WD, Mallisee TA, Hohenwalter MD, Wilson CR, Quiroz FA and Taylor AJ. Multiphase hepatic CT with a multirow detector CT scanner. American Journal of Roentgenology 2000; 175(3):679–685.
Gebremariam A and Ragupathi KI. Multidetector CT of the liver and hepatic neoplasms: effect of multiphasic imaging on tumor conspicuity and vascular enhancement. American Journal of Roentgenology 2003; 180(5):1217–1224.
9. Murakami T, Kim T, Takamura M, Hori M, Takahashi S, Federle MP, Tsuda K, Osuga K, Kawata S, Nakamura H and Kudo M. Hypervascular hepatocellular carcinoma: detection with double arterial phase multi-detector row helical CT. Radiology 2001; 218(3):763–767.
10. Silverman PM, Brown B, Wray H, Fox SH, Cooper C, Roberts S and Zeman RK. Optimal contrast enhancement of the liver using helical (spiral) CT: value of SmartPrep. American Journal of Roentgenology 1995; 164(5):1169–1171.
11. Silverman PM, Roberts S, Tefft MC, Brown B, Fox SH, Cooper C and Zeman RK. Helical CT of the liver: clinical application of an automated computer technique, SmartPrep, for obtaining images with optimal contrast enhancement. American Journal of Roentgenology 1995; 165(1):73–78.
12. Kopka L, Funke M, Fischer U, Vosshenrich R, Oestmann JW and Grabbe E. Parenchymal liver enhancement with bolus-triggered helical CT: preliminary clinical results. Radiology 1995; 195(1):282–284.
13. Kim MJ, Choi JY, Lim JS, Kim JY, Kim JH, Oh YT, Yoo EH, Chung JJ and Kim KW. Optimal scan window for detection of hypervascular hepatocellular carcinomas during MDCT examination. American Journal of Roentgenology 2006; 187(1):198–206.
14. Goshima S, Kanematsu M, Kondo H, Yokoyama R, Miyoshi T, Nishibori H, Kato H, Hoshi H, Onozuka M and Moriyama N. MDCT of the liver and hypervascular hepatocellular carcinomas: optimizing scan delays for bolus-tracking techniques of hepatic arterial and portal venous phases. American Journal of Roentgenology 2006; 187(1):W25–W32.
15. Chung YE, Kim KW, Kim JH, Lim JS, Oh YT, Chung JJ and Kim MJ. Optimal delay time for the hepatic parenchymal enhancement at the multidetector CT examination. Journal of computer assisted tomography 2006; 30(2):182–188.
16. Sun X, Liu C, Liang C, Sun C, Liu S and Deng K. Hepatocellular carcinomas: Correlation between time to peak hepatocellular carcinomas enhancement and time to peak aortic enhancement. Computerized Medical Imaging and Graphics 2009; 33(4):312–316. 17. Murakami T, Onishi H, Mikami K, Iannaccone R, Federle MP,
Kim T, Hori M, Okada A, Marukawa T, Higashihara H, Passariello R and Nakamura H.. Determining the optimal timing for early arterial phase hepatic CT imaging by measuring abdominal aortic enhancement in variable contrast injection protocols. Journal of Computer Assisted Tomography 2006; 30(2):206–211.
18. Yanaga Y, Awai K, Nakaura T, Namimoto T, Oda S, Funama Y and Yamashita Y. Optimal Contrast Dose for Depiction of Hypervascular Hepatocellular Carcinoma at Dynamic CT Using 64-MDCT. American Journal of Roentgenology 2008; 190(4):1003–1009.
19. Ma X, Samir AE, Holalkere NS and Sahani DV. Optimal Arterial Phase Imaging for Detection of Hypervascular Hepatocellular Carcinoma Determined by Continuous Image Capture on 16-MDCT. American Journal of Roentgenology 2008; 191(3):772–777. 20. Willatt JM, Hussain HK, Adusumilli S and Marrero JA. MR
Imaging of hepatocellular carcinoma in the cirrhotic liver: challenges and controversies. Radiology 2008; 247(2):311–330. 21. Forner A, Vilana R, Ayuso C, Bianchi L, Solé M, Ayuso JR, Boix
L, Sala M, Varela M, Llovet JM, Brú C and Bruix J. Diagnosis of hepatic nodules 20 mm or smaller in cirrhosis: prospective validation of the non-invasive diagnostic criteria for hepatocellular carcinoma. Hepatology 2008; 47(1):97–104.
22. Poon D, Anderson BO, Chen LT, Tanaka K, Lau WY, Van Cutsem E, Singh H, Chow WC, Ooi LL, Chow P, Khin MW, Koo WH and Asian Oncology Summit. Management of hepatocellular carcinoma in Asia: consensus statement from the Asian Oncology Summit 2009. The Lancet Oncology 2009; 10(11):1111–1118. 23. Cha CH, Saif MW, Yamane BH and Weber SM. Hepatocellular
carcinoma: current management. Current Problems in Surgery 2010; 47(1):10–67.
24. Ryder SD. Guidelines for the diagnosis and treatment of hepatocellular carcinoma (HCC) in adults. Gut. 2003; 52(Suppl 3):iii1–iii8. 25. Jang HJ, Kim TK, Lim HK, Park SJ, Sim JS, Kim HY and Lee JH.